SPY going up to 593 by middle of AprilThe market is going to be bullish after the bearish move we just witnessed recently. Typically, I switch to the weekly format to see a larger move. You can see on the weekly chart, the Stoch RSI is turning bullish. I recently made a 3-day format which shows the indicators are already showing a bullish trend. I will post the 3 day chart/indicators as well as the weekly chart after this chart in my notes.
TARGETS:
53 point move: 599
1.618 move: 593.77
11 bar moves: April 17
**If it hits one of these targets, I am out of my trade.
** I will keep a close watch when the SPY hits 1 fib retracement at 575
** I changed my wording from 'day' to 'bar' moves
STOPS:
1) the low of the previous Heikin Ashi candlestick,
2) 2 red Heikin Ashi candlesticks,
3) a specific dollar amount for a total loss for my trade or
4) a specific dollar amount per contract.
**If it hits one of those stops, I am out of my trade.
I am using the Heikin Ashi candlesticks.
1) They show more of a directional movement within candlesticks.
2) They tend to filter out the market noise so you can see the market direction better.
3) It reduces false signals, allowing you to stay in the trade longer.
4) And, it gives you a smoother appearance making it easier to see trends and reversals. (This information is from Dr. Keith Wade who speaks at the Wealth365 Summits.)
Typically, I would wait until there are 2 green daily Heikin Ashi green candlesticks before entering.
I still tend to switch back and forth between Heikin Ashi candlesticks and regular candlesticks since regular candlesticks are what I am familiar with and have been using since I started trading.
I personally find:
* the 5 minute indicators typically represents what will happen in the next half and hour.
* the 10 minute indicators typically represents what will happen in the next hour.
* the 30 minute indicators typically represents what will happen in the daily.
* and, the hour indicators typically represents what will happen in the next week.
But right now, I am fine tuning my indicators and looking at the 20 to 25 minute indicators to precipitate a daily move
I use the MacD, the Stock RSI and the DMI to assist me with the direction of the market. Hopefully, I can explain these indicators more in the future.
Ask me any questions or point out anything you see wrong, as this is the only way we learn.
Happy Trading!
S27 trade ideas


A few scenarios for the SPY! 🔉Sound on!🔉
📣Make sure to watch fullscreen!📣
Thank you as always for watching my videos. I hope that you learned something very educational! Please feel free to like, share, and comment on this post. Remember only risk what you are willing to lose. Trading is very risky but it can change your life!

Will start longs at 516I think SPY is going down to 516 (0.382 Fibonacci retracement) and could go down to 485 (0.500 Fibonacci retracement). I will start taking long positions again at 516. Back in 2022 there was a 0.500 Fibonacci retracement where SPY went from 479 to 348 but I know people have short memories.

Spy Road To $544 Target HIT Now WhatWell we finally hit our target a lot of us went heavy in shorts right before the bell rang in many Etf's SPY QQQ Tsla with massive amounts of money With Expirations Expiring 4/3 4/5 and also 2weeks out.... Don't Ever Miss Another Move in the stock market again stay up to date With JoeWtrades.... So I guess everyone wants to know what's next Bear Market Bull Market is the the bottom in ext.... Nope this is not the bottom, i already have a plan on what's going to happen price will continue to fall Friday Over the Weekend Resulting in a possible Dead Cat Bounce come Tuesday in my opinion back to $550ish, Wait what did you say yes $dead cat bounce to $550ish in the next few days possibly Tuesday so this means this is not the bottom JoeWtrades , Nope in my opinion its not Like and follow to see in my opinion on where price goes, if you need assistance and would like to take your trading and scalping to the next level You know what to do.... As Always safe trades and good luck

SPY - Support st 40 Mo. AgvIn doing long term analysis last year, I noticed that major waves 2 and 4 generally terminate at the 40 month moving average. So it appears that 472 is the current target. Keep in mind however that wave 5 will eventually take us to new highs. Then, - LOOK OUT BELOW

$SPY Big Support at 540 and 50% fib levelAMEX:SPY Big Support at 540 and 50% fib level, I thinks it's unlikely to break the $540 mark.

Trump's Tariff Wars : What To Expect And How To Trade Them.I promised all of you I would create a Trump's Tariff Wars video and try to relate that is happening through the global economy into a rational explanation of HOW and WHY you need to be keenly away of the opportunities presented by the new Trump administration.
Like Trump or not. I don't care.
He is going to try to enact policies and efforts to move in a direction to support the US consumer, worker, business, and economy.
He made that very clear while campaigning and while running for office (again).
This video looks at the "free and fair" global tariffs imposed on US manufacturers and exports by global nations over the past 3+ decades.
For more than 30+ years, global nations have imposed extreme tariffs on US goods/exports in order to try to protect and grow their economies. The purpose of these tariffs on US good was to protect THEIR workers/population, to protect THEIR business/economy, to protect THEIR manufacturing/products.
Yes, the tariffs they imposed on US goods was directly responsible for THEIR economic growth over the past 30-50+ years and helped them build new manufacturing, distribution, consumer engagement, banking, wealth, and more.
The entire purpose of their tariffs on US goods was to create an unfair advantage for their population to BUILD, MANUFACTURE, and BUY locally made products - avoiding US products as much as possible.
As I suggested, that is why Apple, and many other US manufacturers moved to Asia and overseas. They could not compete in the US with China charging 67% tariffs on US goods. So they had to move to China to manufacture products because importing Chinese-made products into the US was cheaper than importing US-made products into China.
Get it?
The current foreign Tariffs create an incredibly unfair global marketplace/economy - and that has to STOP (or at least be re-negotiated so it is more fair for everyone).
And I believe THAT is why Trump is raising tariffs on foreign nations.
Ultimately, this will likely be resolved as I suggest in this video (unless many foreign nations continue to raise tariff levels trying to combat US tariffs).
If other foreign nation simply say, "I won't stand for this, I'm raising my tariff levels to combat the new US tariffs", then we end up where we started - a grossly unfair global marketplace.
This is the 21st century, not the 18th century.
Step up to the table and realize we are not in the 1850s or 1950s any longer.
We are in 2025. Many global economies are competing at levels nearly equal to the US economy in terms of population, GDP, manufacturing, and more.
It's time to create a FREE and FAIR global economy, not some tariff-driven false economy on the backs of the US consumers. That has to end.
Get some.
#trading #research #investing #tradingalgos #tradingsignals #cycles #fibonacci #elliotwave #modelingsystems #stocks #bitcoin #btcusd #cryptos #spy #gold #nq #investing #trading #spytrading #spymarket #tradingmarket #stockmarket #silver

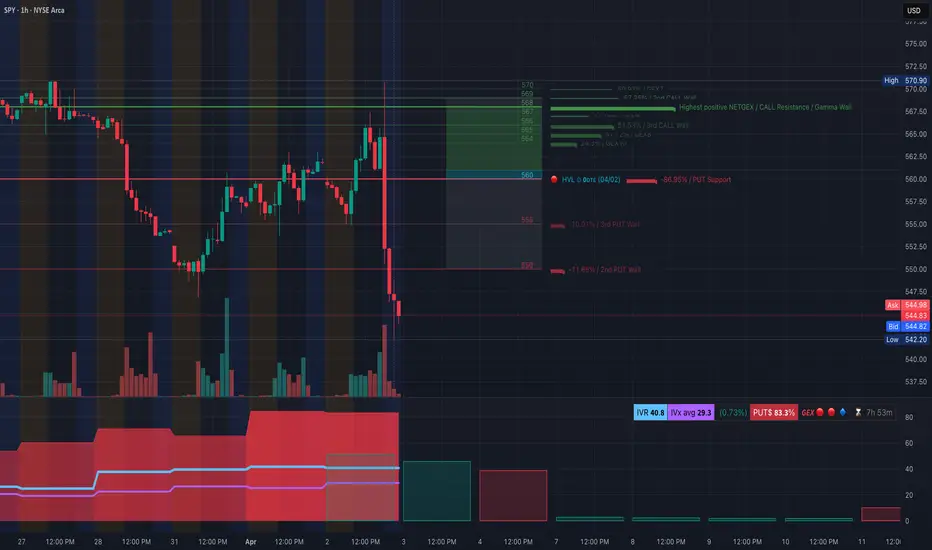
SPY Slammed After Tariff Shock! Dealer Gamma TrapSPY Slammed After Tariff Shock! Dealer Gamma Trap Accelerates Drop 🔻
🌎 Context: April 2, 2025
Today’s Trump tariff news set off a panic wave in the market — triggering a sharp sell-off in major indices. SPY, the S&P 500 ETF, lost grip on its HVL ($560) and flushed into a dealer short-gamma zone, where volatility surged as hedging flows flipped bearish.
Key Narrative:
* Macro shock = Tariff fears
* Market wasn’t positioned = IV spike + dealer scrambling
* Result = Gamma-driven slide with no call support nearby
🧭 Technical Breakdown – 1H Chart
🔻 Price Action:
* SPY broke down from $567-$565 support range.
* Panic candle sliced through HVL $560 and continued through $550, tagging $542.20 intraday low.
* The entire move below HVL now triggers short-gamma conditions.
📌 Support Zones:
* $544.82 (currently testing)
* $542.20 (session low)
* Below that? Thin air until $538–$535 zone from macro FVGs.
🔼 Resistance Zones:
* $550 = now resistance (2nd PUT Wall)
* $555 = 3rd PUT Wall (likely a pause/reload area)
* $560 = HVL / Former gamma support flipped resistance
🧠 GEX + Options Sentiment
💣 Gamma Exposure (GEX):
* 🚨 GEX flipped heavily negative under $560.
* HVL $560 has collapsed.
* Dealers are now short gamma, adding to volatility and forced selling pressure.
🔴 Gamma Risk Zones:
* PUT Support at $560 (-86.95% GEX)
* Walls stacked at $555 and $550 → now broken
* NO significant GEX support until $540 — more room to fall
📈 Options Oscillator:
* IVR 40.8 / IVx Avg 29.3 → Elevated volatility with room to run
* PUTS 83.3% dominance = bearish sentiment confirmed
* Red Red Blue GEX = maximum dealer pain, negative gamma loop
🧭 Trade Setups Based on Current Conditions
🐻 Bearish Breakdown (Primary Bias)
* Entry: Under $543 (below today's low)
* Target: $540 → $535
* Stop: Over $550 reclaim
* Contract: 0DTE/2DTE $545P or $540P for gamma scalping
* Note: Dealer hedging is directional, be precise and fast
🐂 Relief Bounce Setup (Low Conviction)
* Only valid if SPY reclaims $550 and shows slowing momentum
* Possible dead-cat bounce to $555–$560
* Prefer spreads due to high IV and fast time decay
📌 Key Levels Summary
HVL (Former Support) $560 Gamma flip zone — now resistance
Gamma Pivot $550 Broke down — keep an eye on it
Support Zone $542.20 Session low
Downside Target $540 → $535 If gamma slide continues
💭 My Thoughts: This Is a Gamma Meltdown
Today’s tariff headlines sparked a reflexive gamma cycle — as dealers flipped from long to short gamma, they were forced to hedge dynamically, driving SPY deeper into a liquidity vacuum.
This is not your regular dip — it’s a liquidity and dealer flow event, so everything moves faster, with wild swings possible into the close or tomorrow.
Unless SPY reclaims HVL at $560 fast, expect continuation or chop within this danger zone. VIX rising + GEX red = recipe for pain.
📢 Final Notes:
* Use defined risk.
* Don’t overstay puts.
* Gamma moves cut both ways — expect volatility.
* Track GEX hourly if possible.
Disclaimer: For educational purposes only. This is not financial advice. Always do your own research and protect your capital.
SPY/QQQ Plan Your Trade For 4-3 : GAP Breakaway PatternFirst off, thank you for all the great comments and accolades related to my calling this breakdown (nearly 60+ days ago).
Did I get lucky having these new tariffs announced, causing the markets to break downward? Probably.
Did my research suggest the markets were going to break downward anyway? YES.
Did my research predict these tariffs? NO.
My research is specifically price-based. You'll notice I don't use many indicators, other than my proprietary price pressure and momentum indicators.
The purpose of what I'm trying to teach all of you is that price is the ultimate indicator. You can use other indicators if you find them helpful. But, you should focus on the price chart and try to learn as much as you can from the price chart (without any indicators).
Why, because I believe price tells us everything we need to know and we can react to price more efficiently than getting confused by various technical indicators.
At least, that is what I've found to be true.
Today's pattern suggests more selling is likely. After the markets open, I suggest there will be a bunch of longs that will quickly be exited and shorts that will be exited (pulling profits). Thus, I believe the first 30-60 minutes of trading could be extremely volatile.
My extended research suggests the markets will continue to try to move downward (over the next 60+ days) attempting to find the Ultimate Low. But, at this point, profits are profits and we all need to BOOK THEM if we have them.
We can always reposition for the next breakdown trade when the timing is right.
Gold and Silver are moving into a PANIC selling phase. This should be expected after the big tariff news. Metals will recover over the next 3-5+ days. Get ready.
BTCUSD is really not moving on this news. Kinda odd. Where is BTCUSD as a hedge or alternate store of value? I don't see it happening in price.
What I do see is that BTCUSD is somewhat isolated from this tariff news and somewhat isolated from the global economy. It's almost as if BTCUSD exists on another planet - away from global economic factors.
Still, I believe BTCUSD will continue to consolidate, attempting to break downward over the next 30+ days.
Remember, trading is about BOOKING PROFITS and moving onto the next trade. That is what we all need to focus on today.
Get Some.
#trading #research #investing #tradingalgos #tradingsignals #cycles #fibonacci #elliotwave #modelingsystems #stocks #bitcoin #btcusd #cryptos #spy #gold #nq #investing #trading #spytrading #spymarket #tradingmarket #stockmarket #silver

SPY Update + Learn & Understand the concept below!!Red vs. Teal has been the storyline for this downward momentum and it continues to be as we saw a strong hold from (bullish) red earlier in the week and after rejecting off of teal yesterday, this subsequent gap down that we're currently seeing.
If we've built enough bearish liquidity utilizing our green controlled buying, we can see this dump penetrate this 547 support level and continue deeper with a mid-term target in the low $500's.
However, if sufficient liquidity hasn't been built, per the laws of S&D, we will need to continue higher for a bit to grab more sellers and soak up more buyers prior to that penetration.
Whenever the move seems too obvious in the market, expect it to look that way purposely and for it to be a trap. Get you to sell when it's so obviously bearish - and then the market pushes up as you realize that everyone who sold is the reason why it's going to now push up - big money will force you and the others to buy back your sells at a higher price/loss and that's where big money then swoops in, when things maybe started to look a bit bullish, and pushes the market down by selling back to you all your stop loss buys in one fell swoop!
Learn this concept, understand it, and your trading will change forever. That knowledge combined with an understanding of how the algorithms inform the market's liquidity, is why I draw so many lines on my chart.
Happy Trading :)

Franco trade 0.0//@version=5
strategy("OBV + Moving Averages Strategy", overlay=true)
// 參數設置
length_OBV = input(1, "OBV 增量") // OBV的變動閥值
length_maVolume = input(50, "50日均量") // 50日均量
length_maShort = input(5, "5日均線") // 5日均線
length_maLong = input(13, "13日均線") // 13日均線
take_profit = input(0.1, "止盈比例 (10%)") // 10%止盈
stop_loss = input(0.05, "止損比例 (5%)") // 5%止損
// 計算技術指標
obvValue = ta.cum(ta.volume * math.sign(ta.change(close))) // OBV指標
maVolume = ta.sma(volume, length_maVolume) // 50日均量
maShort = ta.sma(close, length_maShort) // 5日均線
maLong = ta.sma(close, length_maLong) // 13日均線
// 買入條件
buy_condition = ta.crossover(maShort, maLong) and // 5日均線上穿13日均線
obvValue > ta.highest(obvValue , length_OBV) and // OBV創新高
volume > maVolume // 成交量大於50日均量
// 賣出條件
sell_condition = ta.crossunder(maShort, maLong) or // 5日均線跌破13日均線
obvValue < ta.lowest(obvValue , length_OBV) or // OBV走弱
strategy.position_size > 0 and (strategy.position_avg_price * (1 + take_profit) < close or // 達到止盈目標
strategy.position_avg_price * (1 - stop_loss) > close) // 達到止損目標
// 執行交易策略
if buy_condition
strategy.entry("Long", strategy.long)
if sell_condition
strategy.close("Long")

VISUAL INVESTOR: An Investing Tutorial for EveryoneToday is a wonderful day! I am overwhelmed with positive emotions, like a racer who has crossed the finish line. My first book, The Visual Investor, is out on TradingView. It's written for everyone, from those just starting out in the stock market to experienced investors. You could say you're holding it in your hands now.
The idea for this book came to me a long time ago, thanks to the influence of one person, as well as my invisible teachers: Benjamin Graham, Warren Buffett, Charles Munger, Peter Lynch and Mohnish Pabrai. Day after day, I worked on the content of chapters, charts, tables, and drawings to take you from theoretical foundations to applied knowledge that allows you to answer the key questions of any investor: What? When? And how much?
My motivators, namely you, dear subscribers and the TradingView editorial team, also made an invaluable contribution to the creation of this book. Every kind word, constructive criticism and award in the form of “Editors’ Picks” made me happier and helped me to create further.
Why “Visual Investor”? This is my reverence for the technologies we have come to now. The modern investor has incredible opportunities compared to our colleagues, even from the beginning of the 21st century. Access to companies' financial data has become an order of magnitude easier, and their visualization allows for fundamental analysis to be done much faster than before.
Global financial centers are now much closer to investors from different countries, thanks to the development of local regulation, active work of financial institutions and services. All this has expanded the range of investment instruments and formed a new way of life for our savings.
A modern person may not be a passive observer of fluctuations in the purchasing power of his own capital. On the contrary, he can independently make decisions to increase this capacity, using technology and a systematic approach. Unfortunately, unmanaged savings will suffer the unenviable fate of the hundred dollar bill from the beginning of the last century.
This chart shows how the $100 bill has depreciated since 1914 due to inflation. By the beginning of the First World War, the monthly salary of a highly skilled worker or employee could reach exactly this amount. If your super-rich great-great-grandfather buried a chest of these bills, and you found it, you'd probably be furious with him. Because $100 now is like $2 then. “Dear Grandpa, why didn’t you buy something from that list ?” you might say in your heart.
However, we must give credit to our hero, as the propensity to save is a skill that any investor should start with, and something I talk about in the early chapters of my book. As Charles Munger said, “I was a cautious little squirrel who hoarded more nuts than I needed and didn’t climb into my own pile of nuts.”
The book is divided into three parts, allowing you to start with any of them, depending on your current level of knowledge.
Part One
This part will be interesting to anyone who wants to understand why we need investments, what a joint-stock company and a stock exchange are, how the price and its schedule are formed. Duration of study: 3 hours 15 minutes.
Part two
This part will be of interest to anyone who already knows the basics of stock trading but wants to understand the fundamental analysis of a company's business. Duration of study: 5 hours.
Part three
This part will be of interest to anyone who understands the financial statements of companies and wants to build a decision-making system on the stock market based on this knowledge. Duration of study: 11 hours.
I recommend reading the book “Visual Investor” thoughtfully, with pauses to understand each chapter. It is precisely with this measured pace in mind that the estimated duration of study for each block and each article has been calculated. You can move faster if you like. If you devote 1 hour a day to the book, then after 20 days you will be able to master the entire theory. Don't rush to apply the knowledge immediately you've gained in real life. TradingView has great tools for hands-on research, such as the Market Simulator and Paper Trading, that will help you solidify your knowledge without risking your capital. Similarly, civil aviation pilots train on a flight simulator before their first flight. Remember that your knowledge, systematic approach, persistence and a pinch of luck can transform everything around you. But if you still need my support, I'm here. Yours, Capy.
Part One
1. Investing is the ability to say "no" so that you can say "yes"
The reader will learn that investing is a conscious skill of foregoing immediate spending in favor of greater value in the future, based on strategy, patience, and an understanding of the difference between investing and speculation. Duration of study: 15 minutes.
2. Raising initial capital: 4 approaches, of which one is not good
The reader will learn about four ways to form start-up capital for investments, and why borrowed money is the least sensible of them. Duration of study: 10 minutes.
3. The lifestyle of your savings, and why Big Mac?
The reader will learn that investing is a conscious way to preserve and increase the purchasing power of savings, in which the level of potential profit is always proportional to the risk taken. Duration of study: 10 minutes.
4. What is a stock? Let me tell you a story
Using the example of a shoe workshop owner, the reader will learn how companies issue shares to raise capital and expand their business. Duration of study: 15 minutes.
5. Stock Company. Selling something that no one will buy piecemeal
Using the same example, the reader is explained the process of transforming a company into a joint-stock company and conducting an IPO to attract investment. Duration of study: 10 minutes.
6. I dream of entering the stock market. The question is: What for?
The reader learns that going public is a way for a company to make its shares available to a wider range of investors, increase liquidity, and simplify the process of raising capital. Duration of study: 10 minutes.
7. How is the share price formed on the stock exchange? We do it
The reader will learn how the price of a stock is formed on the stock exchange through the mechanism of bids from buyers and sellers, reflecting the balance of supply and demand. Duration of study: 20 minutes.
8. Bid/Offer: The Yin and Yang of Stock Prices
The reader will learn how buy (bid) and sell (offer) orders from the order book on the exchange, determining the mechanism for concluding transactions and the formation of the market price. Duration of study: 20 minutes.
9. Market order or the hunger games of stock trading
The reader will learn that market orders allow shares to be bought or sold immediately without specifying a price, satisfying the current demand or offer at prices available in the order book. Duration of study: 15 minutes.
10. The birth of the chart. The evolution of the tape
The reader will learn how price movement charts are formed from the stock exchange quotes feed and will see historical examples of the evolution of methods for displaying market data. Duration of study: 10 minutes.
11. Japanese Candlesticks: Game of Body and Shadows
The reader will learn how Japanese candlesticks are constructed, including determining the opening, closing, high, and low prices for a selected time interval, as well as the importance of the candlestick body and shadows in analyzing price movements. Duration of study: 20 minutes.
12. A little bit about volumes and the master of all averages
The reader will learn how to analyze trading volumes and use a 252-day moving average to evaluate stock price movements. Duration of study: 10 minutes.
13. My Three Comrades: the Chart, the Screener, and the Watchlist
The reader will learn step-by-step how to use the TradingView platform's chart, screener, and watchlist features to find and track stocks even if he doesn't know the company's ticker. Duration of study: 15 minutes.
14. Two captains of the same ship
The reader will learn how to use fundamental analysis to assess a company's financial strength by adding financial indicators to a chart in TradingView, and why the author prefers this method over technical analysis. Duration of study: 15 minutes.
Part two
15. My crazy partner is Mr. Market!
The reader will learn about the concept of "Mr. Market" introduced by Benjamin Graham, which illustrates the irrationality of market behavior and emphasizes the importance of fundamental analysis in making sound investment decisions. Duration of study: 10 minutes.
16. Picking rules - the Lynch method
The reader will learn about Peter Lynch's investment principles, including the benefits of private investors, the importance of a financial safety net, the need to understand a company's performance before investing, and the importance of analyzing its earnings. Duration of study: 15 minutes.
17. A pill for missed opportunities
The reader will learn how to set up alerts in TradingView to react promptly to changes in stock prices, thereby avoiding missing profitable opportunities to buy or sell. Duration of study: 15 minutes.
18. Man on the shoulders of giants
The reader learns the story of an Indian engineer who, after starting to invest in his 30s, achieved significant success, emphasizing the importance of self-education and inspiration from eminent investors. Duration of study: 10 minutes.
19. Price is what you pay, but value is what you get
The reader will learn about Warren Buffett's approach to investing based on the difference between price and the intrinsic value of a company, and the importance of fundamental analysis in making investment decisions. Duration of study: 10 minutes.
20. Balance sheet: taking the first steps
The reader will learn about the structure of the balance sheet, including the concepts of assets, liabilities, and equity. Duration of study: 30 minutes.
21. Assets I prioritize
The reader will learn which balance sheet items are most important for assessing a company's sales performance, and why the author focuses on cash, accounts receivable, and inventory when analyzing current assets. Duration of study: 20 minutes.
22. A sense of debt
The reader will learn about the structure of liabilities and shareholders' equity on a company's balance sheet, including the differences between short-term and long-term debt, and will understand how to analyze debt burden when assessing a company's financial health. Duration of study: 20 minutes.
23. At the beginning was the Equity
The reader will learn about a company's capital structure, including the concepts of retained earnings and return on investment, and will understand how these items are reflected in the balance sheet. Duration of study: 20 minutes.
24. The income statement: the place where profit lives
The reader will learn about the structure of a company's income statement, including key indicators: revenue, cost, gross and operating profit, as well as the importance of these metrics for assessing the financial condition of the enterprise and their impact on the dynamics of stock prices. Duration of study: 30 minutes.
25. My precious-s-s-s EPS
The reader learns that earnings per share (EPS) is calculated as net income available to common shareholders divided by the number of common shares outstanding, and that diluted EPS considers potential increases in the share count due to employee options and other factors that affect earnings distributions. Duration of study: 20 minutes.
26. What should I look at in the Income statement?
The reader will learn which key income statement metrics — such as revenue, gross profit, operating expenses, debt service expense, net income, and diluted earnings per share (EPS Diluted) — the author believes are most important for assessing a company's financial health. Duration of study: 10 minutes.
27. Cash flow statement or Three great rivers
The reader will learn about the structure of the cash flow statement, which includes three main flows: operating, financial and investing, and will understand how these cash flows affect the financial condition of the company. Duration of study: 20 minutes.
28. Cash flow vibrations
The reader will learn how to analyze a company's operating, investment, and financial cash flows to assess its sustainability, strategy, and ability to effectively manage resources. Duration of study: 20 minutes.
29. Financial ratios: digesting them together
The reader will learn that financial ratios are relations between various financial reporting indicators that allow an objective assessment of the financial condition and value of a company, and will understand how to use key multiples to analyze the investment attractiveness of a business. Duration of study: 25 minutes.
30. What can financial ratios tell us?
The reader will learn about key financial ratios such as Diluted EPS, Price/Earnings Ratio (P/E), Gross Margin, Operating Expense Ratio, Return on Equity (ROE), Days Payable and Days Sales Outstanding, and Inventory to Revenue Ratio, and will understand how to use these metrics to assess a company's financial health and investment attractiveness. Duration of study: 30 minutes.
Part three
31. Price / Earnings: Interpretation #1
The reader will learn how the P/E (price to earnings) ratio helps assess the value of a company by determining how many dollars an investor pays for each dollar of earnings, and will understand why a lower P/E may indicate that a company is undervalued. Duration of study: 25 minutes.
32. Price/Earnings: amazing interpretation #2
The reader will learn an alternative approach to interpreting the P/E ratio by viewing it as the number of years it takes to break even on an investment, assuming the company's earnings are stable. Duration of study: 30 minutes.
33. How to apply an indicator that is only available upon request?
The reader will learn how scripts written in Pine Script work on the TradingView platform and what levels of access there are to them: from completely open to requiring an invitation from the author. The article explains how to request access to an indicator if it is restricted, and what steps to take to add it to a chart once permission is granted. Duration of study: 15 minutes.
34. How to assess the fundamental strength of the company?
The reader will learn about the approach to assessing the financial stability of a company through the aggregation of key financial indicators and multipliers, allowing a visual and quantitative assessment of the dynamics and current state of the business. Duration of study: 30 minutes.
35. How to evaluate the work of company management?
The reader will learn about the approach to assessing the effectiveness of a company's management through the prism of the concept described by Eliyahu Goldratt in his book "The Goal", which focuses on three key indicators: throughput, inventory and operational expenses, and will understand how these indicators affect the financial results of the enterprise. Duration of study: 30 minutes.
36. How to evaluate the state of a company's cash flows?
The reader will learn about the importance of cash flow analysis in assessing a company's financial health, including the interpretation of operating, investing, and financing flows. Duration of study: 25 minutes.
37. How to catch the rainbow by the tail?
The reader will learn how to determine optimal price ranges for buying stocks based on the principles of fundamental analysis and the idea of investing with a margin of safety. Duration of study: 40 minutes.
38. How to convert craziness into results?
The reader will learn how to navigate market volatility, make smart stock selling decisions, and use a fundamental approach to turn emotional market swings into rational investment actions. Duration of study: 35 minutes.
39. How to use Replay to study indicators?
The reader will learn how to use the Market Simulator feature on the TradingView platform to analyze historical data and test indicators, including step-by-step instructions for activating the simulator, selecting the start date, adjusting the playback speed, and interpreting the results when analyzing NVIDIA Corporation stock. Duration of study: 30 minutes.
40. How to explain my decision-making system?
The reader will learn about the author's approach to choosing stocks for investment, which includes an analysis of the fundamental strength of the company, cash flow dynamics, news, P/E multiple and other aspects of the decision-making system. Duration of study: 35 minutes.
41. The most subjective facet of my decision-making system
The reader will learn how news, although difficult to formalize, influences the investment decision-making process and why its interpretation is the most subjective aspect in stock evaluation. Duration of study: 35 minutes.
42. Full instructions for studying the fundamental strength of a company
The reader will learn how to use applied tools to evaluate a company's financial results, visually track their dynamics over time, and analyze the movement of key cash flows, which accelerates the process of selecting companies with strong fundamental indicators. Duration of study: 90 minutes.
43. Full instructions for determining price ranges for opening and closing positions
The reader will learn how to determine optimal price ranges and trade sizes when investing in stocks, based on the principles of value investing and Benjamin Graham's "margin of safety" concept. Duration of study: 120 minutes.
44. 10 tricks for developing discipline or here was Warren
The reader will learn ten practical methods to help investors develop discipline, including using alerts, keeping a trading journal, and developing good habits, and will understand how discipline affects the achievement of investment goals. Duration of study: 40 minutes.
45. The Inside Out Investor
The reader will learn how emotional states such as fear, excitement, and fear of missing out (FOMO) influence investment decisions and will understand how awareness of these emotions helps an investor stick to their chosen strategy and make informed decisions. Duration of study: 20 minutes.
46. Effective inefficiency
The reader will learn about the different approaches to using Stop Losses in investment strategies, their impact on the profit/loss ratio, as well as the concept of market efficiency and strategies in it. Duration of study: 30 minutes.
47. Institute of Intermediation and 24 Coffee Lovers
The reader will learn about the factors that create market inefficiencies, such as delays in the dissemination of information, high volatility, the actions of large players and participant errors, as well as the role of intermediaries - brokers and exchanges - in ensuring the efficiency and convenience of trading in financial markets. Duration of study: 25 minutes.
48. Eternal Sunshine of the Spotless Mind
The reader will learn about the life of Charles Munger, vice chairman of Berkshire Hathaway, his investment philosophy based on common sense and discipline, as well as his views on the importance of personal relationships and moderation in achieving success. Duration of study: 5 minutes.

SPY: Yet another bearish SPY forecastLooking at the previous sell-off patterns, theres a strong possibility that if the downtrend continues, SPY will head to low 500's by mid-May before rebounding in the summer to retest current levels (540-560) before completing the final leg (or first) of a correction to the high mid-high 400 price level - or potentially low 400s in September. Its been a while since I've shared a predictive chart but the current market behavior makes it hard not to try to paint a picture. Heaps of salt to be taken - I've been wrong many times before

Nightly $SPY / $SPX Scenarios for April 3, 2025🔮 🔮
🌍 Market-Moving News 🌍:
🇺🇸📈 President Trump's 'Liberation Day' Tariffs Implemented: On April 2, President Donald Trump announced a series of new tariffs, referred to as "Liberation Day" tariffs, aiming to address trade imbalances. These include a baseline 10% tariff on all imports, with higher rates for specific countries: 34% on Chinese goods, 20% on European Union products, and 25% on all foreign-made automobiles. The administration asserts these measures will revitalize domestic industries, though critics warn of potential price increases for consumers and possible retaliatory actions from affected nations.
📊 Key Data Releases 📊
📅 Thursday, April 3:
📉 Initial Jobless Claims (8:30 AM ET):
Forecast: 225,000
Previous: 224,000
Measures the number of individuals filing for unemployment benefits for the first time during the past week, providing insight into the labor market's health.
📈 Trade Balance (8:30 AM ET):
Forecast: -$76.0 billion
Previous: -$131.4 billion
Indicates the difference in value between imported and exported goods and services, reflecting the nation's trade activity.
🏢 ISM Services PMI (10:00 AM ET):
Forecast: 53.0
Previous: 53.5
Assesses the performance of the services sector; a reading above 50 suggests expansion.
⚠️ Disclaimer: This information is for educational and informational purposes only and should not be construed as financial advice. Always consult a licensed financial advisor before making investment decisions.
📌 #trading #stockmarket #economy #news #trendtao #charting #technicalanalysis


ONE LINE: A focused trendline view Sometimes it's all you need. When I choose ONE spot I am looking at, I am honing in not just on tops and bottoms, but I have found that the spots with the most frequent historical PIVOTS and highest traffic areas are the areas that the price action gets hung up on, pauses, or pivots most often. And this bearish drop seems to be taking dead aim at that $550(ish) spot.

Spy I think we have one more leg down to 538-540 before earnings season kicks off next week ..
NASDAQ:QQQ and TVC:DJI showing same chart
I will update this more later but I wanted to get this out before market closes... Of course if we gap above trendline resistance and CLOSE above it the the resistance is negated .
Another, you see that gap from March 14th that the spy and Qqq closed? Well the Dow Jones gap is still left open and TVC:NYA

Using The CRADLE Pattern To Time/Execute TradesThis simple video highlights one of my newest pattern definitions - the Cradle Pattern.
In addition to the many other patterns my technology identified, this Cradle Pattern seems to be a constant type of price construct.
I'm sharing it with all of you so you can learn how to identify it and use it for your trading.
Ideally, this pattern represents FLAGGING after a trend phase.
It is a consolidation of price within a flag after a broad trending phase.
It usually resolves in the direction of the major trend, but can present a very solid reversal trigger if the upper/lower pullback range is broken (see the examples in this video).
Learn it. Use it.
Price is the ultimate indicator.
Learn to read price data more efficiently to become a better trader.
Get some.
#trading #research #investing #tradingalgos #tradingsignals #cycles #fibonacci #elliotwave #modelingsystems #stocks #bitcoin #btcusd #cryptos #spy #gold #nq #investing #trading #spytrading #spymarket #tradingmarket #stockmarket #silver

SPY/QQQ Plan Your Trade Update Update For 4-2 : ConsolidationThis quick update shows why I believe the SPY/QQQ will struggle to make any big move as long as we stay within the 382-618 "Battle Zone".
The SPY continues to rally up into this zone and stall out. If the SPY stays within this zone, I believe the markets will simply roll around in a tight range and go nowhere today.
Thus, I published this article to warn traders not to expect any big trends until we breakout - away from this Fibonacci "Battle Zone".
You can't kick the markets to make it go anywhere. And, unless you are trading very short-term swings in price - you are probably better off sitting on the sidelines waiting for a broad market trend to establish.
This is a warning. As long as we stay in the Fibonacci "Battle Zone", price will struggle to build any major trend.
So, play your trades accordingly - or just take a break from trading while you wait for the markets to roll out of the "Battle Zone".
Get some.
#trading #research #investing #tradingalgos #tradingsignals #cycles #fibonacci #elliotwave #modelingsystems #stocks #bitcoin #btcusd #cryptos #spy #gold #nq #investing #trading #spytrading #spymarket #tradingmarket #stockmarket #silver

SPY/QQQ Plan Your Trade For 4-2 : GAP Reversal Counter TrendToday's pattern suggests price may attempt to move downward in early trading, trying to find support near recent lows, then potentially roll a bit higher.
I do expect price to move into a downward price trend - attempting to break below the 549 price level and targeting the 535-545 target Fib level this week.
Today, Thursday, and Friday are all GAP/Breakaway types of patterns. So we should be entering an expansion of price trend and I believe that trend will be to the downside.
Gold and Silver are nearing a Flag Apex level. Very exciting for a potential breakout rally driving Gold up above $3250 and Silver up above $36.
I personally believe there is nothing stopping Gold and Silver in this rally phase until Gold reaches levels above $4500. GET SOME.
BTCUSD had a very interesting spike low. I still believe BTCUSD will roll downward - targeting the $76-78k level, then break downward towards the $60k level. Time will tell.
The rest of this week should be very exciting with the Breakaway and GAP patterns.
Get some.
#trading #research #investing #tradingalgos #tradingsignals #cycles #fibonacci #elliotwave #modelingsystems #stocks #bitcoin #btcusd #cryptos #spy #gold #nq #investing #trading #spytrading #spymarket #tradingmarket #stockmarket #silver

SPY, S&P 500 expected to correct to 500 before further upsideBased on RSI divergence, EW count and volume support it seems likely that SPY will correct to equal leg (ABC) region between 480-520 before the correction is over and further upside can be seen.

What Is the Difference Between ETFs and Index Funds?What Is the Difference Between ETFs and Index Funds?
ETFs and index funds are designed to provide access to diversified portfolios of assets, often tracking the performance of a specific market index. But while they may appear similar at first glance, they have distinct characteristics that cater to different types of investors and strategies. This article breaks down the key differences between ETFs vs index funds, explores how they work, and explains why traders and investors might choose one over the other.
What Are ETFs?
Exchange-traded funds (ETFs) are investment vehicles that trade on stock exchanges, much like individual shares. They’re structured to replicate the performance of a particular benchmark, sector, commodity, or a combination of asset classes.
What sets ETFs apart is their flexibility. Traders and investors buy and sell ETFs throughout the trading day at market prices. This makes them particularly appealing to active traders who value liquidity and the ability to react quickly to price movements.
Another key advantage is their typically low cost. Most ETFs are passively managed, meaning they aim to replicate a benchmark rather than beat it. This reduces management fees, making ETFs a cost-effective choice compared to actively managed offerings.
ETFs also offer diversification in a single transaction. By trading one ETF, investors can gain exposure to hundreds or even thousands of underlying securities. This makes them a popular choice for spreading risk across multiple assets.
What Are Index Funds?
Index funds are investment vehicles designed to mirror the performance of a specific index, like the FTSE 100 or the S&P 500. An index fund provides broad exposure by holding a portfolio of assets that closely matches the composition of the benchmark it tracks. An index vehicle tracking the S&P 500 would invest in the 500 largest companies in the US, in the same proportions as the index. This passive strategy keeps costs low, as there’s no need for active management or frequent trading decisions.
So, how is an index fund different from an exchange-traded fund? The index fund can take the form of either an ETF or a mutual fund; for instance, the SPDR S&P 500 ETF, or SPY, is an index fund.
Mutual fund versions of index funds are traded at the end-of-day net asset value (NAV), while ETF versions are bought and sold throughout the trading day like individual shares. This distinction is important for traders considering factors like liquidity and pricing flexibility.
Low-cost index funds are popular for their relative simplicity compared to some other financial instruments, cost efficiency, and diversification. By investing in a single product, investors can gain exposure to an entire market, reducing the need for extensive research or active management.
Is an ETF an index fund? Not necessarily. An ETF can be an index fund if it tracks an index, but ETFs can also track different sectors, assets, or geographies without being one.
Differences Between ETFs and Index Funds
ETFs and index funds share a common purpose: to track the performance of an underlying benchmark. However, the debate of ETFs vs mutual funds vs index funds often comes down to trading mechanisms and investment strategies, which can influence their suitability for different types of traders and investors.
Trading Mechanism
One of the most noticeable differences between ETFs vs index funds is how they’re traded. ETFs trade on stock exchanges, allowing them to be bought and sold throughout the trading day at market prices. This means their value fluctuates based on demand, similar to individual shares. In contrast, mutual fund indices are priced and traded only once a day, at the net asset value (NAV) calculated after markets close.
Variety
ETFs encompass diverse assets like stocks, bonds, and commodities, covering sectors, regions, or mixed asset classes. Index funds, on the other hand, only track a specific market index, like the S&P 500, FTSE 100, or Nasdaq 100.
Cost Structure
Both ETFs and mutual fund indices are known for low fees, but there are nuances. ETFs typically have slightly lower expense ratios, as they incur fewer administrative costs. However, trading ETFs may involve brokerage fees or bid-ask spreads, which can add up for frequent traders. Mutual fund vehicles often require no trading fees but may impose a minimum investment amount.
Tax Efficiency
ETFs tend to be more tax-efficient than mutual fund indices. This is due to how they handle capital gains. ETFs generally use an “in-kind” redemption process, which minimises taxable events. Mutual fund index funds, on the other hand, may trigger taxable capital gains distributions, even if you haven’t sold your shares.
Liquidity and Accessibility
ETFs can be bought in small quantities, often for the price of a single share, making them more accessible to retail investors. Mutual fund vehicles may require higher minimum investments, which could limit access for some investors. Additionally, ETFs offer instant trade execution, while mutual vehicles require you to wait until the end of the trading day to complete transactions.
ETF CFD Trading
ETF CFD (Contract for Difference) trading is a versatile way to speculate on the price movements of ETFs without actually owning the underlying assets. When trading ETF CFDs, you’re entering into an agreement with a broker to exchange the price difference of an ETF between the time the position is opened and closed. Unlike traditional ETF investing, where you purchase shares on an exchange, CFD trading allows you to take positions on price movements—whether upwards or downwards.
Leverage and Lower Capital Requirements
One major advantage of ETF CFD trading is leverage. With CFDs, you only need to put down a fraction of the trade’s total value as margin, allowing you to control larger positions with less capital. However, leverage amplifies both potential gains and losses, so careful risk management is essential.
Potential Short-Term Opportunities
ETF CFDs add a layer of flexibility for traders exploring the difference between ETFs, mutual funds, and index funds by focusing on short-term speculation rather than long-term holding. Traders can react quickly to news, economic events, or trends without the constraints of traditional ETF investing, such as settlement times or the need to meet minimum investment requirements. Since ETF CFDs can be traded with intraday precision, they allow traders to capitalise on smaller price movements.
A Complement to Long-Term Investing
For those who already invest in traditional ETFs or indices, ETF CFD trading can serve as a complementary strategy. While long-term investments focus on gradual wealth-building, CFDs enable active traders to seize potential short-term opportunities, hedge against risks, or diversify their trading activities.
Flexibility Across Markets
With ETF CFDs, traders gain access to a wide range of markets, from equity indices to commodities and sectors. This diversity allows for tailored trading strategies that align with market conditions or specific interests, such as tech or energy ETFs.
Uses for ETFs and Index Funds
The differences between index funds and ETFs mean they play distinct but complementary roles in financial markets, offering tools for various investment and trading strategies. Whether focusing on long-term goals or seeking potential short-term opportunities, these products provide flexibility and diversification.
Portfolio Diversification
Both are popular for spreading risk across a broad range of assets. For example, instead of buying shares in individual companies, a single investment in an ETF tracking the S&P 500 provides exposure to hundreds of large US firms. This diversification may help reduce the impact of poor performance of any single asset.
Cost-Effective Market Exposure
Both types offer relatively low-cost access to markets. Passive management strategies mean lower fees compared to actively managed products, making them efficient choices for building portfolios or gaining exposure to specific sectors, regions, or asset classes.
Tactical Market Moves
ETFs, with their intraday trading capability, are particularly suited to tactical adjustments. For instance, a trader looking to quickly increase exposure to the tech sector might buy a technology-focused ETF, while potentially reducing risk by selling it as conditions change.
Long-Term Wealth Building
Index funds, particularly in their mutual fund format, are designed for patient investors. By tracking broad indices with minimal turnover, they offer a way to potentially accumulate wealth over time, making them popular instruments for retirement savings or other long-term objectives.
How to Choose Between Index Funds vs ETFs
Choosing between an index fund vs ETF depends on your trading style, investment goals, and how you plan to engage with the markets. While both offer relatively cost-effective access to diverse portfolios, your choice will hinge on a few key factors.
- Trading Flexibility: ETFs are popular among active traders looking for potential intraday opportunities. Their ability to trade throughout the day allows for precision and quick responses to market changes. Index funds, whether ETFs or mutual products, are usually chosen by long-term investors who are less concerned about daily price movements.
- Fees and Costs: While both options are low-cost, ETFs often have slightly lower expense ratios but may incur trading fees or bid-ask spreads. Mutual fund products typically skip trading fees but may have higher management costs or minimum investment requirements.
- Tax Considerations: ETFs often provide better tax efficiency due to their structure, particularly when compared to mutual fund indices. For investors concerned about capital gains distributions, this could be a deciding factor.
- Strategy: If you’re targeting specific themes, sectors, or commodities, ETFs that aren’t tied to an index can provide unique exposure. For broad, passive market tracking, index funds—whether ETFs or mutual funds—offer simplicity and consistency.
The Bottom Line
ETFs and index funds are powerful instruments for traders and investors, each with unique strengths suited to different strategies. Whether you’re focused on long-term growth or short-term price moves, understanding their differences is key. For those looking to trade ETFs with flexibility, ETF CFDs offer a dynamic option. Open an FXOpen account today to access a range of ETF CFDs and start exploring potential trading opportunities with competitive costs and four advanced trading platforms.
FAQ
What Is an Index Fund?
An index fund is an investment vehicle designed to replicate the performance of a specific market index, such as the S&P 500 or FTSE 100. It achieves this by holding the same securities as the index in similar proportions. These vehicles can be either mutual funds or ETFs, offering investors broad market exposure and low costs through passive management.
What Is the Difference Between an ETF and an Index Fund?
An ETF trades like a stock on an exchange throughout the day, with prices fluctuating based on market demand. They track various assets across different sectors, markets, and asset classes. Index funds track indices, like the S&P 500 or FTSE 100, and can be traded as an ETF or mutual fund.
What Is Better, an S&P 500 ETF or Mutual Fund?
The choice depends on your needs. ETFs offer intraday trading, lower fees, and no minimum investment, making them popular among those who look for flexibility. Mutual funds often waive trading costs and are chosen by long-term investors comfortable with end-of-day pricing.
Are ETFs as Safe as Index Funds?
ETFs and index funds carry similar risks since both track market performance. So-called safety depends on the underlying assets, overall conditions, and your investment strategy, not the type itself.
What Is the Difference Between a Mutual Fund and an Index Fund?
A mutual fund is a broad investment vehicle managed actively or passively, while an index fund is a type of mutual fund or ETF specifically designed to replicate an index.
What Are Index Funds vs Equity Funds?
Index funds are designed to track the performance of an index. Equity funds, on the other hand, focus on stocks and can be actively or passively managed. While all index funds are equity funds, not all equity funds track indices.
This article represents the opinion of the Companies operating under the FXOpen brand only. It is not to be construed as an offer, solicitation, or recommendation with respect to products and services provided by the Companies operating under the FXOpen brand, nor is it to be considered financial advice.
