Weekly $SPY / $SPX Scenarios for July 14–18, 2025🔮 Weekly AMEX:SPY / SP:SPX Scenarios for July 14–18, 2025 🔮
🌍 Market-Moving News 🌍
⚖️ Powell Faces ‘Epic’ Trade‑Inflation Dilemma
Former Fed economists warn Chair Powell is navigating nearly unprecedented terrain: tariffs are pushing up prices even as the labor market cools. Striking a balance between inflation control and growth support remains a formidable challenge
📊 Tariff‑Driven Inflation May Peak This Week
June’s CPI is expected to show a 0.3% month-on-month increase, potentially lifting core inflation to ~2.7%—its highest level in 18 months. These data will heavily influence the Fed’s decision-making process
🏦 Big Bank Earnings Kick Off
Earnings season begins with JPMorgan ( NYSE:JPM ), Goldman Sachs ( NYSE:GS ), Wells Fargo ( NYSE:WFC ), and Citigroup ($C) reporting. Strong results could offset trade and inflation anxieties; expect volatility in financials
📈 Goldman Sees Broader S&P Rally
Goldman Sachs projects the S&P 500 to climb roughly 11% to 6,900 by mid‑2026, underpinned by firm earnings and expected Fed rate cuts. But warns that breadth remains narrow, increasing downside risk without robust participation
⚠️ Summer Volatility Risk Lingers
Deutsche Bank warns that summer’s low liquidity and the looming Aug 1 tariff re‑imposition deadline may spark sudden market turbulence—even amid bullish sentiment
📊 Key Data Releases & Events 📊
📅 Monday, July 14
Quiet start—markets digest back-to-back CPI, tariffs, and clearing post‑earnings.
📅 Tuesday, July 15
8:30 AM ET – Consumer Price Index (June)
Watch for potential tariff impact in CPI; core inflation data are crucial.
8:30 AM ET – Core CPI (June)
10:00 AM ET – Empire State Manufacturing Survey (July)
Early view on Northeast factory trends.
📅 Wednesday, July 16
8:30 AM ET – Producer Price Index (June)
Wholesale inflation signals to validate CPI trends.
10:00 AM ET – Housing Starts & Building Permits (June)
📅 Thursday, July 17
8:30 AM ET – Initial & Continuing Jobless Claims
A gauge on labor-market resilience amid talks of cooling.
📅 Friday, July 18
10:00 AM ET – Federal Reserve Beige Book Release
Fed’s regional economic snapshot ahead of next FOMC.
⚠️ Disclaimer:
This is for educational/informational use only—not financial advice. Consult a licensed professional before investing.
📌 #trading #stockmarket #economy #tariffs #inflation #earnings #Fed #CPI #technicalanalysis
S27 trade ideas

SpyBig week here. Rarely do you get big banks and big tech earnings on the same week..
Jpm, Goldman sach, and JNJ are dow jones heavy weights.
This is important because I think Dow will close that gap at 44,850 and most likely retest ATH at around 45,000.
As long as dow closes above 44,200 Monday, they will do this move
Now logically you have to ask yourself, If Dow jones moves 800pts or 2% what will spy do?
Well unless Nasdaq gives it all up early in the week then Spy will grind higher..
NASDAQ:QQQ
2hour chart is mimicking
June's price action
Even similar bearish Divergence on RSI
So will tech Roll over this week?
TSM and NFLX both reporting..
Qqq 30min price action, as long as price holds above 548.50 I wouldn't short this at all
As you can see with the yellow channel price will be range trading between 551-555. Over 558 and 560 comes.. below 548 and 544 comes.
This is actionable trading, I know some of you want a bigger picture on the short side but until we break below the 20sma I really don't like going full bear at the beginning of earning season...
Yes, alot of things are flashing red signaling a major correction is looming , for Example here's XLC. This is the sector of NASDAQ:NFLX and NASDAQ:META
Here's the weekly chart and RSI
Very bearish bigger picture here, I could easily see this sector and the big names inside it going back to April lows
But then You have AMEX:XLY
The sector of NASDAQ:AMZN and NASDAQ:TSLA
Nothing is bearish Herr and as long as it holds 217 they are going to push this back to ATH.
NASDAQ:AMZN chart is completely identical
So let's say NFLX and Meta have down days similar to last Friday but Amzn and Tsla pumps then you will get a small pullback unless the chipsector dumps also 😉. Remember there's always a bull in the market, they'll just rotate into something less overbought..
Only time you really see majority selling off is when there is a catalyst (Carry trade, tariffs) or Seasonality (March, Sept)..
So I'm bearish on Chips NASDAQ:SMH and I'm bearish on AMEX:XLC but you have to be selective..
I wouldn't short
NASDAQ:TSLA
NASDAQ:AMZN
NASDAQ:GOOGL
NASDAQ:AAPL
Those stocks will likely outperform this Quarter.
As far as the banks earnings , even if they pop, I think this will be a sell the news event and this sector AMEX:XLF (Big banks) is headed for a massive correction
The Small banks AMEX:KRE
Have almost completed their V shape recovery and will most likely correct after this week
Daily technicals are overbought similar to IWM but the weekly is where you see caution
Top of weekly Bollingerband always leads to a major sell the following week
AMEX:SPY
15min chart
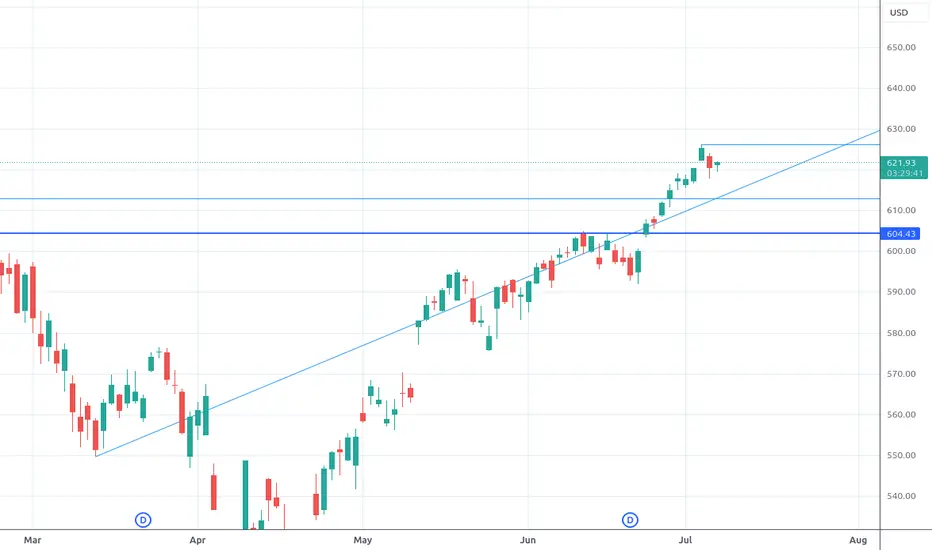
I'm bullish early in the week, I think they will buy the dip ahead of earnings so if they open up near Friday's low or the 15min 200sma they could buy it there, below 621 and they will go for the gap close at 620; that will be another dip buy opportunity . Stop loss 619.00
Below 619.00 and they have a gap left open at 614.84 to close. Stop loss 15min 200ma
Trade Idea of the week is NASDAQ:GOOGL
Bullish ascending triangle forming under 182.00 resistance.. Price may breakout this week
4hour chart Friday finished with a Shooting star so we could start the week with a pullback but I think googl will hold 177.00 support and that's a good entry for a long.. or wait for conformation which would be a break above 182.00..
So 177 or 182 is my entry
Googl is only bearish below 172.00 or 200ma
Personal opinion This administration Has promised 200 trade deals and have gotten only 3 so far. As we get closer and closer to August investors will get nervous and I think we will see another major sell! He's has kicked the tariff can down the road as far as it can go and still these countries are calling his bluff. Becareful because I think the next time trump won't fold
SPY: Short Signal Explained
SPY
- Classic bearish formation
- Our team expects pullback
SUGGESTED TRADE:
Swing Trade
Short SPY
Entry - 623.61
Sl - 633.09
Tp - 606.99
Our Risk - 1%
Start protection of your profits from lower levels
Disclosure: I am part of Trade Nation's Influencer program and receive a monthly fee for using their TradingView charts in my analysis.
❤️ Please, support our work with like & comment! ❤️

Select Your Trading Time
There’s an old saying:
“Plan your trade, and trade your plan.”
But I want to add something even more important:
“Pick your time to trade.”
---
💰 The Market Is Not Your ATM
Everyone enters trading with one goal: make money.
Some even think of the market as an ATM — pull the handle, cash comes out.
But the truth is:
❌ The market doesn’t care about your goals
❌ It won’t move just because you need to make money today
This is a brutal game. And you don’t control the clock.
---
⚠️ When You Force a Trade...
Too many traders say:
“I have to make money today.”
“I need to hit $X this week.”
“I just took a loss, I must come back now.”
That kind of thinking leads to:
Bad entries
Overtrading
Emotional decisions
Big losses
❗ Trading success doesn’t come from forcing outcomes — it comes from waiting for the right moments.
---
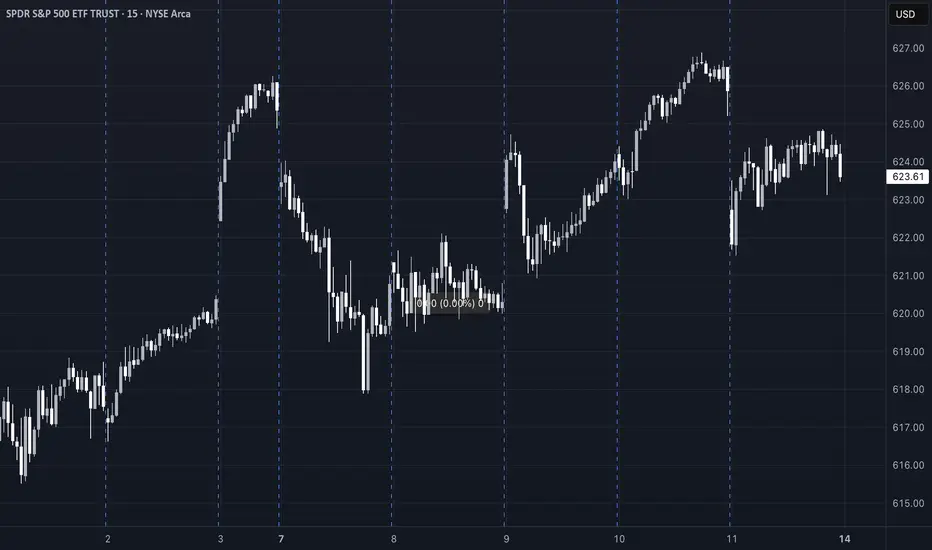
🧠 What Happens on Low-Volatility Days
Let’s take today as an example.
SPY moved in a 2-point range all day.
No momentum, no trend, just chop.
Some traders:
Ran one QS signal after another
Forced trades just to feel busy
Got chopped up by fast reversals
Then blamed the signals
But here’s the truth:
AI or not , you can’t expect any long-volatility trade to work when the market is dead still.
The only winners on days like today? Market makers and options sellers.
---
❓ Why Trade at All on a Day Like This?
If the market isn’t offering opportunity,
Why force it? Why chase trades? Why burn your energy?
The smarter move is:
Sit out
Observe
Wait for better setups
Preserve your mental and financial capital
---
🔄 Recovery? Yes — But on Your Terms
Some traders lose money and say:
“I need to make it back today.”
That’s emotional revenge trading.
What if the market doesn’t give you a clean opportunity today?
Are you still going to go all-in, out of frustration?
❌ That’s not a strategy. That’s gambling.
---
📍 QS Signals Are a Map — Not a Magic Button
QS AI signals help you find opportunities — but even the best map won’t help if:
You're in the wrong city (bad market environment)
You’re rushing without checking road conditions (volatility, news, timing)
Even with QS, you don’t have to trade every day, every hour.
---
✅ What You Should Do
Be patient
Respect market conditions
Take a break on slow or tricky days
Come back when the odds are in your favor
---
🧘♂️ Final Words
You don’t have to win every day.
You don’t have to trade every day.
You don’t even have to be active to be successful.
🎯 Trade less. Trade smarter. Select your time wisely.
That’s how real traders survive and thrive in this game.
Friday afternoon UpdateSPX looks like it's consolidating only. Gold has broken above resistance. OIL and Nat Gas looks like they want to go higher. BTC should go higher, but not too much more.

$SPY Today’s Trading Range and everything in it /// 7.11.25Beautiful start here right at the bottom of the expected move for the day.
Today’s Trading range and everything in it. How are you playing it?

Nightly $SPY / $SPX Scenarios for July 11, 2025🔮 Nightly AMEX:SPY / SP:SPX Scenarios for July 11, 2025 🔮
🌍 Market-Moving News 🌍
🏦 Strong Bank Earnings Amid Tariff Churn
Next week’s Q2 forecasts point to robust earnings from U.S. banks—JPMorgan, Citi, Bank of America, Goldman Sachs, Morgan Stanley, and Wells Fargo—as trading and investment-banking revenue recover, offsetting uncertainties from ongoing tariffs
💬 Dimon Flags Fed Risk Pricing
JPMorgan’s Jamie Dimon cautioned that markets may be underestimating upside in interest rates. He sees a 40–50% probability of higher U.S. rates, driven by inflation from tariffs, migration, and fiscal deficits
⚖️ Tariff “Scattergun” Sparks Sector Disconnect
Trump’s plans to levy up to 200% tariffs on pharma and 50% on copper triggered uneven market reactions—copper prices rose 30% in six months, while European drugmakers remain flat, highlighting divergent sector sensitivities
📉 Tech & Macro Still Bullish
Despite policy turbulence, Nvidia climbed back above a $4 trillion valuation, and JPMorgan projects a $500 billion inflow into equities in H2—supporting gains even as broader macro pressures linger
📊 Key Data & Events
📅 Friday, July 11:
(No major U.S. economic data scheduled)
Markets will focus on bank earnings previews, tariff headlines, and the hold of the tech rally into a thin summer trading week.
⚠️ Disclaimer:
This information is for educational and informational purposes only and should not be construed as financial advice. Always consult a licensed financial advisor before making investment decisions.
📌 #trading #stockmarket #economy #tariffs #banks #tech #Fed #investing

SPY Bullish Patterns C&H Pattern W/ Right Angle Wedge. Wait for confirmation and retest to have a high probability of success.
$SPY Tomorrow’s Trading Range and everything in it /// 7.8.25Today’s Trading range and everything in it. How are you playing it?


SPY Approaches Gamma Wall-TA for July 10SPY Approaches Gamma Wall: Key Zones to Watch for Tomorrow’s Trade 🔥
GEX Options Sentiment Analysis:
SPY is currently hovering just below the major GEX resistance zone around 624–626, where the highest positive GEX and gamma wall overlap with strong call walls (52.17% and 41.33%). This region has historically capped upside momentum, so traders should prepare for potential rejection or breakout scenarios.
Downside has modest protection around 620 (HVL level), with negative GEX zones building near 619–617, marking a weak PUT wall. The lack of deep PUT dominance signals limited downside hedging pressure.
* IVR: 8.9 (low), IVx avg: 13.8
* Options Flow Sentiment: 24.1% PUTs
* GEX Bias: Mildly bullish unless 623 fails
Options Strategy Suggestions:
* If price breaks and holds above 626.5, consider buying CALL spreads (e.g., 626c/630c) targeting a gamma squeeze into 628+.
* If 623 breaks, look for short-dated PUT spreads (e.g., 623p/620p) targeting a fade back into 620 or even 617.
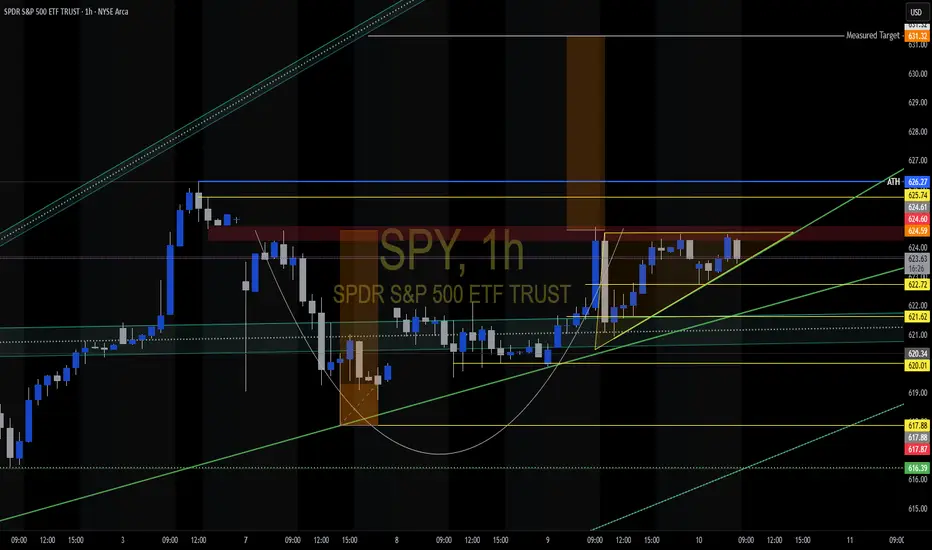
1-Hour Chart Price Action Analysis:
SPY has reclaimed a bullish posture after the CHoCH (Change of Character) on July 8 and is pushing into a supply zone just beneath the prior swing high. The price structure now forms a clean ascending channel, supported by higher lows and rising demand.
* Support Zones: 622.00, 620.34
* Resistance Levels: 624.72, 626.27
* BOS (Break of Structure): Confirmed earlier, adding bullish confluence
Watch for a breakout above the current supply zone to continue momentum toward 628+. However, failure to break and a rejection near 625 could lead to a retest of 620–622 as the next demand zone.
Trading Outlook for Thursday:
* Bullish Case: Break and close above 626 opens the door to a squeeze into 628+. Use pullbacks to 623–624.2 as entry zones.
* Bearish Case: Rejection at current levels with a breakdown below 622.5 could pull SPY into the 620.3 and possibly 617.9 levels.
* Scalp Setup: Long above 625 with tight stop below 623. Short below 622.5 targeting 620, risk above 624.
This analysis is for educational purposes only and does not constitute financial advice. Always manage risk and follow your own plan.

Nightly $SPY / $SPX Scenarios for July 10, 2025🔮 Nightly AMEX:SPY / SP:SPX Scenarios for July 10, 2025 🔮
🌍 Market-Moving News 🌍
🏦 Global Banks Profit from Tariff Volatility
Major banks like JPMorgan, BofA, and Citigroup are expected to see ~10% growth in trading revenue in Q2, fueled by volatility from President Trump’s tariff policy shifts. Treasury trading volumes hit record highs as markets priced in policy swings
📈 S&P 500 Nears Lull Amid Bull Market Strains
Despite record highs in 2025, investors are warning that the rally may be reaching its limit. Bullish sentiment is strong, but analysts caution that sluggish consumer spending, rising inflation from tariffs, and few rate-cut signals from the Fed could cap downside momentum
🐻 Bear Case Gains Ground
Stifel’s Barry Bannister projected a potential ~12% correction in the second half of 2025. Key risks include slowing consumer spending, weak capital investment under tariff uncertainty, and persistent core inflation above 3%, negatively impacting earnings and growth outlooks
⚖️ “One Big Beautiful Bill” Could Add Trillions in Debt
The new fiscal package signed July 4 will add $3–4 trillion to national debt over the next decade while extending tax cuts and revising EV incentives. Bond market and Fed policy implications may become more pronounced if growth fails to keep pace
📊 Stocks vs Bonds: Diverging Signals
While equities climb and megacaps extend gains, Treasury yields have risen five days straight—signaling growing caution over real growth prospects. The yield curve steepening hints at mixed signals: growth optimism in stocks, but bond market signaling economic risk ahead
📊 Key Data & Events
📅 Thursday, July 10:
No major scheduled economic releases. Markets remain driven by tariff headlines, bank earnings reactions, and evolving Fed signals.
⚠️ Disclaimer:
This is for informational and educational purposes only—not financial advice. Consult a licensed advisor before making investment decisions.
📌 #trading #marketvolatility #tariffs #banks #Fed #debt #technicalanalysis

Multi Market Update 7-9-2025SPY likely put in a C wave this morning, I expect a further move down for the rest of the week. Gold starting to look bullish again. Natural Gas likely keeps dropping towards 2.5. BTC at the top of it's range. USOIL is at resistance. The stock I'm trading - aapl - is showing a bear flag on small time frames

SPY at a Key Inflection Point GEX and Price Action Setting Up the Next Move 🎯
🧠 GEX-Based Options Analysis (For Option Traders)
SPY's current positioning in the options market reveals a heavy concentration of gamma and hedging pressure near 620. This level is acting as the Gamma Wall (Highest positive NETGEX / Call Resistance), which typically limits upside unless dealers are forced to unwind hedges.
* Call Walls sit densely at 622 and 624, with diminishing strength up to 626.25.
* Put Walls are stacked below at 618, 616, and most aggressively near 615.
* Notably, today's HVL expires at 620, adding pressure to keep price pinned around that level into the close.
* GEX readings are turning neutral to slightly bearish, with PUT flow dominating at 38.6% vs CALLS at 12.6%.
* IVR is still low at 11.3, which means option premiums are cheap — favoring debit strategies or directional plays if a breakout occurs.
Option Trade Ideas:
🟩 Bullish Setup (Break above 621.5)
Buy 622C or 624C (weekly or next Friday expiration).
Target: 626–628 (into light gamma zone), Stop below 620.
🟥 Bearish Setup (Break below 617.5)
Buy 618P or 615P, targeting 613–610.
Stop above 620. Time the move for IV expansion and gamma acceleration.
📈 Technical Analysis – 1-Hour Chart (For Intraday & Swing Traders)
The chart shows SPY compressing into a wedge pattern just above ascending trendline support from July 2nd. The price action is stuck between declining supply from the 626–628 rejection zone and strong demand at 617.88–615.
* Structure: Price has formed a CHoCH (Change of Character) at the top, followed by BOS confirming bearish pressure. However, price has been resilient above 617, building potential for a spring trap.
* Support: 617.88 → key zone. If lost, next support is near 613–610.
* Resistance: 622–624 remains the magnet for a breakout attempt if bulls take over.
* Volume: Declining, indicating a volatility expansion is likely soon.
Scenarios to Watch:
🔼 Bullish Breakout:
If price reclaims 621.50 and breaks above the recent wedge resistance, look for a squeeze toward 624 then 626. Use tight stops and look for volume confirmation.
🔽 Bearish Breakdown:
A clean break below 617.88 could unleash sellers toward 613. This aligns with GEX pressure and heavy PUT walls.
🧭 Final Thoughts
SPY is sitting on top of a coiled spring — both gamma and price structure are ready for release. This is not the time to guess; let price break from the wedge and follow the momentum. With IV still low and GEX polarity neutralizing, this is a perfect setup for directional options plays only after confirmation.
This analysis is for educational purposes only and does not constitute financial advice. Always do your own research and manage risk responsibly.

Nightly $SPY / $SPX Scenarios for July 9, 2025🔮 Nightly AMEX:SPY / SP:SPX Scenarios for July 9, 2025 🔮
🌍 Market-Moving News 🌍
📦 Tariff Pause Extended to August 1
President Trump delayed the July 9 tariff deadline, pushing negotiations into early August. Markets reacted with muted volatility, suggesting growing comfort that deals will be struck—yet widespread uncertainty remains
💵 Junk Bonds Rally Amid Tariff Tangling
Despite ongoing tariff risks, investors are doubling down on U.S. high-yield (junk) bonds. They anticipate the Fed may refrain from tightening further—favoring spread-tightening to around 7–8% yields—reflecting confidence in credit quality
🏦 Fed Faces Tough Call on Rate Path
New business surveys show conflicting signals: mixed revenue outlooks, cautious spending, and ongoing tariff pressures. The Fed must weigh slower growth against inflationary risks—keeping the door open to rate cuts in the autumn but unlikely before September
📊 Equities Firm Amid Tariff Uncertainty
Stocks showed resilience—S&P 500 and futures held position—after Monday’s tariff-triggered dip. Dip-buying and expectations of extended trade talks kept markets steady despite policy noise
📊 Key Data Releases & Events 📊
📅 Wednesday, July 9:
All Day – Ongoing U.S.–tariff negotiations; markets focused on any progress toward formal deal-making or extension terms.
Midday – Watch for headlines on tariff letters to 14 countries and any movement in trade discussions.
⚠️ Disclaimer:
This information is for educational and informational purposes only and should not be construed as financial advice. Always consult a licensed financial advisor before making investment decisions.
📌 #trading #stockmarket #economy #tariffs #Fed #fixedincome #credit #technicalanalysis

$SPY The BEAR flags are BACK!! AMEX:SPY Looking at bear flags on multiple time frames with an eye on a couple of potential support areas.

~ July 8th 2025 - New highs beget new highs on S&P 500 SPY ... All time highs beget new all time highs on Wed July 2nd ... S&P 500 SPY ETF hit all time high of 626.28 ... watching that level this week ... anticipating bounce as market tests support ....
SPY should continue downSPY bounces will likely be sold but it needs to break 618 for any real down move. Gold, stuck between support and resistance. USOIL at resistance. NG, difficult to say what is happening. BTC may pop the highs but it would likely be a false break.

SPY July 8th 2025SPY July 8th 2025
Day 2 of journaling my trades. Ended Monday green but not without mistakes. I am heading into Tuesday with more of a neutral outlook. Previous resistance will be tested as support and could find buyers or fail to do so. As I did yesterday, I will give a breakdown of what I’m seeing on all of my charts for both strategies.
+++++++++++++++++++++++++++
Bullish Analysis
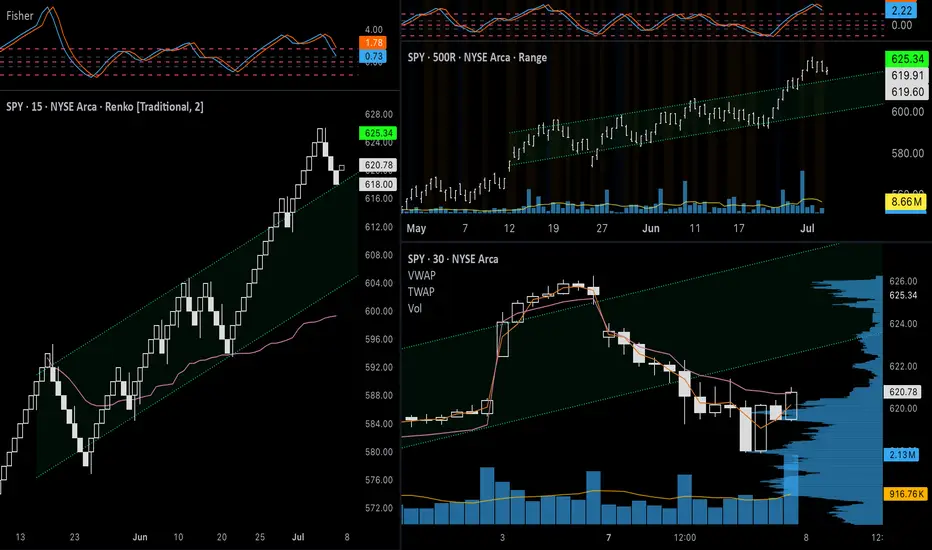
Renko: The price pulled back on Monday, as expected, and may continue lower to retest the top of the channel (around $615). Fisher Transform is still in positive territory and strong support at that level could lead to the price reaching higher highs.
500R ($5) chart: Similar structure to the Renko chart. I’m using a higher range here to compensate for volatility. Just like with the Renko chart, a bounce on the top of the channel would be a healthy pullback before higher highs. There is a high volume node on the volume profile, so interest from buyers here could be strong enough to prevent the price from falling back into the channel.
4h chart: The last three candles have the appearance of a healthy pullback. There was declining volume and
the most recent candle is somewhat of a bullish hammer. I also have an anchored VWAP going back to June 30 that the price seems to be respecting. The price bounced off of it in the first 4h candle on Monday and managed to close above it after a dip during the formation of the second candle.
+++++++++++++++++++++++++++
Bearish Analysis
Renko: Same chart with a lower box size ($1 instead of $2). As you can see, there is bearish divergence on Fisher Transform. The price also found likely temporary support before reaching the top of the channel, suggesting that it could make at least one more wave down if a larger corrective trend unfolds. The 1.382 ($614) and 1.618 ($612) Fibonacci extensions will be important reference points to watch. I would feel less confident about the strength of the bullish trend if the price goes beyond the 1.618 extension.
200R ($2) Range: The Range chart in this layout is the only one that I am including extended hours data on, so the channels have slightly different levels. On this chart I am using two trend lines on the upper level to illustrate the possible areas of support/previous resistance. If the price breaks back into the channel and below the 34VWMA, it could signal a trend failure and the price could return to $600 or lower. Volume bars on range charts also offer a different perspective than on time-based candlesticks. Here, since each bar represents a $2 move up or down, the volume inside of each bar can show the level of effort it took to move the price either direction, whereas the time-based charts are simply showing the level of interest during a particular time period. For this reason, consistently high volume during this last move up could be a sign that there is a larger presence of sellers. Lastly, there is Fisher Transform divergence here as well.
1h chart: CME_MINI:ES1! is green overnight, signaling continuation of the bounce we saw at the end of the day on Monday. With a tighter channel, the top was rejected in a classic bearish reversal candle pattern above the channel and made a clean break down below the channel. The price found support just above the anchored VWAP from the start of the channel, so there could still be institutional interest around $617 and below. If this correction were to unfold into three distinct waves, a 0.618 pullback (to the 0.382 level of the fib extension; $623) would retest the previous demand of the channel. A rejection here could have the price looking for support in a lower volume zone. A (c) wave could take the price down to $615-$611.
+++++++++++++++++++++++++++
Options Analysis
As I have explained, I think it is possible that we will see the price hit $623 during the Tuesday session, so it could be an important level for ATM options. TVC:VIX held its level on Monday after the gap up but failed to make progress - finding resistance at the 200MA on the 1h chart. The rounding bottom and bullish candles on the 30m AMEX:SPY chart looks better than other timeframes. From a Wyckoff Method perspective, however, it looks like puts are in a distribution pattern and calls are in accumulation. Volume is low for both of these contracts, but especially lower on the Put option, indicating lack of interest.
If the put contract makes a lower low on Tuesday (below $3.55 or above $620.75 for SPY), this particular contract could break into a downtrend. Calls seem to be the safer bet since the price has already made a higher high and has wider support. An ideal entry would be a false breakout at $0.95 ($621.00 for SPY) or a retest of the top of the channel after a true upside breakout at $1.50 ($622.50 for SPY) The upside breakout possibility would have stronger confirmation, so it would be worth the higher premium price. This movement would need to be accompanied by high volume, of course.
For puts, I would like to see higher volume at the bottom of the range, since it seems like the underlying price will open higher. I would probably switch to a contract with a lower strike since $623 would be ITM but for the sake of this idea, I would target entry of $623p around $3.65 ($620.75 for SPY).
+++++++++++++++++++++++++++
Targets
Calls: Enter $622.50, Target $628-$630, Stop Loss $621
Puts: Enter: $620.75, Target $615, Stop Loss $621.50
To summarize, I like the risk/reward and volume better for calls, and it fits my original thesis, however if volume increases on puts at these elevated levels, it will be important to get in at a price that minimizes risk exposure to take advantage of a deeper correction.
SPY July 7th 2025SPY July 7th 2025
Day 1 of journaling my day trades on SPY. I am going to start journaling my ideas every night if possible in order to fine tune my setup and to analyze my wins and losses. I will be using Renko (Traditional, 2 box size, 1m) as my main chart, Range Bars (50R, 100R, 200R, or 500R), and candle sticks (various timeframes) to identify supply/demand, price ranges, and trends - placing a high emphasis on volume as it applies to the Wyckoff Method. I will also occasionally refer to real time options charts and VIX, however I will primarily use those for my entries during the day.
Each day I will provide setups for a bullish and bearish bias, which should help minimize instances where the price moves against me - with slow reactions leading to holding losing trades and hesitating to enter a trade on the side of the new trend. I’ll try to come up with a consistent format as time goes on. For today, I will go down the list of my indicators and provide notes that fit the bias of each trading strategy.
+++++++++++++++++++++++++++
Bullish Analysis
Renko: Strong breakout from ascending channel on June 30. Fisher Transform is signaling continuation. A retest of the top of the channel would take the price back to ~$618.
100R ($1) Chart: Price is in an uptrend being supported by high volume. 34VWMA (purple) is above 200MA (green). The bounce on July 2nd (around $616) was supported by a high volume node, indicating genuine interest pushing the price higher.
30m Chart: Price closed on July 3rd at the top of an ascending channel inside of a larger ascending channel. Since the larger ascending channel is one of strength, it can be assumed that the smaller one is a sign of strength as well. A break too far below the lower end of this smaller channel would be a sign of weakness, which does not seem to fit the current market structure after last week’s breakouts, but it is still possible that the trend fails. Fisher transform is forming a “hook” pattern that can signal continuation.
+++++++++++++++++++++++++++
Bearish Analysis
On a smaller scale, the price appears due for a pullback, which can fit both the bullish and bearish trading ideas depending on where the market opens.
Renko: The price closed at the top of an ascending channel on July 2nd and will find more buyers upon a test of the lower band and the anchored VWAP.
50R (50¢) Chart: If the price pulls back to the bottom of the channel (around $620) this would coincide with a retracement of 0.618 - which is a key fib level. A break below the 1.00 extension ($616) could signal a break of the uptrend - a $9+ drop if an entry can be found near the top of the channel, not too bad.
5m Chart: The price left a gap down to $620 on July 3rd. Filling this gap could provide important liquidity to propel the price higher. Additionally, The high volume at the start and end of Thursday’s flat trading day (with low volume in between) could be a sign of accumulation or lack of sellers.
1DTE ATM Put, 2m: If a more prolonged (and profitable) downward move is expected from smart money, we should see volume increase for ATM puts during the session. Depending on where things open, we could see a potential spring/false bearish breakout (below $2.20), or a true bullish breakout (above $2.80). Using an options calculator, $623.75 on AMEX:SPY would set up the Spring and a drop below $622.50 could confirm the put breakout.
+++++++++++++++++++++++++++
Targets
Calls: Enter $618-$620, Target $625-$628, Stop Loss $617.75
Puts: Enter $623-$625, Target $620, Stop Loss $626.25
To conclude, overnight action on CME_MINI:ES1! and the gap up on TVC:VIX shows that the price is already retracing. The top of the wedge for VIX would be just above $20 - a key level to watch for a reversal. Unless the upper part of the channel on SPY is tested and rejected again after the open, I will sit out and wait to hit the bullish targets. We are still in a strong uptrend after last week’s breakouts, so going short is the riskier bet anyway, as buyers could step in at any time.
Looking at ATM calls and puts side by side (bottom two charts), it is clear that calls were not heading into today with a good setup. It would be worth taking a chance on puts if a Spring forms (below $2.20), which, again, would correlate with AMEX:SPY hitting $623.75 during the session - and not much higher.
My main idea for the start of this week is to look for a good pullback for calls, so I will be patient and will try not to force anything. If smart money has a bullish sentiment, there will still need to be a short accumulation phase for calls so I will watch to see what the chart is doing for ATM calls around $620.

$SPY $SPX to 5650 Realistic pull back target AMEX:SPY SP:SPX Realistic pull back target. It’s been a while since I gave a good 5 year volatility based pullback target. 😏
Let’s take a look back in August. 5655 for SPX, 563 SPY

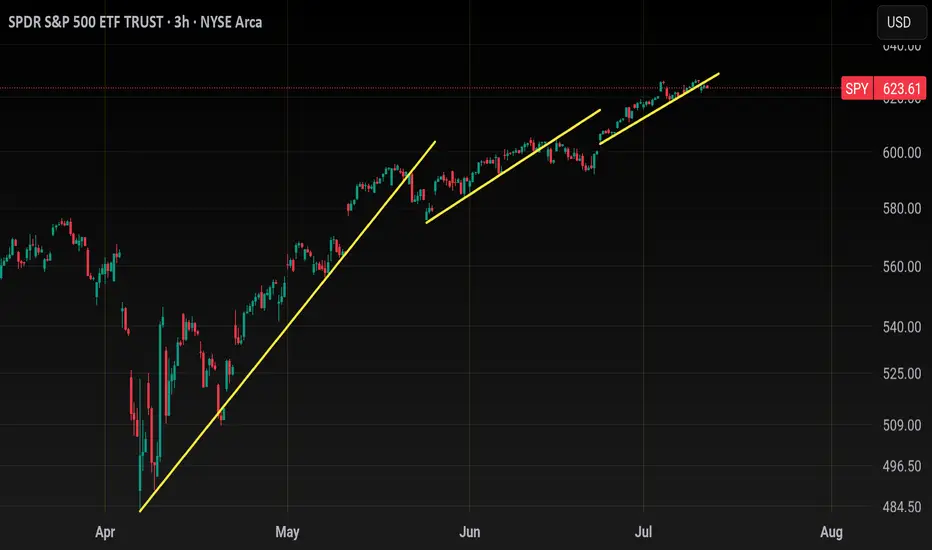
SPY: How are ya?Long time no talk.
Just an update to appease some people requesting updates haha.
Mostly going over the larger term outlook for SPY, the quarterly and some discussions on the weekly.
As always, not advice and remember to follow your strategies and risk management approaches!
Safe trades everyone!

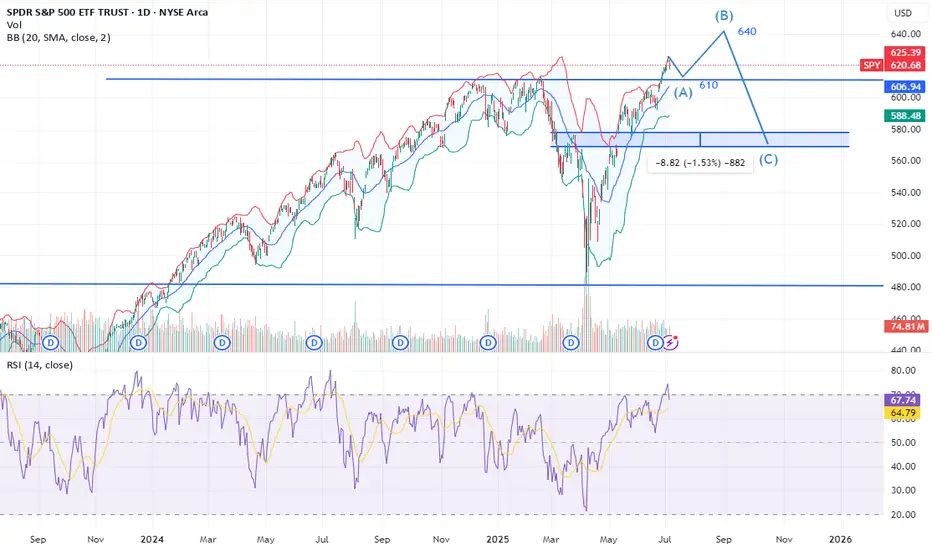
clear path to 640 then 570 spyTariffs news are temporary but pump of any good news can lead us to 640 but remember we have to fill the gap 570.