SHIB 123Shiba Inu is setting up for a nice mid term swing trade, while the king coin BTC pokes at making a trend reversal to the upside most of the top ALTS lag just a bit behind and should ride up once bitcoin makes its major moves stair stepping up and out going into phase 2 of this current bull cycle. Cypher pattern D phase 100% in play "the money shot"
SHIBETH_288285.USD trade ideas

DRAGONFLY BULLISH DOJIThis is all the confirmation we need: Dragonfly Bullish Doji. If a hammer candlestick is very powerful, dragonfly doji is much more powerful than a hammer to even say, SHIBA also has a confirmed BULLISH engulfing.
For those who want a powerful uptrend with massive POWER: dragonfly doji has confirmed price action BULLISH REVERSAL and my blue wave BULL plot with smart money contraction shows the WHALES can push SHIBA upwards at any moment.
This must be accompanied by BITCOIN moving up.

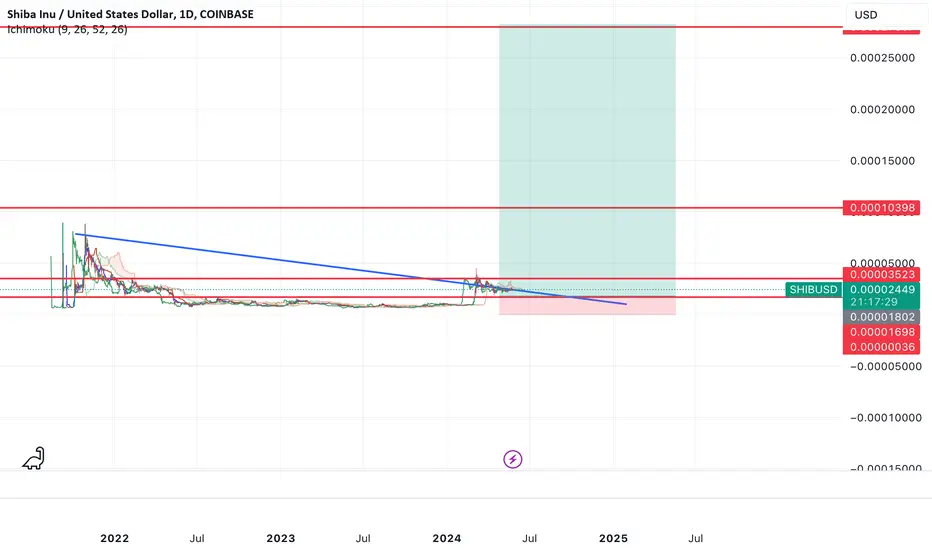
SHIB: Time for this Puppy to Run!SHIB just hit one of my accumulation targets at the .786 fib on the weekly. Needs a break of the trend line to confirm a bullish move.

Shiba Underlying StrenghtA big Hidden Bullish Divergence spotted on the Daily Time frame, signaling a trend continuation.
Divergence on bigger time frame are important and significant, just have to find the Top or Bottom and in this case, I think Shib found the bottom of the divergence(Spot the textbook holding line). It has been a healthy Dip by the way.
On the MACD ..the bars will soon print green and also the blue line is about crossing signaling strength.
With the recent strength shown by BTC . might all Shiba needs to breakout.
A good 1:5 Risk to Reward Ratio..You dont see this everyday..
NB: Not a Financial Advice. DYOR
Happy Trading

Shib Hidden StrenghtOn the Daily Chart, there is a big Hidden Bullish Divergence. Divergence in this higher time frame is important just have to find the bottom or top and it seems Shibs found one..
Might Explode to the upside soon and also Considering BTC little strength lately, might be enough Fuel to make shib Explode.
My first Publish Idea and still getting to know how to use this function. Will get better with it and I hope we can benefit more . Not a Financial Advise

SHIBA INU again getting ready for 300% returnSHIBA INU again getting ready for 300% return, make sure you only enter in these areas for big and longest bull run ever !!! this is going to be the longest bull run ever !!!

NEARLY READY TO BUY IN UPDATE ON PREVIOUS ANALYSISSHIB/USD 3M - This is an update on the analysis I provided previously, as you can see price has continued to trade us in a bearish way as I predicted in previous analysis.
I want to see this momentum to continue trading us lower, giving us the ability to buy into this crypto at a good price so we can profit well from this token. I will keeping an eye on this now over the course of the next few weeks.
In order for me to have the confirmation to go long and buy more of this crypto I want to see price trade into this area of Demand and deliver us with confirmation that price is in-fact ready to trade higher.
This will come from a BOS to the upside after price has traded into the area of Demand, confirming enough Demand has been introduced to flip the current balance.

Shib Goes to 0.000110 USDT TargetShib is going to 0.000110 usdt target. But first we will break the downward channel upwards. After this happens, a brief sideways move may occur. If the decline in price continues, the lower channel support is ideal for new buys. Good days are near, but we must be a little more patient.

$SHIB the memecoin for this cycle?My thesis for this next move higher is that Solana coins are done and Ethereum coins are in.
Because of that, I think SEED_DONKEYDAN_MARKET_CAP:BONK sees one more exit pump and then CRYPTOCAP:SHIB becomes the memecoin for this cycle (Ethereum based).
I think there's a possibility of one more retest of the lower support before the move higher starts, but once it does, I think there's 15x upside potential to the top resistance.
Let's see what happens.
Three Possible Scenarios for #ShibaInu $SHIBI am noticing strength amidst the low volume within the chart leading me to anticipate more eventful development. The arrows depict a very simple trajectory prediction for those interest DYOR Trade at your own risk.
From where we are now just before upcoming news
We can spike upwards which would be highly anticipated.
Continue to accumulate to create a future liquidation point for a spike in the future.
Or go as low as the 0.000014 region or possibly even the 0.000012 regions.


(SHIB) shiba inuIs Shiba Inu going to fall all the way to 0.000014 or is this as low as the price is willing to go and will hold after falling beneath the most recent support line?

History will happen again for sureA clear pattern we can see about this shit coin just like doge in past.

SHIB/USD: Shiba looks bullishHello,
Shiba looks very bullish, if it crosses the current resistance, you can expect 70% returns in a few weeks.
Chart is bullish playing into Chrismas.
Happy holidays

Trading Analysis of Shiba Inu (SHIBA) - 4 Hour timeframeTrading Analysis of Shiba Inu ( COINBASE:SHIBUSD SHIUSD) - 4 Hour timeframe
Overall Trend:
Downtrend: The price being below the 50, 100, and 200-period moving averages since June 7th suggests a strong downtrend.
Short-term movement:
Difficult to assess: A 4-hour timeframe doesn't provide enough information to definitively say if there's a current uptick or just a small consolidation within the downtrend.
Volume:
High Volume: The volume of 140 billion is significantly higher than usual, which could indicate increased selling pressure or potentially a buying opportunity depending on price action.
Momentum Indicators:
RSI (30.00 - 40.00) : This indicates oversold territory. Oversold readings suggest the asset might be undervalued based on recent price movements, but they don't guarantee an immediate rebound.
MACD: The MACD signals being below the histogram since June 7th confirms the downtrend in momentum.
Summary:
The technical analysis of SHIBA on a 4-hour timeframe leans bearish. The downtrend, high volume, oversold RSI, and MACD below the histogram suggest continued selling pressure. However, due to the limited timeframe, it's difficult to say for sure if there's a short-term reversal or just a pause in the downtrend.
Here are some additional things to consider for a more comprehensive analysis:
Longer timeframes: Analyze daily, weekly, and monthly charts to understand the bigger picture.
News and Events: Look for any recent news or events that might be impacting the price of Shiba Inu.
Market sentiment: Consider the overall sentiment in the cryptocurrency market.
Disclaimer: This analysis is for informational purposes only and should not be considered financial advice. Always do your own research before making any investment decisions in cryptocurrency, as the market is highly volatile.
"In this business if you're good, you're right six times out of ten. You're never going to be right nine times out of ten. I've found that when the market's going down and you buy funds wisely, at some point in the future you will be happy. You won't get there by reading: "Now is the time to buy".

SHIB - Shytoshi's Monthly MountainShib's long term outlook levels. Volume Profile. Value area high/low. Full range 618 and more local monthly 618. This is one of those charts you look back on a year later and wonder why you didn't do better....except you are seeing it now. Happy trading.

Shibusd buyIm unfamiliar to this chart and its hard for me to understand it but from price action perspective and the upward trend i believe that continuing the trend is more likely to happen

SHIBA INU PRICE TARGET 0.00003999We need to see the four (VC) Volatility Contractions. Don't confuse VC for smart money contractions.
VC works in an up-and-down pattern. Marubozu white candlestick comes with a spike, downtrends, then spikes. It's a pattern as well.
Our confirmation is the double bottom at a 2% risk-reward ratio. It's been calculated and hidden from the public. I'm now unfolding the mystery that's about to take place.
Our other confirmation is our smart money contraction. The value line reads 0.00003424. All candlestick trends must rise like a magnet to the value line because it's smart money communication. Trends always travel beyond the value lines.
I was able to find the price of 0.00003999 by using POINT and FIGURE chart type.
The small image chart is a 1HR TF vs the 23HR TF idea.

SHIB Looking StrongSHIB appears to have broken out of a bullish wedge pattern. It has broken out, retested the breakout level (marked on chart) and momentum looks bullish.
Let's hope for a repeat of the move that led to this consolidation wedge pattern!

We up. Hey so. I’m dropping another hundred now. It’s just too tasty to let go. This is not financial advice as I invest by market structure and dollar cost averaging. But this is my entry and it’s looking like a good swing high.

WHERE I AM BUYING MORE SHIBA ATSHIB/USD 3M - As you can see from the screenshot above, this is where I will be looking at buying in more Shiba. I believe this crypto offers longevity just like BTC does.
So with that being said, once price trades us down and into this area I will be looking at buying more Shiba round this area, at this point it will be worth round half of what it is currently valued at and we will have hit a new low.
I believe price is within its new wave to trade us higher, I just feel price is correcting itself more fractally, hence this current bearishness we are seeing now.
I feel this bearishness will stop once sellers have sold off, and buyers begin to buy in again at this area of interest. There are sell orders in spot sat round this area of interest which I feel will want to be closed before the hike up.
This also gives us buyers a great price to get in at before it takes its next large hike. With recent milestones being met like ShibaSwap I feel this crypto holds a-lot of wait. This coin is constantly growing with new things being added.

(SHIB) shiba inu "historical volume; above $1B"Placing lines on all the dates with the highest historical volume above $1 billion. The darkest thick line is the date with the highest volume $11 billion March 5th 2024. The top 5 highest dates of volume are in darker red. The rest appear in thin lighter red lines.

SHIBUSD Hidden Bullish Divergence on the 4H ChartHidden bullish divergence exists for SHIBA INU on the 4 hour chart. This is indicated by a higher low on the price chart while the RSI shows a lower low. This setup typically results in an increase in price. Of course, there are no guarantees, but I have observed this to be the case most of the time. If the price does move higher and the RSI crosses above the 50 line, the price could get back to the resistance level a around .00002940.
SHIBA INU is still in a bull flag formation on the weekly chart. A significant break above .00002940 resistance could drive the price to the .00003200 to .00003500 range. It should be fun to watch.
