SHIB Long Entry Heist Plan – Bullish Setup in Trap Zone🦹♂️💸 SHIB INU Market: The Silent Heist Plan Is Live! 🚨💰
Thief Trading Style | Swing & Scalping Blueprint | High-Risk Zone Masterplan
🌍 Hello Global Robbers & Market Raiders! 🤑💥
Welcome to another secret mission straight from the vault of Thief Trading Style. We're eyeing the SHIB INU Crypto Market
Key stats
About Shiba Inu
What would crypto be without canine-based tokens? Probably a lot less chaotic, but that didn’t stop an anonymous dude called ‘Ryoshi’ from creating Shiba Inu in 2020 — which, thanks to the so-called ‘Shib Army’ and Vitalik Buterin famously burning 40% of the supply, saw massive gains during 2021. Unlike fellow crypto-canine DOGE which operates on its own blockchain, Shiba Inu is based on Ethereum to give it increased scalability. To date, some of its use cases include an NFT "artistic Shiba movement" and a campaign via AmazonSmile to collect donations to rescue real Shiba Inu dogs. Pretty cool.
Related pairs

Breach If SHIB closes below 0.00001038 on the weekly, that means the bears breached the value zone and the Bulls could lose a zero and if the bears march on the next stop would be 0.00000830.

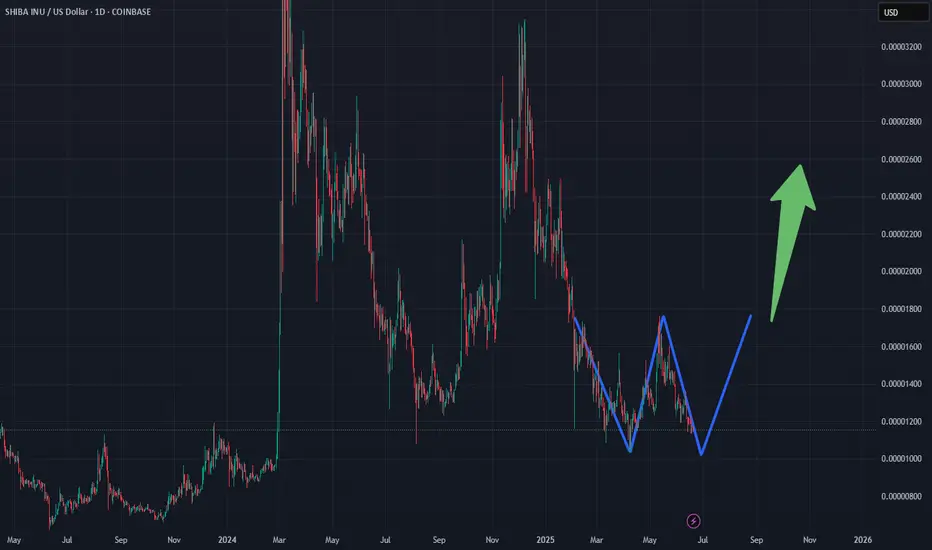
WATCH SHIBThis could be setting up for a
nice rounded double bottom
pattern. Keep watch on SHIB
and I would strongly DCA in at
this key level. We could be
forming a very powerful W pattern
long term...So stay vigilant and
watch for the dips. Even if we went
to all time LOWS you would only be
down 48%..
I am practicing so please dont judge me lolBut I truly believe this will occur, so I hope you have cash waiting on the sidelines because its almost time to jump back in

Stacking Shib and some other crap ERC20 tokens.It is time IMO to start stacking for the alt coin pumps.
here are a couple targets I have to sell 25% of my stack.
This is a risky play and could still take another year to work out????
NOT FINANCIAL ADVICE!!!!

Demand ZoneShib is consolidating in demand zone and near a key level.
Bulls need price to break out of the Demand Zone above 0.00001300 to hopefully 0.00001427.
If the Demand Zone fails bears can push price down to the 0.00001100 levels.
Be careful and have a nice day

SHIB Breaks Out – Time to Ride the Wave! 🔍 Chart Analysis Summary:
🔼 Trade Direction: Long (Buy)
⏱️ Timeframe: 30-Minute
🔔 Breakout Zone: Triangle breakout just confirmed
🟡 Entry Zone: Around 0.000012805 (shown with yellow circle)
🟥 Stop Loss: Below 0.00001214
🟩 Target Zone (TP):
TP1: 0.000013620
TP2: 0.000014205
TP3: 0.000015037
📊 Ris

Shiba INU - Bottom Buy confirmed istorical Pattern Repetition (2024 & 2025):
The chart suggests that SHIB is following a repeated pattern cycle:
Stage 1 – Falling Wedge (Completed)
Stage 2 – Cup and Handle (Completed)
Stage 3 – W Pattern (Recently Completed)
Stage 4 – Inverted Head and Shoulders (Pending Formation)
Key Highlig

"Shiba Inu (SHIBUSD) – 4H Triangle Formation and Price StructureSHIBUSD – 4H Technical Chart Analysis
Price recently broke down from a triangle pattern after consolidating near key resistance. A potential retest of the breakdown zone around 0.00001396 is possible before continuing toward the support level near 0.00001041.
Major levels:
🔹 Resistance: 0.00001396

Shiba break outShiba Inu has been in a sideways trend for a year or so. That is about to end.
Technical analysis shows the linear regression downward trend is coming to an end, and we are in the bottom 25% of the Fibonacci Bollinger bands, indicating trade entry here is low risk. The moving average is heading

See all ideas
Displays a symbol's price movements over previous years to identify recurring trends.
Curated watchlists where SHIBUSD is featured.

Crypto tokens: Chips and dips
24 No. of Symbols

ETH-based crypto: Find your utility
38 No. of Symbols

Memecoins: Top meme tokens
10 No. of Symbols
See all sparks
Frequently Asked Questions
Shiba Inu (SHIB) reached its highest price on Oct 28, 2021 — it amounted to 0.00008585 USD. Find more insights on the SHIB price chart.
See the list of crypto gainers and choose what best fits your strategy.
See the list of crypto gainers and choose what best fits your strategy.
Shiba Inu (SHIB) reached the lowest price of 0.00000480 USD on Sep 7, 2021. View more Shiba Inu dynamics on the price chart.
See the list of crypto losers to find unexpected opportunities.
See the list of crypto losers to find unexpected opportunities.
The safest choice when buying SHIB is to go to a well-known crypto exchange. Some of the popular names are Binance, Coinbase, Kraken. But you'll have to find a reliable broker and create an account first. You can trade SHIB right from TradingView charts — just choose a broker and connect to your account.
You can discuss Shiba Inu (SHIB) with other users in our public chats, Minds or in the comments to Ideas.