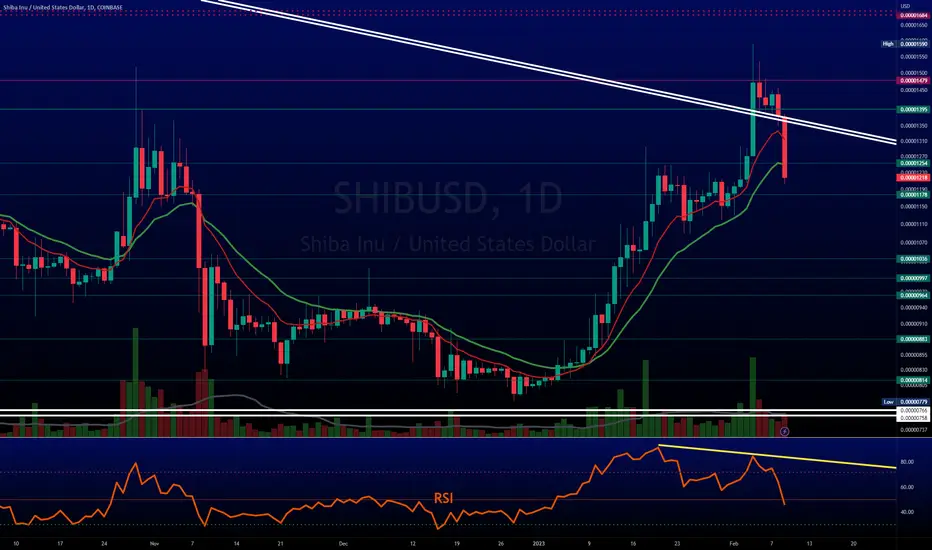
Retracement? Or bearish continuation?We’re in tricky waters right now. We have a long term bullish divergence in price action indicating a relief rally is upon us, at the same time there are substantial bears in the market hanging out around the 0.000015 supply zone that have been down badly on their investment for over a year now still looking for a gracious exit out of the market.
Short term, we have a bearish divergence over the last month.
Medium term, we have a hidden bearish divergence (lower high price, higher high oscillator) that has been developing for several months now.
I think this phase in crypto right now is make or break for another bull run, or maybe Punxsutawney Doge has seen his shadow and we ought to be sheltering in place for an extended winter.
We have a massive bullish divergence on the weekly, Indicating selling pressure may be alleviating. Or the last few months have simply been a redistribution phase leading to one more drop in price.
DXY has been rallying. It is still in a medium term uptrend. DJI and SPY are struggling to move above the 50 week moving average. All I know is, once the tug of war is over, the next move will be BIG. Which direction? I dunno. But I’m trading both sides.
SHIBUSD trade ideas

ShibUsd nothing special to see hereJust a quick chart for personal use
Possible H & S or cup & handle
I bought 50 billion at 800 so just looking to see what could happen

SHIBUSD - Potential Upward MovementSHIBUSD is about to continue its upward trend. Exit at supply zone.

SHIBA: Whale Buy 223 billion SHIB last 24HAccording to a recent report by WhaleStats wallet tracker, a whale ranked 329th on this platform bought slightly over 223 billion Shiba Inu. In the meantime, the lead developer of Shiba Inu has posted a tweet, pushing up the sentiment of the SHIB army regarding Shibarium

Following the rulesWhat do you think this means?
Appendix:
Wave degree:
Primary: Wave 3 (larger degree),
Intermediate: Wave 2,
minor: Wave C,
Structures:
Wave 1 = Impulsive rally,
Wave 2 = Corrective decline,
Wave 3 = Impulsive rally

shiba inu USDHi, , if Shiba inu breaks every trend and gives a full back, you can have a 4.5% fall or a 4.5% rise.
Pay attention only when the trend breaks for 1 hour or 15 minutes, when it breaks with a candle for 1 hour or 15 minutes.
Good luck

Current Interest Rate TrendThe video in question provides a comprehensive analysis of the current direction of interest rates, as well as the projected trajectory for the near future. The video employs expert-level vocabulary and a scholastic approach to the subject matter to provide a nuanced and in-depth examination of this crucial economic indicator.
At the present moment, the direction of interest rates is a matter of considerable interest to economists, investors, and policymakers alike. The video delves into the current state of the economy, including factors such as inflation, growth, and monetary policy, to determine the direction of interest rates.
The video then turns its attention to the projection for the immediate future, using sophisticated models and analysis to forecast the likely trajectory of interest rates over the coming months. The video takes into account a wide range of economic indicators, including inflation expectations, growth projections, and the impact of monetary policy, to provide a comprehensive analysis of the future direction of interest rates.
Finally, the video provides its overall assessment of the direction of interest rates over the longer term. This is done by considering both cyclical and secular factors, such as demographic trends, technological advancements, and geopolitical events, to arrive at a nuanced and well-supported conclusion regarding the likely direction of interest rates in the years to come.
In conclusion, the video provides a thorough and expert-level examination of the direction of interest rates, both in the present moment and in the future. The use of scholastic vocabulary and a rigorous analytical approach ensures that the analysis is both comprehensive and credible, providing valuable insights for all those interested in the direction of interest rates.

$SHIB volume on selling is not bad 2 of few2
Sitting on some cash as we took SOME #crypto longs off as we clearly posted that $BTC was looking weak
Will look for new positions, sticking with what works
$SHIB broke out on daily with GOOD volume
Unless a change not much selling
Things cool off, put money back in this
#Shibarium #Shiba
Shiba Inu - Long term bullish but bears currently have controlShib has had a failed breakout and will likely retrace to the 11-12 region over the coming weeks.

SHIBA: BULLISH FLAG PATTERN - LONGBullish Flag Pattern on Shiba Inu coin for a possible Long continuation.
A bull flag is a bullish chart pattern formed by two rallies separated by a brief consolidating retracement period. The flagpole forms on an almost vertical price spike as sellers get blindsided from the buyers, then a pullback that has parallel upper and lower trendlines, which form the flag.

Shib looking strong, but bitcoin may end the party temporarilyIf bitcoin corrects through price, Shib may fail in this area. Take profits if you are a swing trader.

Shiba Inu - Negative RSI and MACD divergenceShib may fail here, especially if bitcoin starts retracing. Negative divergence is seen on daily. DCA if it pulls back.

Buy at demandIt’s a good buy opportunity that will present itself. I’m going to drop a nice one but that’s just me.

Shiba still looking strong in spite of bitcoin correctionShib still looks good...DCA on the way down IMO if bitcoin price corrects.


Shiba Inu is still looks poised for higher pricesStill very bullish on Shib short and long term. We are getting close to a true breakout.

$SHIB outperforming $DOGE again$SHIB leapfrogging $DOGE again
#SHIB looks good & volume coming in
14 area is next
#Shibarium #ShibaArmy

$SHIBUSD - Long Trade IdeaI am looking for a potential break of the downtrend line.
I am a bit early into this trade without waiting for proper confirmation (shame on me), so I must watch this closely and monitor for the potential downside.
I am looking to see a retest of the previous pivot high, which coincides with Alchemy Level.
Above that, I am predicting a nice squeeze to the first target.


Do you see it. Support the test and bulls will chargeCalled Aptos perfectly before the pump because my wife is my trading advisor. Now she says its shibs turn so buckle up and show your support.
300% to 500% is what my wife is betting on the next few weeks. Lets just see what happens next.
Going LONG with 30k
Using the wife indicator LOL>...

SHIBUSD Potential for Bullish Continuation | 30th January 2023Looking at the H4 chart, my overall bias for SHIBUSD is bullish due to the current price being above the Ichimoku cloud , indicating a bullish market. Looking for a buy stop entry at 0.00001295, where the recent high is, we are looking to take profit at 0.00001518, where the previous swing high is. Stop loss will be placed at 0.00001111, where the previous overlap support is.
Any opinions, news, research, analyses, prices, other information, or links to third-party sites contained on this website are provided on an "as-is" basis, as general market commentary, and do not constitute investment advice. The market commentary has not been prepared in accordance with legal requirements designed to promote the independence of investment research, and it is therefore not subject to any prohibition on dealing ahead of dissemination. Although this commentary is not produced by an independent source, FXCM takes all sufficient steps to eliminate or prevent any conflicts of interest arising out of the production and dissemination of this communication. The employees of FXCM commit to acting in the clients' best interests and represent their views without misleading, deceiving, or otherwise impairing the clients' ability to make informed investment decisions. For more information about the FXCM's internal organizational and administrative arrangements for the prevention of conflicts, please refer to the Firms' Managing Conflicts Policy. Please ensure that you read and understand our Full Disclaimer and Liability provision concerning the foregoing Information, which can be accessed on the website.

SHIBUSD Potential for Bullish Continuation | 30th January 2023Looking at the H4 chart, my overall bias for SHIBUSD is bullish due to the current price being above the Ichimoku cloud, indicating a bullish market. Looking for a buy stop entry at 0.00001295, where the recent high is, we are looking to take profit at 0.00001518, where the previous swing high is. Stop loss will be placed at 0.00001111, where the previous overlap support is.
Any opinions, news, research, analyses, prices, other information, or links to third-party sites contained on this website are provided on an "as-is" basis, as general market commentary, and do not constitute investment advice. The market commentary has not been prepared in accordance with legal requirements designed to promote the independence of investment research, and it is therefore not subject to any prohibition on dealing ahead of dissemination. Although this commentary is not produced by an independent source, FXCM takes all sufficient steps to eliminate or prevent any conflicts of interest arising out of the production and dissemination of this communication. The employees of FXCM commit to acting in the clients' best interests and represent their views without misleading, deceiving, or otherwise impairing the clients' ability to make informed investment decisions. For more information about the FXCM's internal organizational and administrative arrangements for the prevention of conflicts, please refer to the Firms' Managing Conflicts Policy. Please ensure that you read and understand our Full Disclaimer and Liability provision concerning the foregoing Information, which can be accessed on the website.
