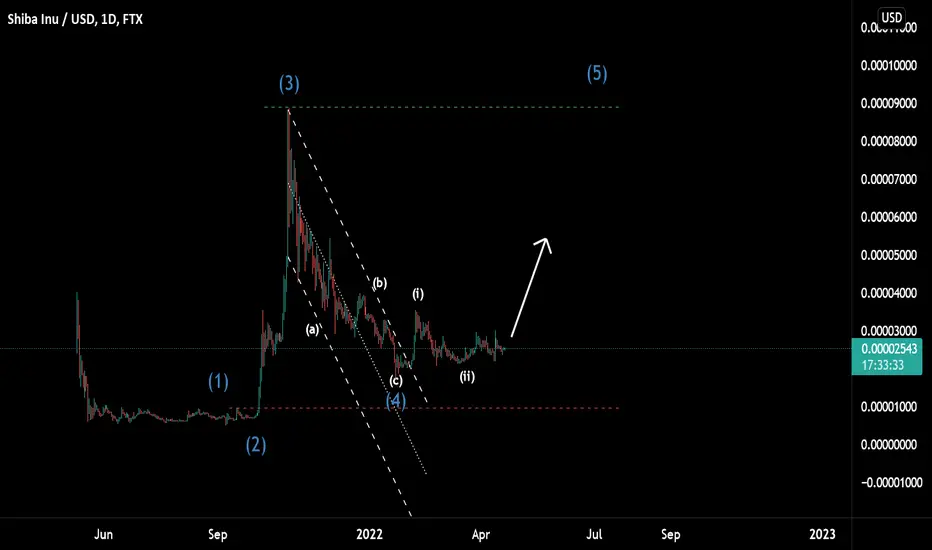
SHIBUSD Break Above DowntrendSHIBUSD has shown a break above the dominating downtrend on the right side chart
On the left SHIBUSD on a different pair is also showing bullish signs, with a descending scallop formation
The big take away is that a big support has been reached with a triple bottom, bullish action will prevail and lead to 200MA continuation
SHIBUSD trade ideas

SHIBA holding support level As you know, making massive gains from investing is easier said than done.
Like so many of our readers, you see the “investment experts” talking about their huge wins and successes…
You see the “legendary” stock picks that got 1000% returns in one day, and “The One Device” that’s going to “change everything.”
So, like some of our readers, you may have paid for those products…
And then you may have received something that doesn’t fulfill the promises they made to you...
Every investor in the world loses money sometimes. No matter how famous. No matter how successful…
And if someone isn’t transparent with you about their losses, they’re basically not helping you learn from their mistakes.
So if an “expert” isn’t willing to show you their losses… and therefore protect you from making the same mistakes they did… how and why are they going to help you?
It’s common sense. We believe you should demand transparency when it comes to something as important as your investments.
We believe in a free exchange of ideas for investing, trading, income, asset ownership, and wealth preservation.
Our publication was created to help the average investor identify the best opportunities for building wealth. We provide information and ideas about investing, asset ownership and wealth preservation so you can make smart decisions with your money.
Everyday, our teams curates the most relevant and timely investing information...

Shiba Land purchase happening Shiba Land purchase happening along with Burnings, Bitcoin moving to the next level $50.000 and ETH following

SHIB 50% Retracement at 53... Really?SHIB has found support along the RED trendline.
Once 29 is captured a massive move should occur to test the 50% retracement at 53.
MACD and Squeeze are ready to cross bullish.
Good Luck

TRYX ANALYSIS | SHIBUSD |SHIBUSD - on Shiba if there will be fundamentally rising prospects, these are the key moments from where I would execute long transactions.

Long Term Bullish Zoom out and take a look at the daily.. how can anyone be bearish on this? Diamond hands holding strong on this one!

SHIBA - TIME FOR SOME TREAT - UPTREND - ELLIOT WAVESHIBA is looking for some treats! Bulls are on it.
Uptrend. Invest wisely.
-Definitely not SEBI - Registered. So, this is only for educational purpose.
Shib/USD ShortInto higher timeframe resistance.
Target is a moving average so will be tracked up over time.
1:1 RR

SHIBA UPDATE (BUY/DOUBLE)- on the daily chart : shiba gave us a green candle confirming the uptrend .
- on the 15 min chart : we can see the price broke the VWAP upwards and bounced off it again after the first breaking
- best move : buy or double you're position

SHIBUSDShiba looks bullish, at the moment it is on a descending channel and looking for a break out to the upside.
Wait for more development and confirmation. If BTC allow it, SHIBA might have green candles.

shiba forcaston the weekly chart : really violent price fluctuation in the past few weeks
on the daily chart : good buying in signal (green candle with an importan wick that shows the strong presence of buyers
personal opinion : the price will rise untill the level with a 65% chance a breaking will accure
best move : for day traders / (buy now)
for long term traders /(wait for the movement calm down and a conferming green candle breaking the top level appears on the weekly chart)

SHIBAWhat do we expect from this popular token?
What direction do we expect it to break from this triangle?

SHIBA NUMBER PREDICTIONS ON BREAKOUTNUMBER breakout possibillities for shiba coming up next couple hours possibly FTX:SHIBUSD

SHIBA FIBONACHIPREDICTION CHART NOTE THAT THIS IS NOT SUPPOSE TO IMPLEMENT ANY TRADING ADVICE INSTEAAD THIS IS A PREDICTION THAT MAY OR MAY NOT HAPPEN THANK YOU. www.tradingview.com

SHIBUSDT!!! HUGE CUP AND HANDLEThe chart provides my thoughts.
Please remember to do your own research and this is not financial or investment advice.


Shiba drop on Robinhood!Shiba finally trading on Robinhood we saw a big spike on the first day this landed on robin hood which hit .00003. Alot of buyers got their hands on this coin. The Shiba metaverse have not even been drop yet. Get ready for this coin to have continue growth for the next few months. Analysis shows a bull coming.
Follow for more Free analysis this is not financial advice I am also not a license advisor do your research.

Shiba looks prepped for a run.Shiba Inu was trading about 4.5% lower on Thursday in a second day of consolidation after over 21% higher on Tuesday, after Robinhood announced it had listed it.
The price action on Wednesday and Thursday has taken place completely within Tuesday’s trading range, which has created a double inside bar pattern on the daily chart. An inside bar pattern indicates a period of consolidation and is usually followed by a continuation move in the direction of the current trend.
Shiba Inu’s double inside bar pattern leans bullish because the inside bars are being formed near the top of the mother bar. The pattern also leans bullish in this case because Shiba Inu was trading higher before forming the inside bars.
On Thursday, Shiba fell down to the eight-day and 21-day exponential moving averages to test the levels as support and bounced up slightly. As long as the crypto continues to hold above the eight-day EMA, the eight-day will continue to trend above the 21-day EMA, which may give bullish traders the confidence to remain in their positions.
Thursday’s price action caused Shiba Inu to confirm it’s started to trade in an uptrend pattern, because the low-of-day price has created a higher low. If the pattern continues to play out, Shiba Inu will rise up to create a higher high above Tuesday’s high-of-day at the $0.00003 mark.
If Shiba Inu continues to trade within Tuesday’s mother bar on Friday and perhaps into the weekend, the crypto may settle into a bull flag pattern on the daily chart. If it does, and the pattern is recognized, the measured move is about 36%, which indicates Shiba Inu could soar up toward the $0.0000344 area.
Shiba Inu has resistance above at $0.00002640 and $0.00002958 and support below at $0.00002333 and $0.00002012.

SHIB/USD LongInto support on higher timeframe.
Target is a moving average so will be adjusted over time.
1:1 RR

SHIB seemingly bullish and awaiting breakoutSHIB and BTC are both still holding fairly strong, neither is overly bullish at this point, but more bullish than not. I am still expecting us to potentially run up to .000032 +/- NFA, DYOR

Same idea just extendedLooking like this pennant is forming nicely - gives a bit more credence to bullish sentiment.
As per always, depends on BTC and top alts movements and lately, they're doing better

SHIB Pennant Watch for SHIB to exit Pennant and run up to 33-35 range in this next impulse.
Good Luck

