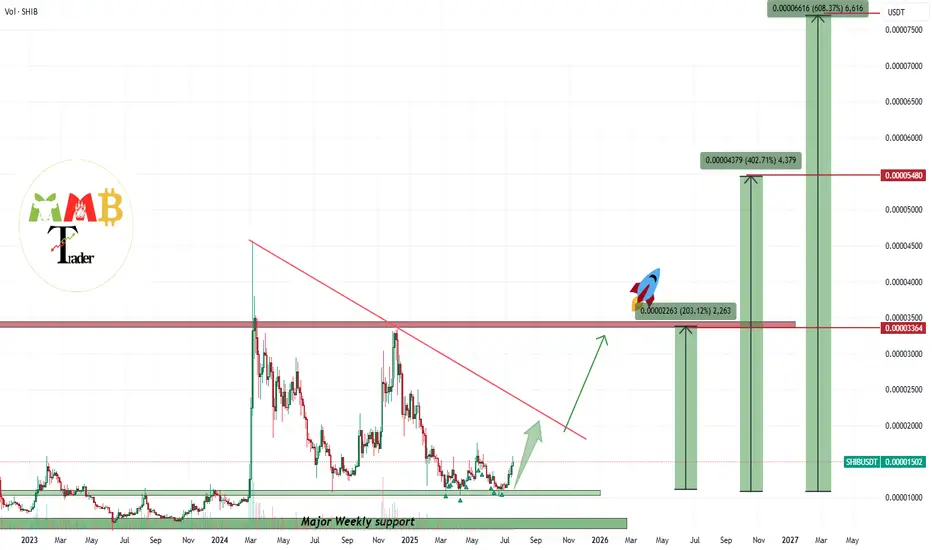
SHIBUSDT OLD enough to break the resistance and pump soon While the spots are waking up it seems here we have kind of sleep and dead coin named BINANCE:SHIBUSDT but this turtle🐢 usually pump later than any one else in market and kill the emotions of some holders.
So be patient + wait for breakout of red trendline = Heavy pump and profit coming.
DISCLAIM
Related pairs

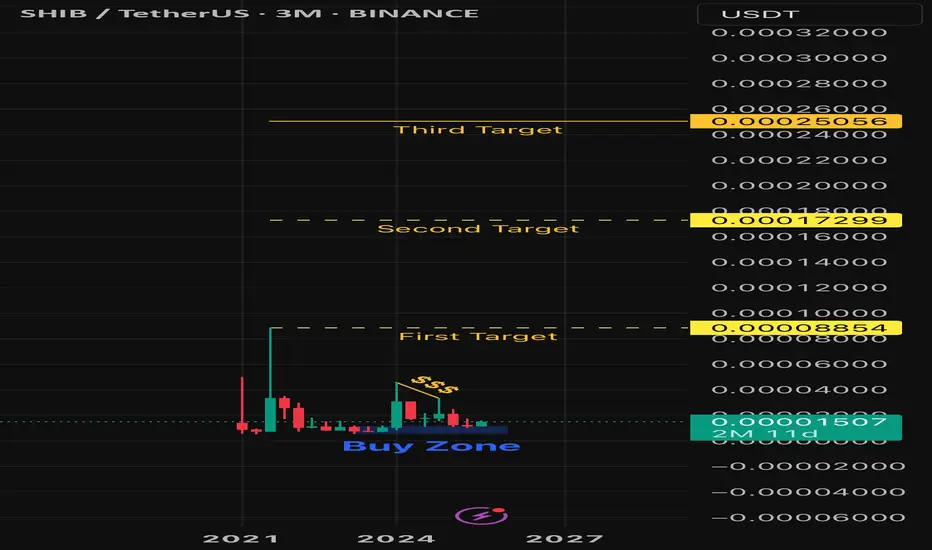
Shib’ I Knew It (targets)Shiba Inu is on its way to its previous all time high and beyond. Will price reach any of my target points this bull run? Who knows? What I do know or at least think I know, is that Shiba Inu is at a discount. Stay tuned!
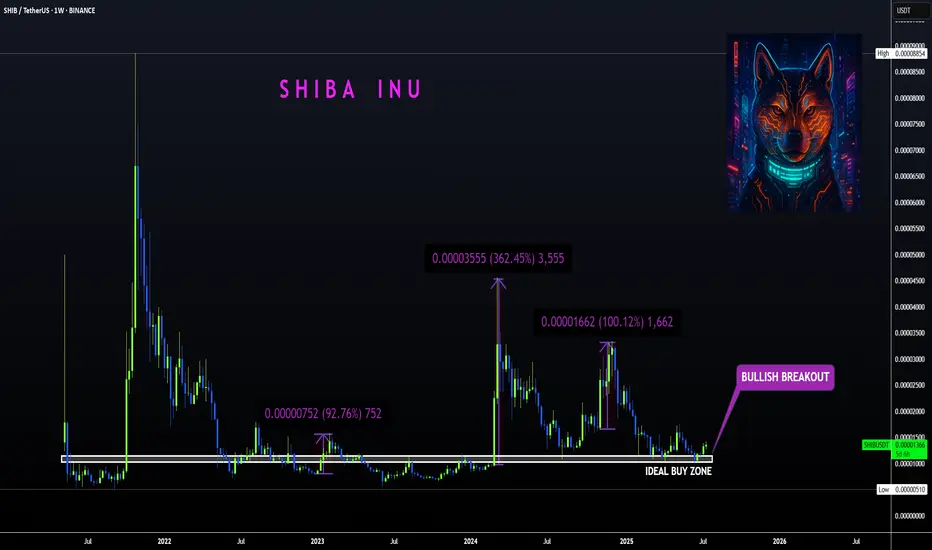
SHIBA | Bullish Breakout ABOVE Ideal Buy ZoneBINANCE:SHIBUSDT
Shiba is know to make big increases in short periods of time... that's why we love it!
The tricky thing about SHIBA is that the pumps can be unpredictable so the best way to ensure a position is to buy as low as possible to the ideal buy zone.
In the weekly timeframe, the tec
SHIBUSDT first target is +200% after years of sleepBINANCE:SHIBUSDT is not dead or sleep or it wont be any more and i think in this market soon it can see more gain and this +40% until now is just start and at least our first target which is +200% can hit soon like green arrow.
DISCLAIMER: ((trade based on your own decision))
<<press like👍 if you
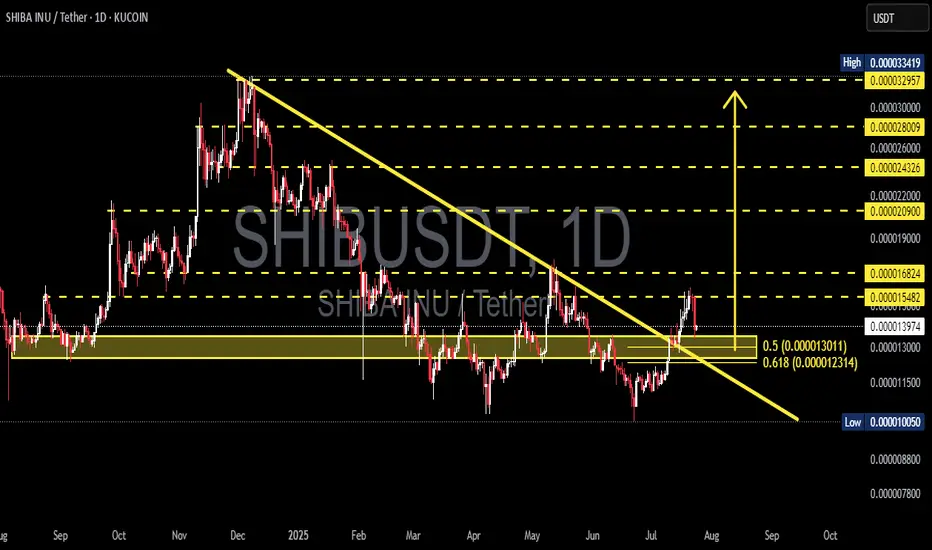
Can Shiba Inu rally 20 percent to hit 0.000015?Hello✌
All previous targets were nailed ✅! Now, let’s dive into a full analysis of the upcoming price potential for Shiba Inu📈.
BINANCE:SHIBUSDT has decisively broken above its descending channel and key daily resistance, supported by fresh, solid volume 📈. This breakout signals strong momentum

SHIBUSDT | Explosive Breakout from Long-Term Downtrend!📊 Overview:
After months of being trapped in a major downtrend, SHIBA INU (SHIBUSDT) has finally broken out of a multi-month descending trendline that has been capping price action since late 2024. But this isn’t just a minor breakout — this could mark a macro trend reversal, with bullish momentum
SHIBUSDT 1D#SHIB has broken above the descending channel and the SMA100 on the daily timeframe. It is now facing the daily SMA200, and it seems likely that we may see a minor correction toward the support level around $0.00001356. In case of a successful retest, the targets are:
🎯 $0.00001635
🎯 $0.00001891
🎯

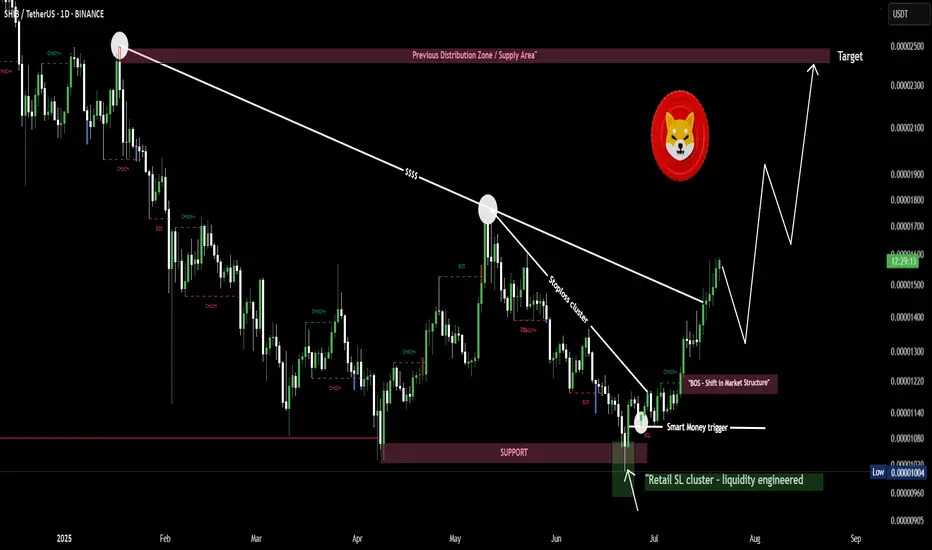
$SHIB/USDT Grabbed liquidity below key support and reversed hardSHIB just gave you a free masterclass in liquidity.
Here’s exactly what happened 👇
2/
Retail panic sold as price broke support.
That break? Engineered.
Liquidity was swept, and price instantly reversed — leaving late sellers wrecked.
3/
Smart money doesn’t chase.
They trap you first, then move th
$SHIB Ready to Move?CRYPTOCAP:SHIB has printed confirmed weekly bullish divergence in RSI and is now attempting to overcome the weekly 200EMA resistance.
A High Volume Node lies just above but a close above this will signal a bullish trend ready to move the initial target of the weekly pivot point followed by the 0.

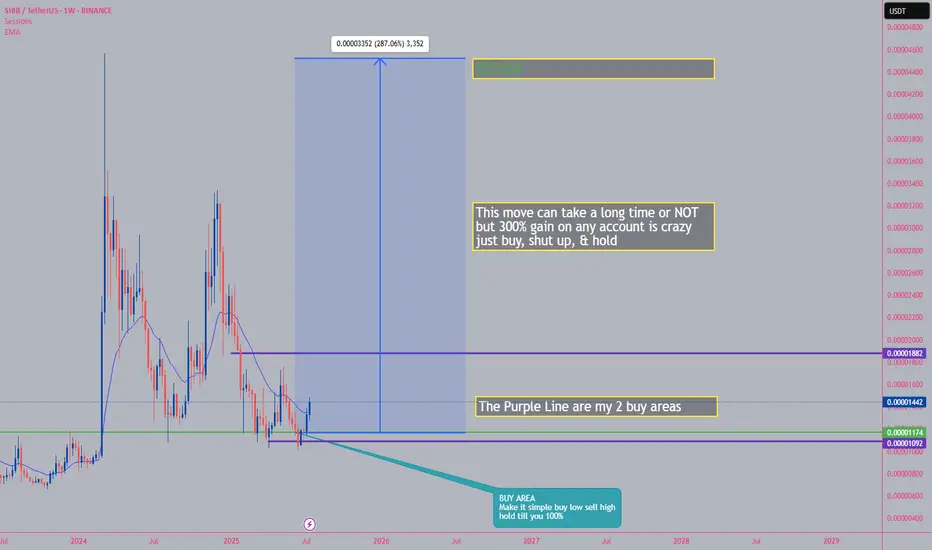
DON'T FORGET SHIB IT WILL FLY SOONI've been in this trade for about 5 Months, but patients always pay off no matter if it's 1-2 years it will pay off in the long run thanks you GehavianGoals for holding I'm just thanking myself in this message
See all ideas
Summarizing what the indicators are suggesting.
Oscillators
Neutral
SellBuy
Strong sellStrong buy
Strong sellSellNeutralBuyStrong buy
Oscillators
Neutral
SellBuy
Strong sellStrong buy
Strong sellSellNeutralBuyStrong buy
Summary
Neutral
SellBuy
Strong sellStrong buy
Strong sellSellNeutralBuyStrong buy
Summary
Neutral
SellBuy
Strong sellStrong buy
Strong sellSellNeutralBuyStrong buy
Summary
Neutral
SellBuy
Strong sellStrong buy
Strong sellSellNeutralBuyStrong buy
Moving Averages
Neutral
SellBuy
Strong sellStrong buy
Strong sellSellNeutralBuyStrong buy
Moving Averages
Neutral
SellBuy
Strong sellStrong buy
Strong sellSellNeutralBuyStrong buy
Displays a symbol's price movements over previous years to identify recurring trends.
Frequently Asked Questions
The current price of SHIB / Tether USD (SHIB) is 0.00001365 USDT — it has fallen −10.35% in the past 24 hours. Try placing this info into the context by checking out what coins are also gaining and losing at the moment and seeing SHIB price chart.
SHIB / Tether USD price has fallen by −3.48% over the last week, its month performance shows a 19.38% increase, and as for the last year, SHIB / Tether USD has decreased by −19.99%. See more dynamics on SHIB price chart.
Keep track of coins' changes with our Crypto Coins Heatmap.
Keep track of coins' changes with our Crypto Coins Heatmap.
SHIB / Tether USD (SHIB) reached its highest price on Mar 5, 2024 — it amounted to 0.00004627 USDT. Find more insights on the SHIB price chart.
See the list of crypto gainers and choose what best fits your strategy.
See the list of crypto gainers and choose what best fits your strategy.
SHIB / Tether USD (SHIB) reached the lowest price of 0.00000522 USDT on Jun 13, 2023. View more SHIB / Tether USD dynamics on the price chart.
See the list of crypto losers to find unexpected opportunities.
See the list of crypto losers to find unexpected opportunities.
The safest choice when buying SHIB is to go to a well-known crypto exchange. Some of the popular names are Binance, Coinbase, Kraken. But you'll have to find a reliable broker and create an account first. You can trade SHIB right from TradingView charts — just choose a broker and connect to your account.
Crypto markets are famous for their volatility, so one should study all the available stats before adding crypto assets to their portfolio. Very often it's technical analysis that comes in handy. We prepared technical ratings for SHIB / Tether USD (SHIB): today its technical analysis shows the neutral signal, and according to the 1 week rating SHIB shows the sell signal. And you'd better dig deeper and study 1 month rating too — it's sell. Find inspiration in SHIB / Tether USD trading ideas and keep track of what's moving crypto markets with our crypto news feed.
SHIB / Tether USD (SHIB) is just as reliable as any other crypto asset — this corner of the world market is highly volatile. Today, for instance, SHIB / Tether USD is estimated as 7.85% volatile. The only thing it means is that you must prepare and examine all available information before making a decision. And if you're not sure about SHIB / Tether USD, you can find more inspiration in our curated watchlists.
You can discuss SHIB / Tether USD (SHIB) with other users in our public chats, Minds or in the comments to Ideas.