Hypothetically Trade advise The chart for SHIB/USDT on the 4-hour timeframe appears to be forming a potential "Double Bottom" pattern, which is typically considered a bullish reversal pattern. This pattern is characterized by two distinct lows at approximately the same price level, indicating a level of support. The price action between the two lows often forms a peak, known as the "neckline."
- Entry:0.00001500 (upon confirmed breakout)
- Stop-Loss:0.00001250
- Take-Profit:0.00001700
SHIBUSDT trade ideas

SHIBUSDT PERPETUAL is now moving in uptrend!SHIBUSDT PERPETUAL is now moving in uptrend!
RESISTANCE is between 0.000014648 and 0.000014414
SUPPORT is between 0.000013153 and 0.000012713
RESISTANCE IS broken and price coming for retest.
ENTRY POINT :- 0.000014638
TAKE PROFIT :- 0.000015350
STOP LOSS :- 0.000014170

SHIB price breakout rally ready to top $0.000028Falling Wedge Pattern: SHIB experienced a 67% price drop from March to September, forming a falling wedge pattern, indicating a possible bullish reversal.
Double-Bottom Formation: Shiba Inu's price has shown a lateral trend, breaking above the overhead trendline, signaling a potential double-bottom reversal pattern.
50-Day EMA Resistance: The recent recovery rally is testing the 50-day EMA as the next significant resistance level for SHIB’s price action.
12% Price Recovery: SHIB has seen a 12% recovery, forming four consecutive bullish candles, indicating renewed buying momentum.
RSI Turning Bullish: Despite the July death cross, the RSI remains bullish and is approaching overbought territory, suggesting strong buying pressure.
Intraday Gain of 2.20%: SHIB is currently trading at $0.00001440 with an intraday gain of 2.20%, continuing its upward trajectory.
200-Day EMA Target: If SHIB surpasses the 50-day EMA, the next target is the 200-day EMA at $0.00001683.
Psychological Resistance at $0.000020: After breaking the 200-day EMA, the $0.000020 mark stands as a crucial psychological resistance level.
Key Resistance at $0.000028: Beyond the psychological resistance, the next key resistance level to watch is $0.000028.
Support at $0.00001297: The crucial support level for SHIB lies at $0.00001297, which has held through the recent downtrend.
Weekly Chart Bearish Pullback: SHIB remains in a pullback phase, trending below the 50W EMA on the weekly chart, indicating short-term bearish sentiment.
Long-Term Potential for 10X Rally: Based on Fibonacci levels, SHIB could reach the 1.618 level at $0.0001050 in the next bull run, offering nearly 10X returns.

#SHIBUSDTA recommendation
The main resistance line can be a bold red line
Going through it can be sweet
so
The failure and crossing of the resistance of the red line can be monitored.

Shiba Inu (SHIB) Bullish Chart Pattern Alert📈 SHIB is showing a strong bullish pattern, indicating potential upside momentum in the coming days!
🔍 What’s Happening? The charts are signaling that SHIB could be gearing up for a significant move. Bullish patterns often suggest that buyers are stepping in, pushing the price higher.
🔗 Key Factors to Watch:
Uptrend Confirmation: Look out for higher highs and higher lows forming.
Breakout Potential: A breakout above resistance levels could ignite a new rally.
Increased Volume: Watch for rising volume, which often accompanies strong upward movements.
🚨 What to Expect: If the pattern completes, SHIB could be in for a breakout, leading to the next leg up. Keep your eyes on key resistance levels for confirmation.
🌟 Why It Matters: A bullish chart pattern can be a powerful signal of positive price movement. Stay informed and ready for potential gains!
📊 Stay vigilant, do your research, and never invest more than you can afford to lose. Exciting times ahead for #ShibaInu
BINANCE:SHIBUSDT

SHIBUSDT.1DIn this detailed analysis of the SHIB/USDT daily chart, I am assessing the current market conditions to refine my trading strategy. Presently, SHIB is trading at $0.00001336, reflecting a decrease of 1.37% for the day.
The chart illustrates a clear downtrend as marked by the red descending trendline (R3), indicating sustained bearish momentum over time. The price is currently consolidating, forming a narrow range between the immediate support (S1) at $0.00001098 and the resistance level (R1) at $0.00001610.
Breaking down the resistance and support levels further, it's evident that SHIB has struggled to break above R1 despite several attempts, suggesting strong selling pressure at this level. If SHIB can break above R1, the next key resistance level to watch would be R2 at $0.00002035, which could open up further bullish potential towards R3.
Conversely, a breakdown below S1 could exacerbate the bearish sentiment, potentially pushing the price towards new lows. This would make the next support level at the recent low of $0.00000688 an area of interest for bears.
The Moving Average Convergence Divergence (MACD) is slightly below the zero line, with the MACD line just below the signal line. This indicates a weak bearish momentum, suggesting that the downtrend is losing strength but not necessarily reversing yet.
The Relative Strength Index (RSI) is near the neutral zone at 45.29, which indicates that there is neither excessive bullish nor bearish momentum. This aligns with the current consolidation phase, suggesting that the market is undecided.
In conclusion, my analysis suggests that SHIB is currently in a state of consolidation within a broader bearish trend. Key levels to watch are the resistance at $0.00001610 and the support at $0.00001098. A break above resistance could signal a potential reversal or relief rally, while a drop below support may continue the bearish trend. Caution and close monitoring of these levels are advised as the market decides its next major move.

Shiba to the moonSHIN
As we see in the last rise, the price crossed the 2022 resistance
But it did not close above it
And small investors sold and the price slowly returned to the support area shown in blue
There is stability and respect for this support area to a great extent
We expect strong liquidity to enter and a large rise and break the first resistance and stability above it
That means Shiba to the moon
--------------------------------
I apologize that my English is not good
Good luck to all
--------------------------------
Did you like my analysis? Leave a comment, like, and follow to get more

Shiba Inu Price Analysis - The downtrend is starting againShiba Inu Price Analysis - The downtrend is starting again
Shiba Inu has recently broken out from a bearish triangle pattern, signaling a potential further decline in price.
The current trend suggests that it might mirror the previous scenario depicted on the left side of the chart, but in reverse.
Following the breakout from the bearish pattern, the downward momentum is intensifying. We expect Shiba Inu to test the support levels at $0.00001244 and $0.00001109 soon. These targets could be reached within this week.
You may find more details in the chart!
Thank you and Good Luck!
❤️PS: Please support with a like or comment if you find this analysis useful for your trading day❤️

SHIB: Struggling to Break Key ResistanceSHIB has shown a consolidation pattern in the last several hours, trading at $0.00001365, with both the 1H and 4H data indicating weak momentum and slight bearish tendencies. Recent whale activity and general meme-coin market interest have supported SHIB’s price, but technicals show a need for stronger momentum to push the price higher.
1H Chart Breakdown: Weak Momentum and Consolidation
On the 1-hour chart, SHIB has been hovering near its Bollinger Band Basis of $0.00001376, unable to gain significant bullish momentum. The RSI at 38.52 signals a slightly oversold condition, while the Stochastic Oscillator (%K at 3.85) is deep in oversold territory, hinting at a potential short-term bounce. However, the MACD is flat, and the ADX at 11.46 indicates a weak trend, suggesting the price might remain in a tight range unless there’s a volume spike.
Resistance: $0.00001387 (Upper BB)
Support: $0.00001365 (Lower BB)
4H Chart Breakdown: Bearish Momentum Building
The 4-hour chart is showing more caution, with SHIB sitting slightly below the Bollinger Band Basis ($0.00001369). The RSI at 49.70 is neutral but points toward a weakening bullish trend, while the Stochastic Oscillator (%K at 25.76) is still in oversold territory, suggesting potential for a brief upward correction. However, the MACD histogram is negative, indicating growing bearish momentum, while the ADX at 12.22 suggests the trend is still relatively weak.
Resistance: $0.00001411 (Upper BB, Parabolic SAR)
Support: $0.00001327 (Lower BB)
Support and Resistance Levels (Across Timeframes):
Immediate Resistance (1H & 4H): $0.00001387 - $0.00001411 (Upper BB, SAR level)
Immediate Support: $0.00001327 - $0.00001365 (Lower BB)
Actionable Strategy: Range-Bound Trading with Weak Momentum
Bullish Scenario:
If SHIB breaks above $0.00001387 (1H Upper BB), it could attempt a push toward $0.00001411 (4H resistance and SAR level). For traders seeking quick entries, look for a bounce confirmation with rising volume.
Bearish Scenario:
A failure to hold support at $0.00001365 could see SHIB testing the $0.00001327 level (Lower BB on 4H), and a break below this could open doors to more significant downside toward $0.00001280.
Action Point: Given the weak ADX and neutral momentum, consider range-bound trading strategies, setting tight stop-losses around $0.00001327 and aiming for modest profit-taking near $0.00001387.

SHIBUSD View!!The Shiba Inu
SHIBUSD
community has just received an important notice. As the dog-themed cryptocurrency expands, ShibArmy Scam Alerts has issued a wake-up call for Shiba Inu and the broader crypto community.
In a tweet that ShibArmy Scam Alerts captioned "Protecting Communities from Scams, FUD, and Deception," the Shiba Inu-focused X account urges crypto holders to stay vigilant in the fast-paced world of cryptocurrencies.
Protecting Communities from Scams, FUD, and Deception
In the fast-paced world of crypto, moderators on platforms like Telegram or Discord play a crucial role in keeping the community safe. Their strict approach to rules might seem intense, but it’s essential for protecting… pic.twitter.com/8zoThh9w9X— Shibarmy Scam Alerts (@susbarium) September 14, 2024

SHIBA INU BREAKOUT IMMINENT?Chart explains it all. Along with other alts, SHIB should be gearing up for a parabolic Q4. We should start seeing this once BTC clears all resistances to All Time High.

Shiba Inu Burn Rate Surges Over 8000%, Signals a Bullish TrendShiba Inu ( CRYPTOCAP:SHIB ), one of the leading meme cryptocurrencies, is making headlines again as its burn rate skyrocketed over 8000%. Despite facing a broader bearish market, this dramatic spike has reignited investor optimism, hinting at a potential bullish breakout on the horizon. Let’s dive deeper into the factors driving this surge and explore the technical and fundamental aspects shaping CRYPTOCAP:SHIB 's future.
The Surge in SHIB Burn Rate: A Positive Catalyst?
According to data from Shibburn dated September 11, the Shiba Inu burn rate surged an astonishing 8193.59% in the past 24 hours. This surge reflects nearly 3 million CRYPTOCAP:SHIB tokens being burned within just one day. Over the past week, an eye-popping 271.05 million CRYPTOCAP:SHIB have been removed from circulation. These burns are significant as they reduce the total supply, theoretically paving the way for price appreciation if demand remains constant.
The CRYPTOCAP:SHIB community has been actively engaging in burning tokens, a deflationary mechanism aimed at reducing the overall supply. As demand dynamics shift with ecosystem developments, such as the introduction of new utilities like knBONE on Shibarium, the prospects of a future price surge become increasingly plausible.
Fundamental Factors Fueling Optimism
Recent developments within the Shiba Inu ecosystem are also contributing to the growing positive sentiment. For instance, Shiba Inu executive Lucie recently highlighted the upcoming knBONE on Shibarium, which could provide significant opportunities for developers and further enhance the utility of SHIB within its ecosystem. With increased burning and ongoing ecosystem improvements, SHIB aims to transcend its meme coin origins and position itself as a more fundamentally sound digital asset.
Moreover, Shiba Inu’s expanding adoption and partnerships, including listings on prominent exchanges and integration into payment systems, have further solidified its position in the market. These developments are not just cosmetic; they serve as tangible use cases that could drive future demand for SHIB.
Technical Outlook: Can SHIB Break Out of the Bearish Trend?
Despite the surge in the burn rate, SHIB’s price has not yet reflected this optimism, trading in the red at $0.00001312, down nearly 2.90% in the past 24 hours. The token’s intraday low and high were recorded at $0.00001297 and $0.00001367, respectively, reflecting broader bearish market conditions. Additionally, SHIB’s market capitalization and 24-hour trading volume declined by 2.85% and 12% to $7.73 billion and $149.92 million, respectively, further indicating a dip in investor enthusiasm.
Technically, CRYPTOCAP:SHIB is facing resistance at the $0.00001367 level, with support emerging near $0.00001297. Should SHIB manage to break above these resistance levels, it could set the stage for a bullish rally, targeting the $0.00001500 mark, which has historically acted as a strong psychological barrier.
On the downside, investors should be wary of a potential drop to $0.00001200 if bearish momentum persists. The Relative Strength Index (RSI) suggests that SHIB is neither oversold nor overbought, indicating room for movement in either direction. As long as SHIB remains above its 50-day moving average, a sustained breakout may be in the cards.
Challenges and Future Considerations
Despite the promising burn rates and ecosystem growth, SHIB still faces considerable challenges. The recent hack of an Indonesian crypto exchange, which saw 9 billion SHIB tokens stolen, has caused some market jitters. Additionally, broader market trends, such as Bitcoin's recent pullback, could continue to weigh on meme tokens like SHIB.
However, despite these setbacks, analysts remain cautiously optimistic about SHIB’s near-term prospects. The recent surge in burn rate, coupled with ongoing ecosystem advancements, provides a bullish case for the token. According to CoinGape Media, SHIB could see potential gains of up to 8% in the coming days, albeit with some expected volatility.
Conclusion: A Glimmer of Hope in a Bearish Market
Shiba Inu’s 8000% burn rate surge is a bright spot in an otherwise gloomy crypto market. While the price action remains subdued for now, the deflationary effect of the burns and positive ecosystem developments point toward a more bullish outlook. Investors should keep a close eye on technical indicators and market news to gauge potential breakout opportunities.
With the SHIB community’s ongoing commitment to reducing supply and the broader ecosystem’s continuous evolution, Shiba Inu remains a token worth watching as it strives to reclaim its former glory in the crypto market.

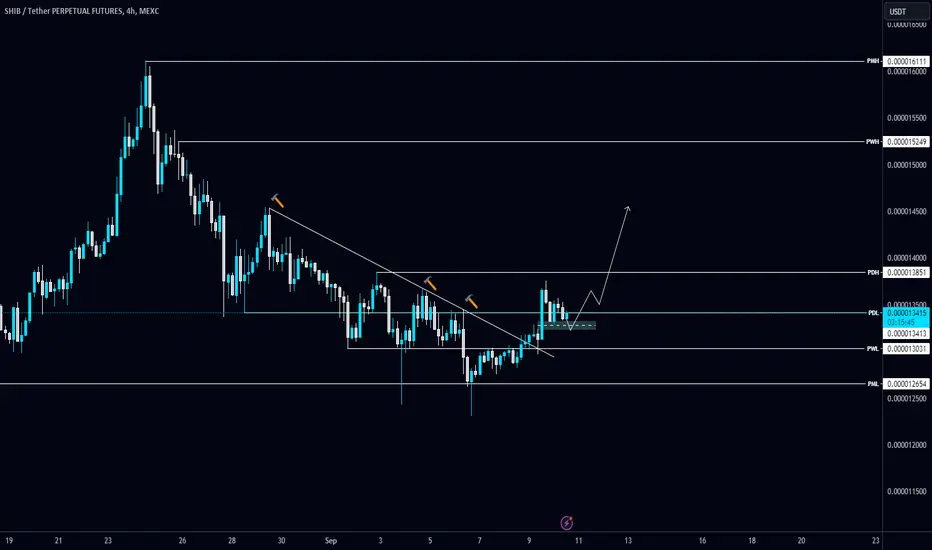
#SHIB/USDT break the Diagonal Trendline in 4-Hour TF!#SHIB/USDT break the Diagonal Trendline in 4-Hour TF!
Wait for a small 4H FVG to be tapped to long it. CRYPTOCAP:SHIB local resistance level is PWH $0.00001525. #SHIBUSDT is holding PWL $0.000013031 support level.
Shibusdt Buy opportunityShibusdt is approaching a critical juncture after breaking through a significant bearish trendline. The price is displaying a bullish reversal setup with the completion of the ADAM and EVE neckline, and we anticipate a breakout of the neckline in the near future.
The plan is to initiate accumulation at this point with a focus on the buyback zone. The immediate target for both the ADAM & Eve setup is indicated on the chart, along with the extended main setup target.
Your feedback and comments on our analysis are appreciated.
Thank you.

Will Shiba Inu make it to 1360 zone?Will Shiba Inu make it to 1360 zone?
Will CRYPTOCAP:SHIB make it to 1360 zone?
This girl needs some more buy pressure to ride it to that northern level.
These are some zones I am looking at

#SHIB/USDT rejecting from the Diagonal Trendline in 1-Hour TF! #SHIB/USDT rejecting from the Diagonal Trendline in 1-Hour TF!
CRYPTOCAP:SHIB needs to clear the Trendline to turn bullish. Wait for BO/retest to long it. The local resistance level is PDH $0.0000138.

SHIB USDT - FRACTAL Shows Bullish Impulse NextMany altcoins are currently in Accumulation Phase and/or approaching great buy zones. This is the part of the cycle where there seems to be very little action, and the price moves in a range and sideways.
It's safe to say that we can expect sideways/range trading until BTC moves the market. In a previous update, I mentioned how it is crucial to watch not only BTC, but BTC.D and the TOTAL3 market for the next move:
The good news, is that this makes for an excellent time to BUY back into any market. The lowest risk option here would require some patience though, because the accumulation cycle often lasts month. Luckily - we are already a month in of mostly range trading.
Here's a look at another altcoin that's possible worth buying - RNDR, which is now approaching a great zone to buy-back :
__________________________________
BINANCE:SHIBUSDT

Shiba Inu bulls fail: here's whyShiba Inu (SHIB), a leading meme coin, has been trading within a horizontal range since August 8. While it briefly surged past the upper boundary of this channel, it failed to sustain the breakout and dropped back below resistance on August 28.
Following this, SHIB moved toward the channel’s lower boundary, which acted as support. However, the coin has now broken below this key level, signaling increased selling pressure and the likelihood of further declines in SHIB’s value.
A market is said to be in consolidation when an asset trades within a horizontal channel, meaning its price moves within a defined range for a period of time. The upper boundary of this channel represents resistance, while the lower boundary acts as support.
In the case of Shiba Inu (SHIB), this consolidation saw the asset facing resistance at $0.000014, while bulls provided support at $0.000012. This sideways movement highlighted the balance between buying and selling pressures in the SHIB market, preventing the coin’s price from making a strong move in either direction during this period.
If Shiba Inu (SHIB) retests its recent breakout and successfully reverses, it could signal the start of a new uptrend. With sufficient buying pressure, SHIB’s price might rally toward the resistance level of $0.000014 and potentially break above it.
If this occurs, the meme coin could aim for the $0.000018 mark.
However, if the current downtrend persists, SHIB’s value could face a further 23% drop, bringing it back to its August 5 low of $0.00001. This scenario would indicate a deeper bearish outlook, with selling pressure continuing to weigh on the coin’s price.

SHIBUSDT Technical AnalysisWhen the SHIBUSDT 4-hour chart is examined; It is observed that the price movements continue in a downward trend. As long as the crypto's 0.00001466 level cannot be passed upwards, it is evaluated that in price movements below the 0.00001254 level, it can break down the 0.00001081 level and retreat to the 0.00000906 level.

SHIBUSDTWe are in a downward trend for several months
We have a descending line, which has been broken with every encounter with the previous support, except for the last wave, when the force of the sellers has decreased, with the breaking of the descending trend line, we can take a long position with a reasonable risk and reward.

SHIBUSDT TO THE MOON im not a pro trader i hope this prediction is great guys. this is according to my research hope you like guys.....

SHIB ANALYSIS🔮 #SHIB Analysis 💰💰
🌟🚀In daily chart we can see a formation of "Falling Wedge Pattern" in #SHIB. Currently #SHIB falls from its descending trendline. If #SHIB breaks and holds this pattern then we will see a huge bullish move.💲💲
🔖 Current Price: $0.00001440
⏳ Target Price: $0.00002050
⁉️ What to do?
- We have marked some crucial levels in the chart. We can trade according to the chart and make some profits in #SHIB. 🚀💸
#SHIB #Cryptocurrency #DYOR #PotentialBreakout
