SHIBA BULL/BEAR📊 SHIB/USDT (1H) Analysis
Price is consolidating inside a rising wedge pattern. A strong breakout is expected soon.
Possible scenarios:
✅ Bullish case: Break above the upper trendline (~0.0000124) could push SHIB towards 0.0000130 - 0.0000134.
❌ Bearish case: If support around 0.0000115 fails, a drop toward 0.0000100 - 0.0000104 is likely.
🔎 Key levels to watch:
Resistance: ~0.0000120 — critical for confirming a bullish breakout.
Support: ~0.0000115 — losing this level could trigger a sharper decline.
Watch RSI and volume for breakout confirmation.
💡 Trading idea:
Long on breakout & retest above 0.0000124, targets at 0.0000130+.
Short on breakdown below 0.0000115 with targets near 0.0000100.
Use tight stops outside the wedge for risk management.
SHIBUSDT trade ideas

SHIB – One Last Chance for a MoveGiving CRYPTOCAP:SHIB one last shot to do something big.
It’s sitting at a strong pivotal level with some clean weekly SFPs forming.
A 2x looks doable, especially considering how well it’s been holding—though it may take time.
CRYPTOCAP:PEPE and CRYPTOCAP:DOGE are showing strength too, so SHIB isn’t alone here.
The key? CRYPTOCAP:BTC needs to cool off and give alts some breathing room over the next two months. Otherwise, BINANCE:SHIBUSDT could drop another 50%.

SHIB AnalysisAlthough price has been recovering for the last couple of weeks, I still don´t see clear reversal indications.
We have yet to see a higher high / higher low, or bullish RSI divergence. These are key to consider a reversal.
The green resistance zone is a key level to be broken for a bullish bias.
Meanwhile, I´ll still be looking for downside reversals in smaller timeframes targeting the June low at 0...1004

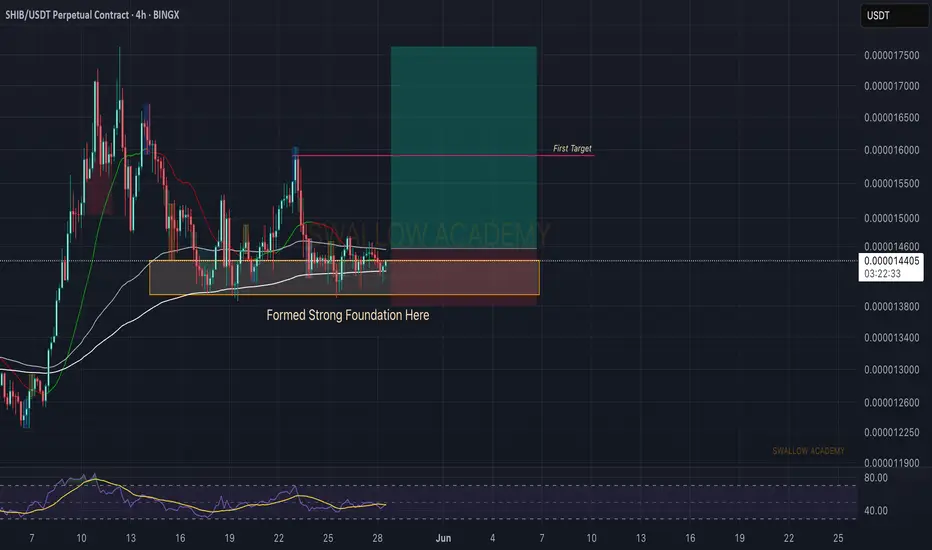
Shiba Inu (SHIB): Seeing Buyside Dominance, Looking For BreakoutShiba has formed a decent foundation near the local support area, while on the bigger timeframes we are seeing that the price is at a major support area.
With that being said, we are seeing a potential breakout happen, which would lead us to another bullish movement. We are keeping this game plan for the trade as long as we are above the $0.000011 area (as long as buyers maintain the dominance over it).
Swallow Academy

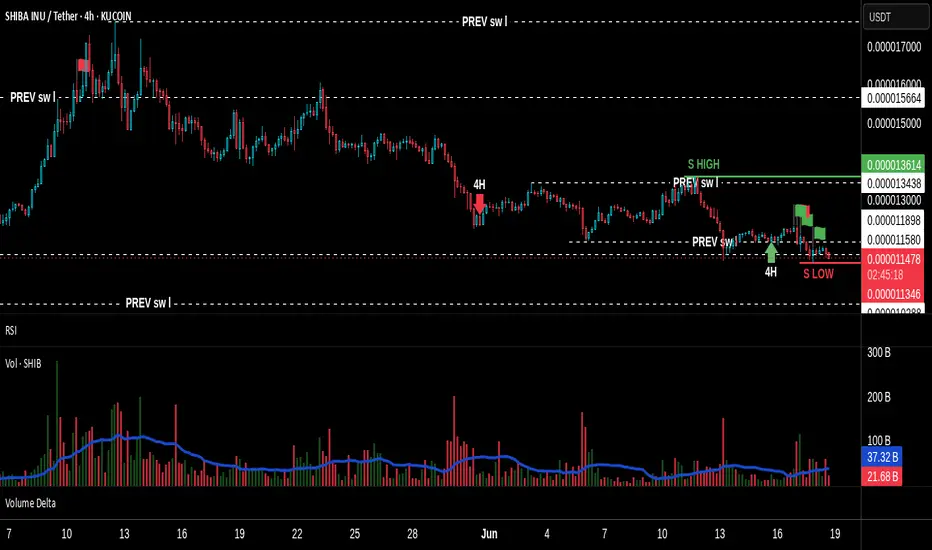
Shiba Inu (SHIB): Looking For Bounce From Current AreaShiba caught our attention with recent hovering near the local EMA area, where we have established some sort of supportive area. As we see the strength of this area, we are looking for a proper bounce from here, which then would give us a chance to get 10-20% of movement.
Swallow Academy
Shiba Inu (SHIB): Approaching Bounce Zone | Bullish TrendSHIB has reached the lower side of the bullish trend, which has aligned with EMAs (just as in previous times). We are looking for a bounce to happen from here, which would give us a nice R:R position that we can take from here.
Now we are looking for proper dominance from buyers to be seen; after that, we will be going to a long position.
Swallow Academy

Shiba Inu (SHIB): Possible Quick Fill of CME & Downward MoveSHIB has recently broken the 200EMA line and is currently retesting that area. Now, the 200EMA has been a strong downtrend holder for a very long time on SHIB (if we look at a wider chart).
With the recent fakeout above that EMA, we expect the price to continue that decline but before that, we might fill the CME gap like we did the last time so eyes on it.
If all plays out well, we should see a good BOS or just a quick fill of CME and liquidity hunting to lower zones.
Swallow Academy

SHIBUSDT lowest and strong support is ahead As we can see price is near major daily support zone now and here we have one of the last daily supports which is currently touching and price can easily receive bull candles and start pump like green arrows if the supports hold.
DISCLAIMER: ((trade based on your own decision))
<<press like👍 if you enjoy💚

Is shib getting ready to plot a Giant W on the 1W? Last year in December I spotted a W on the one week and subsequently the shib took off. Here we are one year later this time the W, If completed, is about 10 times larger than the last one. Many assets are lining up with an early February blow through the roof. Keep your eyes open and good luck!

Location, Location, Location!!!Knowledge is Power!
But how deeply do most people really understand this?
The average mind thinks power comes from possessing knowledge. But here’s a deeper truth — simply imagining yourself with mastery can trigger powerful feelings. Why? Because as Terence McKenna once described, the human brain is a chemical factory. An inspired thought — a glimpse of future achievement — can activate a cocktail of serotonin and dopamine, giving us a real sensation of power. And yet… did anything really change?
This is where ancient voices — shamans, philosophers, and modern mentors — whisper:
“You are already there…”
But are you really?
The answer is Yes… and No.
You feel the outcome, but you haven’t earned it yet. You’re not truly there until you’ve gone through the effort — the hours and hours of disciplined study, reflection, and ignoring the mental traps like “take a break,” “you have time,” or “scroll a bit.” Power, in this case, is the Knowledge itself — and to approach Power, you must become Power. Or else, it will crush you — like a boot crushes an ant. (Yes, that’s borrowed from the Avengers… we all need a laugh too.)
To actually reach that imagined reality, you must prove yourself to the knowledge itself. You have to earn it — through discipline, sacrifice, and unbroken focus. That means hours of study, observation, application, and repetition — no matter how many distractions your mind throws at you.
Focus on one subject until it bends for you.
Focus like your life depends on it.
Because in a way… it does.
🧠 Opportunity Cost = Power Equation
This focused, intentional work is what economists call Opportunity Cost. It’s the measure of how productively you spend your time. Every marked level, every reaction, every shift in volume is either:
• A step closer to mastery, or
• A missed opportunity, depending on what you choose to focus on.
TradingView becomes your journal.
A sacred workspace in the chaos.
A tool to track your evolution — mentally and technically.
🔍 The SHIBA/USDT 4H Breakdown
On the 4H chart of Shiba Inu, key swing levels are marked — targets that can serve as entry/exit decisions depending on your strategy.
But the magic is not in the lines.
It’s in how volume reacts to those levels.
🔺 Volume — The King
Currently, the 4H Volume shows signs of a bearish continuation. But lower timeframes are beginning to show the initial signs of accumulation — strength where weakness used to live.
This is the beginning of Effort vs Result analysis:
• Are we seeing strong volume but no progress? (Demand absorption?)
• Are we seeing low-effort pushes into supply that fail to break key levels?
That’s how Smart Money behaves. Quietly, strategically, and always one step ahead.
And all this happens near key demand/supply zones — where Location meets Volume.
🔄 Timeframe Psychology: Past–Present–Future
Lower timeframes = The Past (they push).
Higher timeframes = The Future (they pull).
Your active timeframe = The Now — where you make your move.
A shift on the 3M chart might hint, but until it aligns with the 1H or 4H, nothing is confirmed. That’s why true traders are observers first, executors second.
🎯 Alignment: Levels, Volume, Effort
• 📍 Levels: They are not just technical — they are psychological battlegrounds.
• 🔊 Volume: It shows us where energy is being spent and whether it’s paying off.
• 🧱 Effort vs Result: The ultimate measure of Smart Money’s hidden hand.
When everything aligns, you don’t guess — you act.
🧭 Final Thoughts
At the time of this writing — 17:26 IST on June 18, 2025 — the 4H chart remains bearish in tone. But markets shift fast, and for all I know, a power transition could be unfolding on a micro timeframe as I type. That’s the nature of this game.
TA is not rigid. It is an art.
And once mastered, it becomes a part of how you think — not just how you trade.
Use your time wisely.
Let your focus become your fortress, and that fortress will guard you through every storm.
Work Smart. Think Deep. Act with Purpose.
Study the Bitcoin and Bitcoin Dominance cycle to understand altcoin flow.
Explore previous posts — I’ve shared them to help you grow.
The market is a breathing organism, I’ve pointed this in previous ideas. If you’re in sync with it—you’ll feel it.
And for those who believe there’s more to learn—but are struggling to find answers—there’s no shame in asking questions. But remember, nothing in the market is free.
Work Smart, and you’ll earn the right to follow — and even think like — Smart Money.
Till next time, take care—and trade wisely.
The trendlineSHIB needs to beat the 0.00001223 key level and then the 200 EMA at 0.00001238 and then that downward trendline, to get the bulls fired up.

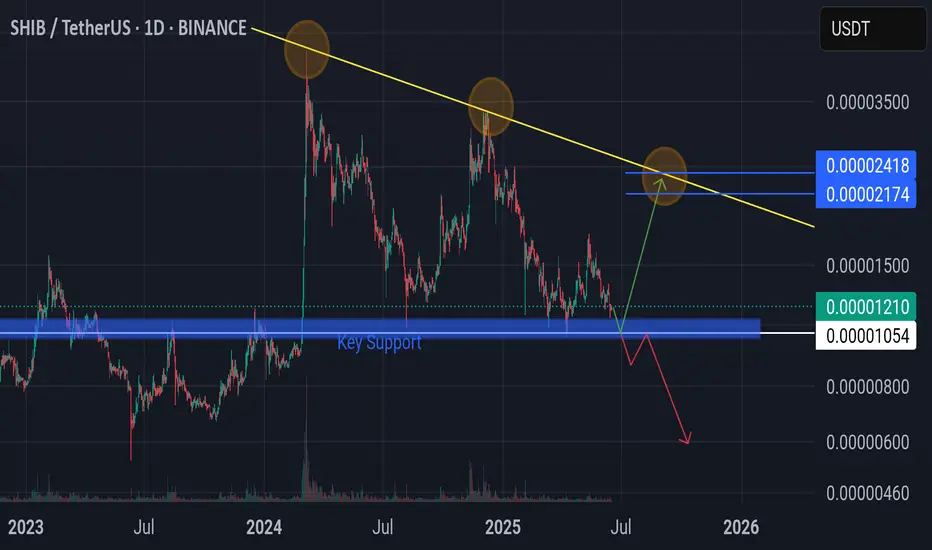
Shiba Inu!! next chapterCurrently near key support. potential reversal towards target 0.000021-0.000024.
⚠️ Invalid if falls below key support 0.00001054.
SHIBA +100%?? | BEST Buy OPPORTUNITYSHIBA has been in a downtrend for many weeks.
From here, upside is likely - especially if we look at the consecutive amount of "red" weekly candles (blue on this chart).
A 40% bounce zone is easily possible from this zone. Even at modest, 20% would be ideal:
____________
BYBIT:SHIBUSDT

SHIB/USDT is in Bullish TrendSHIB/USDT is looking good to go up side it is showing good retracement on daily chart and also showing bullish divergence on daily chart it can be buy current price or if some one want to be more sure then buy after new HH

SHIBUSDT: Price Weakness & Your Next Short OpportunityMy focus is on SHIBUSDT, and the picture is clear: price is weak. This isn't a market where buyers are proving their strength; in fact, the opposite is true.
Most traders are confused by volatility. But you need to see the real opportunity. My analysis points to this: both red boxes I've marked on the chart are prime zones for short opportunities. They represent powerful selling regions.
Here's why, and your plan for action:
Red Box Power: These zones are where sellers are truly in control. I'm actively looking for price to engage with these areas.
Green Box Uncertainty: As for the green box, its strength is questionable. I'm not confident it will hold as reliable support for a bullish move, reinforcing my overall bearish view.
Confirm the Downside: Your decisive move comes with confirmation:
Volume Footprint: I'll be scrutinizing the volume footprint to see clear distribution from sellers.
CDV (Cumulative Delta Volume): Look for CDV to turn deeply negative, affirming seller dominance.
LTF Breakdowns: On the low timeframes (LTF), demand concrete breakdowns. Price must fail, retest the red boxes as resistance, and then continue lower. This is your undeniable signal.
My general bias remains bearish. I only trade assets showing a sudden increase in volume, and while this is a short setup, the volume dynamics confirming weakness are what I'm seeking.
Keep a sharp eye on those red boxes. If these confirmations line up, you'll uncover precise, high-probability short entries. This is where smart, confirmed decisions are made.
📌I keep my charts clean and simple because I believe clarity leads to better decisions.
📌My approach is built on years of experience and a solid track record. I don’t claim to know it all but I’m confident in my ability to spot high-probability setups.
📌If you would like to learn how to use the heatmap, cumulative volume delta and volume footprint techniques that I use below to determine very accurate demand regions, you can send me a private message. I help anyone who wants it completely free of charge.
🔑I have a long list of my proven technique below:
🎯 ZENUSDT.P: Patience & Profitability | %230 Reaction from the Sniper Entry
🐶 DOGEUSDT.P: Next Move
🎨 RENDERUSDT.P: Opportunity of the Month
💎 ETHUSDT.P: Where to Retrace
🟢 BNBUSDT.P: Potential Surge
📊 BTC Dominance: Reaction Zone
🌊 WAVESUSDT.P: Demand Zone Potential
🟣 UNIUSDT.P: Long-Term Trade
🔵 XRPUSDT.P: Entry Zones
🔗 LINKUSDT.P: Follow The River
📈 BTCUSDT.P: Two Key Demand Zones
🟩 POLUSDT: Bullish Momentum
🌟 PENDLEUSDT.P: Where Opportunity Meets Precision
🔥 BTCUSDT.P: Liquidation of Highly Leveraged Longs
🌊 SOLUSDT.P: SOL's Dip - Your Opportunity
🐸 1000PEPEUSDT.P: Prime Bounce Zone Unlocked
🚀 ETHUSDT.P: Set to Explode - Don't Miss This Game Changer
🤖 IQUSDT: Smart Plan
⚡️ PONDUSDT: A Trade Not Taken Is Better Than a Losing One
💼 STMXUSDT: 2 Buying Areas
🐢 TURBOUSDT: Buy Zones and Buyer Presence
🌍 ICPUSDT.P: Massive Upside Potential | Check the Trade Update For Seeing Results
🟠 IDEXUSDT: Spot Buy Area | %26 Profit if You Trade with MSB
📌 USUALUSDT: Buyers Are Active + %70 Profit in Total
🌟 FORTHUSDT: Sniper Entry +%26 Reaction
🐳 QKCUSDT: Sniper Entry +%57 Reaction
📊 BTC.D: Retest of Key Area Highly Likely
📊 XNOUSDT %80 Reaction with a Simple Blue Box!
📊 BELUSDT Amazing %120 Reaction!
📊 Simple Red Box, Extraordinary Results
📊 TIAUSDT | Still No Buyers—Maintaining a Bearish Outlook
📊 OGNUSDT | One of Today’s Highest Volume Gainers – +32.44%
📊 TRXUSDT - I Do My Thing Again
📊 FLOKIUSDT - +%100 From Blue Box!
📊 SFP/USDT - Perfect Entry %80 Profit!
📊 AAVEUSDT - WE DID IT AGAIN!
I stopped adding to the list because it's kinda tiring to add 5-10 charts in every move but you can check my profile and see that it goes on..

SHIBUSDT 6D Analysis SHIB ~ 6D Analysis
#SHIB Buy back gradually from here if you still have confidence in this coin with a short term target of at least 20%+ from this support.

SHIB Accumulation Phase: Double Bottom Formation SHIB is currently trading sideways on the daily timeframe, showing signs of accumulation as price consolidates between well-defined support and resistance levels. The lack of directional breakout has kept the market in range, but recent structure suggests that buyers may soon gain control — if key support levels hold.
Price is revisiting the value area low and weekly support zone, where a potential double bottom formation is in progress. The first bounce from this region triggered a bullish reaction. If bulls step in again at the same level, the pattern will be technically confirmed — a strong reversal signal that often precedes upward continuation.
This setup also aligns with the broader accumulation narrative: sideways movement with strong support reactions and no major breakdowns, which typically builds the base for a breakout. However, without a decisive move above resistance and confirmation via volume expansion, SHIB may continue to chop within the current range.
For now, price remains in a constructive position, and dips into support are considered high-probability buy zones, as long as buyers continue defending key levels. A confirmed breakout above range resistance would shift momentum decisively in favor of the bulls.
Key Levels to Watch:
Support: 0.0000180 – 0.0000172 (Weekly + Value Area Low)
Resistance: 0.0000225
Confirmation: Breakout on increased volume
Bias remains neutral to bullish until the range is resolved.

SHIBUSDT soon after breaking red trendline can pump hard On this pump for market we may not have a new ATH for coins like SHIBUSDT or we may have(10% possible).
But as we can see price had a huge amount of fall and now with simple touch near previous daily high we earn good +200% profit.
DISCLAIMER: ((trade based on your own decision))
<<press like👍 if you enjoy💚

Shiba Inu (SHIB): Waiting For Buyers To Break 200 Moving AverageShiba had recently been rejected by 200EMA, and since getting rejected, the price has been falling and sellers are starting to show dominance, but this does not mean that we are entering yet into a bearish trend.
As we got a rejection, now we are waiting and going to monitor how the next candles will develop the structure, and based on it, we will be trading, but looking at the overall picture, we are looking for that 200EMA to be broken, after which we might be getting a good upward movement from there.
Swallow Academy

"Crypto Charts Whisper—Are You Listening?"As I’ve mentioned before, the market is manipulated. In a previously published idea, “VSA vs BTC: Into a Bearish Scenario or Not?”, this manipulation becomes obvious. The big players—whales, institutions, banks—are deliberately engineering traps to absorb liquidity from uninformed retail traders, boosting their profits and power.
Some informed retail traders like you and me understand that behind these entities are teams of insiders and highly trained traders operating around the clock—24/7, 365 days a year. That’s what it takes to survive in such a demanding environment.
This is especially true in the crypto market, which—despite its explosive growth—is still a baby in terms of total market cap. That’s why price fluctuations are so extreme, whether it’s Bitcoin, Ethereum, or altcoins.
Many of you who have been in the space since the early days already know: Bitcoin is the king. As the first coin built on cryptography, Bitcoin leads the way—and where it goes, altcoins follow. These movements often align with changes in Bitcoin Dominance.
So, yes, Bitcoin is the king—but its movements aren’t random. Bitcoin follows rules, and these rules are shaped by data—especially macroeconomic data. One major example is the Consumer Price Index (CPI), released monthly by the U.S. Department of Labor and Statistics.
And here's the key: the big players often have early access to this kind of information. They prepare accordingly—days before the official release—and when the data hits, they move the markets up or down. Even whales don’t act on gut feelings. They follow a framework.
We, as retail traders, must adopt a similar approach. We may not have insider access, but we do have knowledge—and with an open mind, we can act in advance.
As I’ve emphasized before: learning to read Market Structure lets you decode not just market psychology, but also the intentions of the big players. Their large positions leave footprints, just like a ship cuts a path through water. That trail is visible—for those who know where to look.
If you study volume correctly, you’ll start to notice certain zones that keep coming back. That’s all I’ll say—for now.
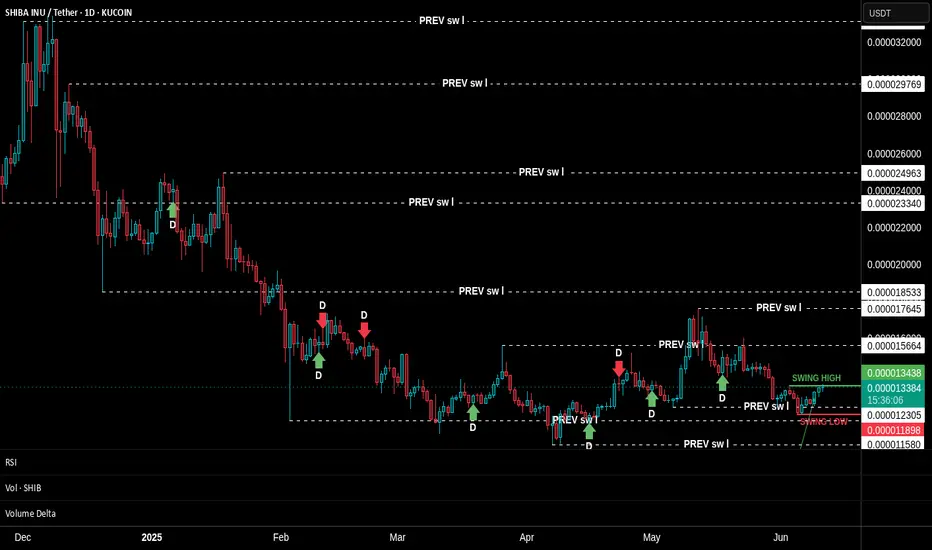
Unfortunately, many traders rely blindly on strategies like swing trading, expecting price to react at predefined swing highs or lows. But this rarely happens on schedule—especially in crypto. Yes, swing highs and lows exist—that’s the nature of all markets—but in between those levels, the big players create hidden structures that act as signals.
These aren’t just random formations—they’re part of how the big players "communicate" with one another. First, to maintain balance within their own circles. Second, to create FOMO and trap emotional retail participants.
Look at the SHIBA INU chart I’ve shared. This technique is unfolding in real time. Do you notice how the structure is compressing? How price and new swing levels are squeezing in? Look closer at the footprints I’ve highlighted—some of those levels are being respected and reused in the future.
We’re taught from childhood that "we can’t know the future." But is that really true? Repetition of such beliefs is common—worldwide. But again, is it true? I think not.
Think about this: if you drive a car full-speed toward a wall and don’t brake, what happens? You crash. Isn’t that a form of future reading? It’s based on logic, observation, and probability. The same tools we use in market analysis.
So, I hope my words challenge your thinking.
📅 As of this writing (June 11, 2025), Bitcoin is trading at $109,588.
Today’s candle still has about 17 hours left to form, and price action on the daily timeframe is sitting within a previously established supply zone. Bulls and bears are clashing here. But zoom in: what's happening on the lower timeframes? Which signals have been tested, and which haven't?
Are we about to see a breakthrough above the all-time high?
Could this be the launch of the next leg of the bull run?

Lingrid | SHIBUSDT Bullish Divergence at Support ZoneBINANCE:SHIBUSDT is attempting to recover from a structural divergence near the key 0.00001217 support area. The recent breakout above the descending channel suggests bullish intent, though price is now retesting the breakout level. If buyers hold this zone, SHIB could rally toward 0.00001430.
📈 Key Levels
Buy zone: 0.00001205–0.00001230
Buy trigger: strong bounce above 0.00001250
Target: 0.00001430
Sell trigger: break below 0.00001200
💡 Risks
Failure to hold above 0.00001200 would invalidate the divergence setup
Rejection near the downward trendline could trigger renewed downside
Market-wide weakness may cap follow-through beyond resistance
Traders, if you liked this idea or if you have your own opinion about it, write in the comments. I will be glad 👩💻

SHIBUSDT wait for 0.000020$As we can see major resistance now is red trendline so the pump from daily supports like 0.000010$ and 0.000007$ is now possible and our first target is at least 0.000020$ which is around 80% pump from here and market can get bullish once again if BTC hold above 100K$.
DISCLAIMER: ((trade based on your own decision))
<<press like👍 if you enjoy💚
