Which event will prevail?!I personally see the ascension path as more likely, because the Shiba community supports it with a particular fervor.
SHIBUSDT trade ideas

Short trade
5min TF overview
🟥 Sell-side Trade Log
📉 Pair: SHIB/USDT
🏷️ Type: Intraday | LND to NY Session AM
🧠 Setup: Liquidity Sweep & Time-Based Breakdown
📅 Date: Tuesday, 27th May 2025
🕘 Time: 9:45 AM
🔹 Entry Price: 0.00001457
🔹 Profit Target: 0.00001404 (+3.645%)
🔹 Stop Loss: 0.00001459 (-0.14%)
🔹 Risk-Reward Ratio: 26.5
🔍 Reasoning:
The trade setup leveraged time-based volatility dynamics around the 9:30 AM window, a high-activity period during the London to New York session crossover. A clear liquidity sweep at session highs confirmed sell-side momentum.
Entry 30sec (2.33%) Potential
9.30am to 10.30 am window

SHIB: Watch this level!Trading Setup
If you’re considering trading SHIB, here’s a quick setup that may help you.
The idea is: Buy when the price breaks above $0.0000185 and take profits at the levels shown in the chart.
Targets:
1. $0.00002
2. $0.0000235
3. $0.000028
-------------------------------------------
About our trades:
Our success rate is notably high, with 10 out of 11 posted trade setups achieving at least their first target upon a breakout price breach (The most on TW!). Our TradingView page serves as a testament to this claim, and we invite you to verify it!

Short trade
🟥 Sell-side Trade Log
📉 Pair: SHIB/USDT
🏷️ Type: Intraday | LND Session AM
🧠 Setup: Liquidity Sweep & Breakdown
📅 Date: Sunday, 26th May 2025
🕗 Time: LND Session AM
🔹 Entry Price: 0.00001433
🔹 Profit Target: 0.00001401 (+2.23%)
🔹 Stop Loss: 0.00001440 (-0.49%)
🔹 Risk-Reward Ratio: 4.57
🔍 Reasoning:
A New York session high was swept during the Tokyo session, triggering a liquidity trap. This was quickly followed by strong sell-side pressure, validating the setup for a lower low. The LND session entry capitalised on directional momentum as market structure broke to the downside

ChannelsOn the hourly chart, SHIB has recently tested the 200 EMA(in orange) unsuccessfully two times. As of this time, it is consolidating under the 200 EMA again. The testing and rejecting of the 200 EMA has seem to form a parallel channel. Failure of the 200 EMA again, can lead to price drop to possibly 0.00001428 or lower. We need a break out from the 200 EMA with Higher Highs and Higher Lows.

SHIB levelI have been watching this level on SHIB and it has been holding for a while. I think it's a good level with potential of something big.

Lingrid | SHIBUSDT Potential Rally to Key Resistance ZoneBINANCE:SHIBUSDT is consolidating above the key support at 0.00001373, sitting right at the intersection of the upward trendline and a major structure retest. A wedge pattern suggests cooling pressure, with the setup favoring a bullish breakout if buyers step in near this confluence. The key target lies in the 0.00001727 zone, aligning with prior highs inside the resistance channel. A breakdown below trendline support would invalidate this bullish outlook.
📈 Key Levels
Buy zone: 0.00001350 – 0.00001373
Buy trigger: breakout above wedge and upward trendline defense
Target: 0.00001727
Sell trigger: close below 0.00001350
💡 Risks
Weak volume on breakout may signal a fake move.
Sudden volatility from BTC could derail recovery.
Failure to hold the trendline flips structure bearish.
Traders, if you liked this idea or if you have your own opinion about it, write in the comments. I will be glad 👩💻


Short trade
🟥 Sell-side Trade Log
📉 Pair: SHIB/USDT
🏷️ Type: Intraday | LND Session PM
🧠 Setup: Breakout / Liquidity Sweep
📅 Date: Friday, 23rd May 2025
🕕 Time: 6:00 AM
🔹 Entry Price: 0.00001555
🔹 Profit Target: 0.00001440 (+7.40%)
🔹 Stop Loss: 0.00001564 (-0.58%)
🔹 Risk-Reward Ratio: 12.78
🔍 Reasoning:
This sell-side trade was executed following a sweep of local buy-side liquidity and a rejection from overhead resistance during the LND session. Price action confirmed the shift in order flow with strong bearish momentum and displacement to the downside. The entry capitalised on a microstructure break and the presence of a nearby Fair Value Gap (FVG), targeting inefficiency below.

Analysis shib in Neo wave method strategy for d times Shib Aegean fractal time for majority waves
Top price for 786 fbr
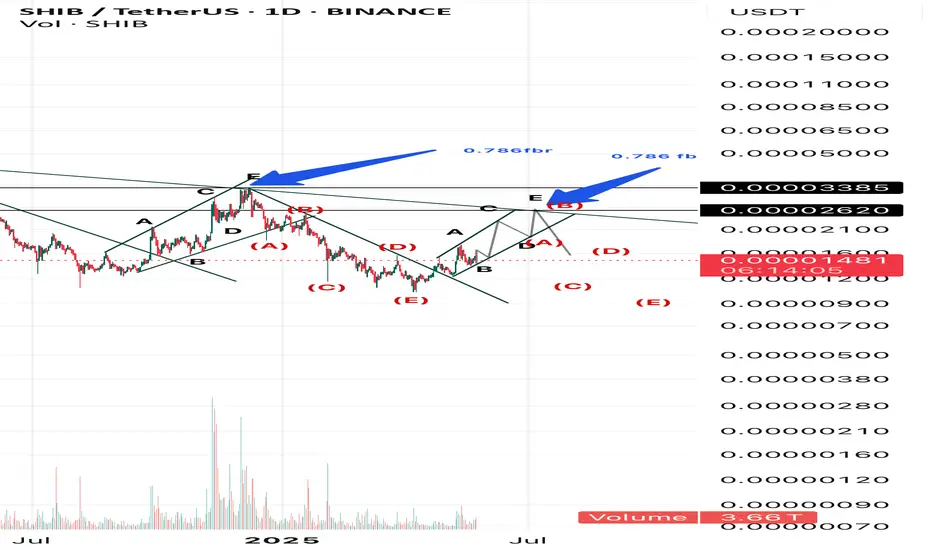
SHIB'S FUTUREMy scenario is like this.
* The purpose of my graphic drawings is purely educational.
* What i write here is not an investment advice. Please do your own research before investing in any asset.
* Never take my personal opinions as investment advice, you may lose your money.

Long trade
1Hr TF overview
🟩 Buyside Trade Log
📈 Pair: SHIB/USDT
🏷️ Type: Intraday | NY Session PM
🧠 Setup: Wyckoff Accumulation (Breakout Phase)
📅 Date: Monday, 19th May 2025
🕐 Time: 1:00 PM (1.55 pm)
🔹 Entry Price: 0.00001393
🔹 Profit Target: 0.00001535 (+10.19%)
🔹 Stop Loss: 0.00001388 (-0.36%)
🔹 Risk-Reward Ratio: 28.4
🔍 Reasoning:
The trade was structured around the Wyckoff Accumulation narrative, where the price completed its consolidation phase and transitioned into a breakout from the resistance ceiling. This move followed clear signs of absorption, a spring phase, and confirmation via higher lows within a trading range. Volume confirmed the breakout leg during the NY PM session.
5min TF entry
Observe the failed first attempt (which provided the consolidation range) and added further conviction to the buy-side entry 2nd attempt.

SHIB/USDT Potential UpsidesHey Traders, in today's trading session we are monitoring SHIB/USDT for a buying opportunity around 0.00001420 zone, SHIB/USDT is trading in an uptrend and currently is in a correction phase in which it is approaching the trend at 0.00001420 support and resistance area.
Trade safe, Joe.

Shiba Inu Crypto: A Useless Coin That Can Still Make You RichHey everyone, welcome back to a new supply and demand crypto analysis. Today, I will analyse one of the most unexpected — but potentially lucrative — investment opportunities in the crypto space right now: Shiba Inu Metaverse crypto.
Yeah, I know what you’re thinking… “Isn’t Shiba Inu just another meme coin?”
And yes, fundamentally, it’s not trying to solve world hunger or revolutionise finance. But guess what? You don’t need a coin to be helpful to make money from it.
All you need is to understand price action and supply and demand. That’s it.
What is Shiba Inu?
So let’s break it down. Shiba Inu started as a meme — a direct competitor to Dogecoin. It’s an ERC-20 token on the Ethereum network with a massive circulating supply and a huge following. Over time, it has evolved and launched its own ecosystem — including Shibarium, SHIB: The Metaverse, and other utilities.
But let’s be real: Shiba Inu is not about real-world utility. It’s about speculation, community hype, and timing the market right based on simple but powerful trading concepts.
Daily Timeframe is Trending UP
Right now, things are shifting in our favour on the daily timeframe. We’ve just entered an uptrend — a key change in market structure — and more importantly, we’ve got a new imbalance forming around $0.00001320. This is the next key level where we’re waiting to re-enter the market.
Why wait? Because smart investors don’t chase candles. They wait for the price to return, where demand will likely kick in again. That level is $0.00001320. Once price returns there and confirms demand, we buy — and we ride the next wave.

Long trade🟩 Buyside Trade Log
📈 Pair: SHIB/USDT
🏷️ Type: Intraday | NY Session PM
🧠 Setup: Breakout
📅 Date: Monday, 19th May 2025
🕜 Time: 1:30 PM
🔹 Entry Price: 0.00001393
🔹 Profit Target: 0.00001448 (+3.95%)
🔹 Stop Loss: 0.00001388 (-0.36%)
🔹 Risk-Reward Ratio: 11.00
🔍 Reasoning:
The trade was triggered during the NY PM session following a breakout from local consolidation. Price action demonstrated strong bullish intent with a clean sweep of near-term resistance and no immediate supply overhead
30min TF

$SHIBUSDT – Major Retest Holding!CRYPTOCAP:SHIB is retesting a key breakout zone after breaking through a long-term descending trendline + 200 EMA. The structure remains bullish with a clean higher-low forming at the confluence of support.
📊 Technical Breakdown:
Breakout from descending triangle
Bullish retest of trendline + 200 EMA
Price printing higher lows above key support
🎯 Targets:
TP1: 0.000015252
TP2: 0.000017091
TP3: 0.000018929
🛑 Stop-loss: 0.000013153
📍 Entry Zone: Around 0.000014785
If bulls hold this zone, SHIB could see continuation toward mid-May highs and beyond.

SHIB – Long Here, Aiming for 50% Upside
Time to go long on CRYPTOCAP:SHIB and ride this wave.
Doesn't look like it's going much lower—I was hoping to grab some a bit deeper into the green zone, but that might’ve been too picky.
Stepping in with a decent-sized position here. Will add more if it dips.
Planning to hold through June, market conditions permitting. First target: +50%.
BINANCE:SHIBUSDT

May 20, 2025, Shiba Inu (SHIB) AnalysisMarket Overview
24h Change: +0.00000 (0.00069%)
24h High: $0.00001503
24h Low: $0.00001396
Technical Indicators
Resistance Levels:
$0.00001460 – $0.00001480: Short-term resistance zone.
$0.00001520: Recent peak before the current consolidation.
CryptoRank
+2
TradingView
+2
CoinMarketCap
+2
Support Levels:
$0.00001400: Psychological support.
$0.00001380: Key support level; a drop below may indicate further downside.
Yahoo Finance
+25
NFT Evening
+25
CoinDesk
+25
Moving Averages:
MA(7): Approximately $0.00001410
MA(25): Approximately $0.00001446
MA(99): Approximately $0.00001745
The price is currently trading between the MA(7) and MA(25), indicating a neutral short-term trend.
Suggested Trading Strategy
Given the current market conditions:
If Holding: Consider setting a stop-loss slightly below the $0.00001400 support level to manage potential downside risk.
If Planning to Take Profit:
TP1: $0.00001460
TP2: $0.00001520
If Price Breaks Below Support:
Monitor for a potential drop to the $0.00001380 level.
The market is exhibiting low volatility with the price consolidating in a narrow range. A breakout above the $0.00001460 – $0.00001480 resistance zone could signal a bullish move towards $0.00001520. Conversely, a drop below the $0.00001400 support may lead to a retest of the $0.00001380 level.

SHIBUSDT after more range here heavy pump is aheadWe may have more range here below the red trendline resistance zone and this range is best time for buy in my opinion soon the red trendline resistance will break and above there market would be extremely bullish and heavy pump is expected like green arrows on chart.
DISCLAIMER: ((trade based on your own decision))
<<press like👍 if you enjoy💚

Long trade
1Hr TF overview
🟩 Buyside Trade Log
📈 Pair: SHIB/USDT
🏷️ Type: Intraday | LND Session AM
🧠 Setup: Breakout
🆔 Trade ID: #SHIBUSDT-0518A
📅 Date: Sunday, 18th May 2025
🕤 Time: 9:30 AM
🔹 Entry Price: 0.00001473
🔹 Profit Target: 0.00001567 (+6.38%)
🔹 Stop Loss: 0.00001455 (-1.22%)
🔹 Risk-Reward Ratio: 5.22
🔍 Reasoning:
The trade was executed as a breakout entry during the London AM session. Price breached a key consolidation high with conviction, signalling the initiation of a new leg higher. The breakout structure was supported by a volume increase and momentum alignment, targeting clean liquidity resting above prior highs.

Consolidation Before the Next Big Move?The price is sitting close to a support level at $0.00001405, which has held strong lately. The Relative Strength Index (RSI) sits at 57, showing decent buying pressure but not overbought yet, while the 50-period moving average at $0.00001430 acts as a floor beneath the price. If SHIB breaks above $0.00001500 with confidence, it could climb toward $0.00001600. But if it falls below $0.00001405, the next stop might be $0.00001320.
What’s Driving SHIB Right NowOn the news front, Shiba Inu’s ecosystem is buzzing, especially with Shibarium, its layer-2 network, hitting over one billion transactions recently. Despite this milestone, SHIB’s price hasn’t taken off, likely due to a cooling crypto market and some investors cashing out after a May rally. Big players (whales) are stacking SHIB, with noticeable token inflows, and the burn rate is picking up, which could make SHIB rarer over time.

Lingrid | SHIBUSDT long OPPORTUNITY after PULLBACKThe price has perfectly fulfilled my previous forecast . BINANCE:SHIBUSDT saw a strong rally with an A-B-C structure and triangle breakout, leading to a fake breakout above the resistance zone. After the rejection at the red resistance line, the price pulled back to retest the ascending black trendline, which now aligns with the 0.00001382 level. A bounce here could push price back toward the 0.00001600 target if support holds.
📌 Key Levels
Support: 0.00001382
Intermediate Target: 0.00001600
Resistance: 0.00001727
⚠️ Risks
Breakdown below the trendline could retest 0.00001230
The blue downward trendline may act as short-term resistance
Weak volume could invalidate the breakout attempt
Traders, if you liked this idea or if you have your own opinion about it, write in the comments. I will be glad 👩💻

SHIB/USDTWe're seeing liquidity grabs followed by the start of a local bullish move.
Looking to enter long from the highlighted zone, but only if proper conditions and confirmations align.
🎯 Upside targets: 1765 – 1918 – 2496 points
