$SHIB TA by GrokAI
Here's a technical analysis of the SHIB/USDT hourly chart:
Price Movement: The price has been in an uptrend, moving from around 0.0000217 to 0.0000250. It's currently facing resistance near the 0.0000250 level, as indicated by the price action at this point.
Volume: Volume spikes are visible at key points, particularly during the upward movements, suggesting strong buying interest. However, volume tends to decrease during periods of consolidation, indicating less conviction in price movements during these times.
MACD: The MACD is currently showing a bearish crossover with the MACD line crossing below the signal line, which could indicate a potential weakening of the uptrend or the start of a correction. The histogram is also starting to show negative values, further supporting this bearish signal.
Support and Resistance Levels:
Support: Around 0.0000228, where the price has previously consolidated before moving higher.
Resistance: At 0.0000250, where the price has faced rejection multiple times.
Trend Analysis: The chart shows a series of higher highs and higher lows, indicative of a bullish trend. However, the recent price action near resistance suggests potential for consolidation or a minor pullback before possibly attempting to break through the resistance.
Potential Entry Points:
Breakout Strategy: If the price breaks above the 0.0000250 resistance level with strong volume, this could be a bullish signal for entering a long position, targeting the next resistance levels or Fibonacci extension levels.
Pullback Strategy: If there's a pullback from the resistance level, look for support around the 0.0000228 level or previous consolidation
SHIBUSDT trade ideas

Shib coin 1hr potterboxShib coin 1hr potterbox the coin comes up and over the top of the box and is dancing on the roof of the top box. It could be Consolidating maybe getting ready for a big move up or possibly a move down and fill up the empty space just to the left. We shall see

SHIB 24hr potterboxShib coin is following the rest of the pack and breaking out of the box. If I watched this closer I would know more but I just check Shib and hey it's going up.

Trading opportunity for SHIBUSDTBased on technical factors there is a Buy position in :
📊 SHIBUSDT
🔵 Buy Now
🪫Stop loss 0.00002245
🔋Target 0.00002390
📏 R/R 2
💸RISK : 1%
We hope it is profitable for you ❤️
Please support our activity with your likes👍 and comments📝

Long trade
15min TF overview
Buyside trade
Pair SHIBUSDT
Fri 3rd Jan 24
LND Session PM
3.45 pm (NY time)
Entry 0.000022737
Profit level 0.000024069 (5.86%)
Stop level 0.000022561 (0.77%)
RR 7.57
Reason: According to the Whykoff method - Phase D - trending inside the range indicative of a buyside trade.

Shiba Long For Today
During the active morning of Friday Jan 3rd, 2025, Forecasting shiba to be long this morning

SHIBUSDT.1DThe daily chart for Shiba Inu (SHIB) against Tether (USDT) depicts a dynamic and volatile pattern, marked by sharp rises and deep corrections. The chart features key technical indicators and levels that might determine future price actions.
Price Action and Trend:
Shiba Inu's price action has been highly volatile, showcasing significant swings that reflect its speculative nature and sensitivity to market sentiments. The price currently shows a potential recovery from a downturn, aiming for key resistance levels.
Key Technical Levels:
Resistance Levels (R1 and R2):
R1: 0.00003239 - Acts as an immediate barrier for any bullish momentum, potentially attracting sellers or profit-taking.
R2: 0.00004563 - A stronger and more psychologically significant level that could test the bulls' commitment should R1 be decisively broken.
Support Levels (S1 and S2):
S1: 0.00001035 - A crucial level that has historically provided support, suggesting potential buy interest if retested.
S2: A lower boundary not visible on the current chart but likely significant if the downtrend resumes.
Technical Indicators:
MACD: Currently flat with a minimal gap between the MACD line and the signal line, indicating a lack of strong momentum in either direction.
RSI: Near the 40 mark, which is slightly below the midpoint, suggesting a slight bearish bias but not yet in the oversold region.
Volume:
The volume appears subdued, consistent with a lack of decisive movement, indicating that traders are possibly waiting for more concrete signals before taking substantial positions.
Conclusion and Forecast:
SHIB/USDT is at a crucial juncture where it could either rebound off the support level at 0.00001035 or face further declines if sentiment worsens. The approach to R1 will be telling; a strong breakout above this level could prompt a move towards R2, while failure to overcome it may result in a retest of S1 or even lower levels.
Trading Strategy:
Bullish Scenario: Look for entry points if SHIB stabilizes or bounces off S1, with R1 as a short-term target. A stop-loss slightly below S1 can limit downside risk.
Bearish Scenario: If SHIB breaks below S1, it may indicate a continuation of the bearish trend, with lower historical supports in focus. Traders might consider short positions on failed attempts to rise above key resistance levels.
Summary:
Traders should monitor SHIB/USDT closely for signs of increased trading volume or a breakout from its current levels to gauge the direction of the next significant move. The market's response to these technical thresholds will provide valuable insights into the short-term trajectory of Shiba Inu.

SHIBUSDT 6DSHIB ~ 6D
#SHIB If you still have Conviction on this coin,. Buy gradually after retesting this support block, with a target of at least 20%+

How Shiba Inu Could Achieve More Gain in 2025Hello and greetings to all the crypto enthusiasts, ✌
In several of my previous analyses, I have accurately identified and hit all of the gain targets. In this analysis, I aim to provide you with a comprehensive overview of the future price potential for Shiba Inu , 📚🎇
The SHIB token has gained significant attention in recent years, especially during the peak of the bull market when its price surged dramatically. This rise was driven by a flood of investors and widespread media coverage, attracting substantial capital. As with most rapid growth phases, uncertainty soon followed, leaving much of the capital stagnant and unproductive. Despite its current lull, SHIB still holds potential for significant growth if fresh investment flows in. From experience, I've learned that markets, like life, ebb and flow, and understanding when to cut losses is essential for navigating both. In summary, SHIB is in a consolidation phase, but with renewed capital, a strong rally is still possible.
🧨 Our team's main opinion is : 🧨
SHIB experienced rapid growth fueled by investor hype and media coverage, but uncertainty has led to stagnation. Despite this, it still holds significant growth potential, and a new wave of investment could reignite its upward momentum.
Give me some energy !!
✨We invest countless hours researching opportunities and crafting valuable ideas. Your support means the world to us! If you have any questions, feel free to drop them in the comment box.
Cheers, Mad Whale. 🐋

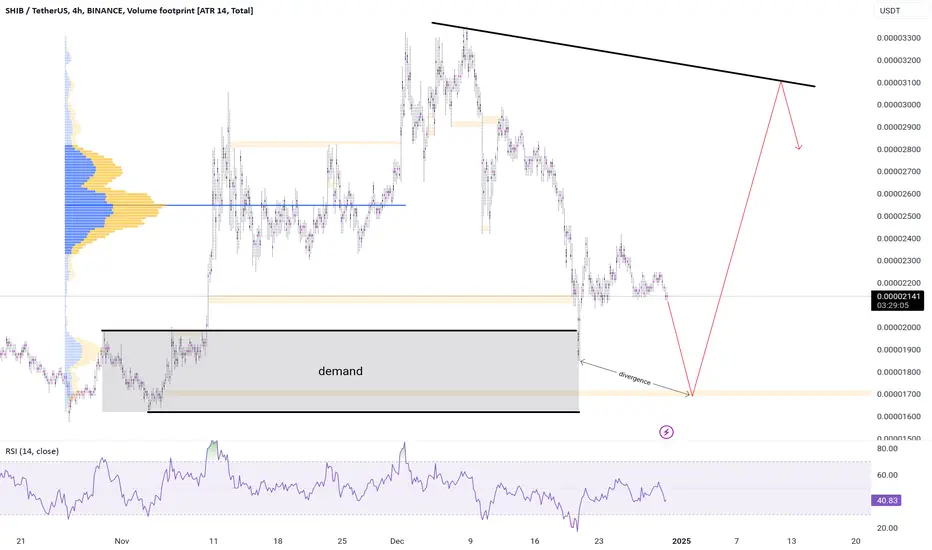
SHIBA last correction #SHIBA can make the last correction the market still has some stacked volume under the price if it corrects to this level there will be a divergence between price and RSI that can raise the market again
SHIBUSDT.1DThe daily chart for Shiba Inu (SHIB) against Tether (USDT) displays a fluctuating price pattern indicative of high volatility and speculative interest in the market.
Price Action and Trend:
SHIB's price action is characterized by significant spikes and troughs, suggesting a market driven by news events and trader sentiment. The chart shows a general uptrend marked by higher lows, but also indicates periods of rapid price increases followed by corrections.
Key Technical Levels:
Resistance Levels (R1, R2):
R1: $0.00003364 - A recent high that may act as a near-term barrier for bullish movements.
R2: $0.00004563 - The peak in the observed period, representing a strong psychological resistance level.
Support Levels (S1, S2):
S1: $0.00001963 - A key support level where the price has shown resilience, potentially a pivot point for reversals.
S2: $0.00001035 - The lowest recent point, which could see more sell-offs if broken.
Technical Indicators:
MACD: Currently in a bearish crossover, as the MACD line is under the signal line, indicating potential downward momentum.
RSI: At around 50, which suggests a neutral market condition, neither overbought nor oversold.
Volume and Market Sentiment:
The volume has been inconsistent, aligning with the volatility in price movements. High volume peaks coincide with price spikes, highlighting reactionary trading behaviors.
Conclusion and Forecast:
Given the current setup, SHIB/USDT shows potential for both upward and downward movements. The market sentiment appears cautiously optimistic but remains susceptible to shifts based on broader market sentiment or specific news related to the Shiba Inu ecosystem.
Trading Strategy:
Bullish Scenario: A sustained move above S1, particularly if volume supports an upward trend, could see SHIB testing R1 and potentially R2. Traders might consider buying near S1 with stops below this level to capitalize on potential rebounds.
Bearish Scenario: A break below S1 could accelerate losses toward S2. Traders could look at shorting SHIB on a break below S1, with R1 as a potential upper limit for stop-loss orders.
Summary:
SHIB/USDT traders should prepare for volatility and be ready to adjust positions based on sudden market moves. Monitoring volume and news related to Shiba Inu will be crucial in gauging the next significant price direction.

SHIBUSDTShibusdt is looking interesting on the Fib level of 50/61.80% areas and if you look properly to 2022 January 25 you will notice a strong demand on this point. I will be looking forward to buying after a bullish confirmation on D1 And D3. Not a financial advice.

Critical point For SHiba SHIBA Will face to Critical point which will shows us is it any Bullish pattern there or not?
if the price resist at pointed level and began new bullish trend then we will consider harmonic pattern

SHIB/USDT Analysis: SHIB is currently gaining momentum within a long-term symmetrical triangle pattern. This consolidation phase suggests a potential breakout, and if SHIB stays above key support levels and bounces off strongly, it could retest its all-time high.
SHIB is close to the apex of the triangle, a crucial point where a decisive move is expected.
Strong upward momentum could target higher levels.
Immediate support is near 0.00002150.
Critical support at 0.00001090 is marked by the dashed red line. It is crucial to stay above this level for bullish continuation.
First Target: 0.00003000
Second Target: 0.00005000
Based on sustained momentum, potentially a retest of levels near 0.00009000.
The symmetrical triangle signals a period of indecision, but a breakout could lead to substantial profits.
Monitor volume closely to confirm the strength of the breakout, while also keeping an eye on key levels for invalidation.
If the bullish momentum sustains, SHIB has a strong chance of retesting its ATH in the upcoming rally.
DYOR, NFA
@Peter_CSAdmin

SHIB/USDT Chart Analysis #Shiba Inu ( CRYPTOCAP:SHIB ) / USDT Technical Analysis
Shiba Inu (#SHIB) is currently trading at 0.00002186, showing signs of strength as it holds above a key uptrend line. The price has strong support near the Fibonacci 0.618 level, which could act as a base for a bullish rebound toward higher targets.
Key Levels:
Support Zone: 0.00002139 - 0.00001939 (Fibonacci 0.618 - 0.786 levels).
Target 1 (T1): 0.00002715 (Initial goal).
Target 2 (T2): 0.00003083 (Intermediate resistance).
Target 3 (T3): 0.00003511 (Major resistance).

SHIBUSDT.1DThis analysis explores the daily chart of Shiba Inu against Tether (USDT) on the Binance exchange, focusing on its recent price activity and potential future trends.
Price Action and Trend:
Shiba Inu has exhibited a sideways trading pattern over the last few months, marked by several peaks and troughs within a defined range. This consolidation reflects uncertainty in the market sentiment, indicating indecision among traders.
Key Technical Levels:
Resistance Levels (R1, R2):
R1: $0.00003364 - This level has served as a tough barrier for price advances in the recent past.
R2: $0.00004563 - A break above R1 could expose this higher resistance, which has historical significance from previous peaks.
Support Levels (S1, S2):
S1: $0.00001963 - This level has consistently provided support, preventing further declines during sell-offs.
S2: $0.00001035 - Should S1 fail, S2 is the next crucial level, which could act as a potential floor for price.
Technical Indicators:
MACD: The MACD line is below the signal line, indicating bearish momentum. However, the proximity of the lines suggests that the negative momentum is waning.
RSI: The RSI stands at around 40, which is closer to the oversold territory but still neutral, hinting that there might be some room for downward movement before the asset becomes technically oversold.
Volume and Market Sentiment:
The trading volume has not shown significant spikes, which corroborates the ongoing price consolidation without clear directional bias.
Conclusion and Forecast:
The current market structure of SHIB/USDT points towards continued consolidation within the identified levels until a significant catalyst or volume influx can provide a clearer direction. The proximity to support at S1 suggests a cautious approach; if this level holds, we might see attempts to test R1 again.
Trading Strategy:
Bullish Scenario: Should the price bounce off S1 with increasing volume, a long position aiming for R1, with a stop loss below S1, could be considered.
Bearish Scenario: A breakdown below S1, particularly on high volume, might open positions targeting S2, setting a stop loss just above S1 to mitigate risks.
Summary:
SHIB/USDT is currently in a phase of consolidation, with key support and resistance levels clearly defined. Traders should monitor these levels closely for potential breakouts or breakdowns, which will dictate the medium-term price direction. The technical indicators suggest a bearish bias, but the situation remains fluid, and shifts in broader market sentiment or fundamental developments specific to Shiba Inu could heavily influence future movements.

SHIB/USDT: The Cup & Handle Setup That Could Spark a RallyShiba Inu (SHIB) is showing a textbook Cup and Handle Pattern on the daily chart, a bullish continuation structure signaling the potential for a significant breakout. Currently trading around $0.00002216, SHIB seems poised for a dramatic move higher as it approaches the handle's resistance.
Key Pattern Insights:
Cup Formation:
The rounded base indicates a prolonged accumulation phase, signaling a shift from a bearish sentiment to a neutral or bullish outlook.
SHIB retraced steadily, forming higher lows and maintaining strong support around the $0.00001700-$0.00001900 range.
Handle Development:
The price is consolidating in a descending channel, forming the classic "handle" portion of the pattern.
This consolidation is a healthy retracement, allowing bulls to recharge before attempting a breakout.
Breakout Target:
Upon breaking the neckline resistance at $0.00002500, the Cup and Handle's projection targets $0.00004400, nearly doubling the current price.
The measured move aligns with the height of the cup added to the breakout point.
Support and Resistance Levels:
Immediate Support: $0.00002100 remains critical for the handle's continuation. A failure to hold this level could delay the breakout but does not invalidate the bullish structure.
Key Resistance: $0.00002500 acts as the neckline. A confirmed daily close above this level will ignite the next leg higher.
Momentum and Volume:
The volume profile confirms increasing interest during the cup's formation, with a slight tapering during the handle—a pattern characteristic of strong setups.
Momentum indicators suggest room for growth, further supporting the bullish outlook.
Potential Scenarios:
Bullish Breakout: A decisive breakout above $0.00002500 opens the door for SHIB to rally toward $0.00004400, completing the Cup and Handle formation.
Pullback and Retest: A brief retest of the $0.00002100 support zone before resuming upward momentum would create an ideal entry opportunity for bulls.

Shib New Peak ComingSoon...Soon the movement of conquering the new peak will begin, after the market is saturated in Bitcoin, all the money will enter Shiba for more profit.

long like kingkongthis inverse head and shoulder pattern looks like has a good rrr but this 1 is wkly if you cant hold for wks or month look for short tf have a nice trade everyone please comment your suggestions thanks

shib long position!buy area (0.00001745-0.00001551)
tp1 (0.00003339)-(92%)
tp2 (0.00004566)-(163%)
tp3 (0.00005816)-(235%)

SHIB 4x Soon?Shiba inu looks good to buy spot under $0.00002, Structure is bullish but it's not time to buy right now. We wait for a dump.

SHIBA TARGETS!The support level of 0.000022 could be the best time to buy Shiba.
The recent correction of Bitcoin could be a good entry opportunity for the remaining altcoins.
COINEX:SHIBUSDT Shiba is one of these coins with very high targets.
The main growth of Shiba will start with the break of 0.00004.
Don’t forget to follow and boost

#SHIBUSDT (support band )a strong supportzone are seen.
If a time reaches this range, we will closely monitor its movements.
