SHIB to moon following TRUMPType: Crypto
Ticker: SHIBUSD
Execution metrics:
* Entry: $0.00002581
* TP: $0.00008746
* SL: $0.00001483
Support:
* Technical Justification: Leaving demand. Closing higher. Engulfing.
* Fundamental Justification: Bullish office for crypto following elections, BTC ATH
Disclaimer: We are not a brokerage or investment firm. We do not offer financial advice or investment advice and/or signals. This is not certified financial education. We offer access to the daily thought process of an individual and his experiences.
SHIBUST trade ideas

SHIBUSDT heavy pump ahead As we said before we are seeing high potential possibility of pump and rise here and soon that can start and it is already started but soon high volume with rise will lead market here and hit our targets mentioned on the chart.
DISCLAIMER: ((trade based on your own decision))
<

SHIBUSDT wait for huge pump soon price above 0.00003$As we said before we are looking for high potential pump here like the green arrows on chart.
also major daily supports and resistances are all mentioned on the chart too.
DISCLAIMER: ((trade based on your own decision))
<

SHIBA Comeback New Highs soon! Shiba Inu, the meme coin that took the world by storm, is showing signs of re-igniting its fiery spirit. After a period of consolidation, the Shiba Inu community is buzzing with renewed optimism, fueled by its expanding ecosystem and growing adoption. With the launch of Shibarium, its Layer-2 scaling solution, and the rising interest in meme coins, Shiba Inu is poised to break out of its current price range and potentially reach new heights in 2025. The future of Shiba Inu is looking brighter than ever, and with its dedicated community and innovative developments, it's ready to unleash its full potential.

SHIB/USDTPLEASE TRADE AT YOUR OWN RISK reason 15 min ob respect with 4 hour zone and for upper lqd zone tare at your own risk

SHIBUSDT A piece of trash with rising potencialThis piece of garbage has the potential upto the target i've shown
and i say potential i'm not saying it's getting there
Jesus Christ how do u people buy these things !!!
i rather buy goat's poo and sleep on it than this piece of dog vommit

$SHIBUSDT ready to fly 50%Im expecting 50% gain on Shib. Elliot waves entry and exit pricess on the chart. do not miss this trade

New Pattern on the 15 min TF for SHIBGreat job to SHIB Holders and the bulls.
Now keep an eye on the new consolidation pattern on the 15 min TF, watch out for break out and volume in either direction.
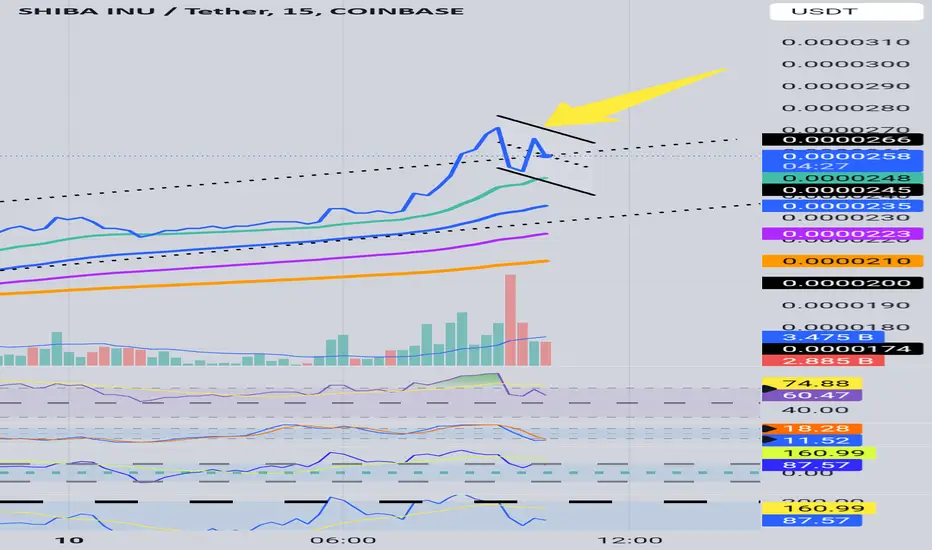

SHIB 15 minHere we have the puppy of the hour. Breaking through resistances and trying to reach old highs. Here we have SHIB on the 15 min chart on and upward parallel channel, will it see a pull back in few hours or will it break out the structure and make new highs?
Positives- Green candles over the 21 and 50 and 100 EMA in upward parallel channel on 15 min chart.
Weekly cup and handle forming.
Caution- RSI and SRSI flashing overbought, pullback could possibly come in a few hours?

SHIB/USDT: Bullish Inverse Head and Shoulders Pattern Breakouthello guys.
Pattern Formation: The inverse head and shoulders pattern, with a well-defined neckline, indicates a bullish reversal signal.
Breakout Confirmation: Price has broken above the neckline, a key resistance level, which suggests a continuation toward higher targets.
Price Targets: If the bullish momentum holds, the next major resistance is around $0.00003700, with the potential to reach $0.00005700.
Risk: Failure to maintain above the neckline could result in a pullback, potentially re-testing lower levels before any further bullish movement.

Shiba Inu (SHIB)Shiba needs no introduction, a so-called quick-become millionaire meme coin that many still believe in. Anyway, SHIB has been oscillating in a sideway channel. Currently, price is at the bottom of this channel and posed to break the minor downtrend line. Let's see what happens.

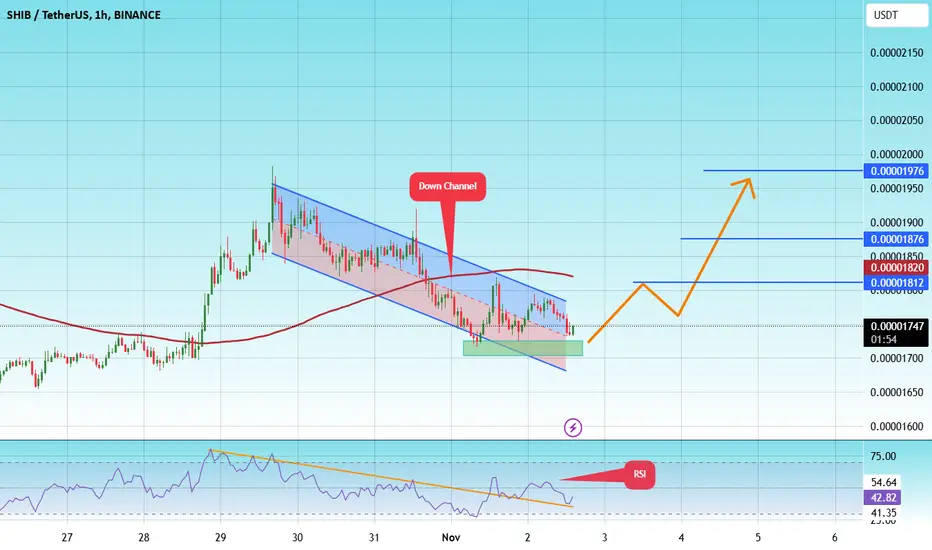
#SHIB/USDT#SHIB
The price is moving in a descending channel on the 1-hour frame upwards and is expected to continue.
We have a trend to stabilize above the moving average 100 again.
We have a downtrend on the RSI indicator that supports the rise by breaking it upwards.
We have a support area at the lower limit of the channel at a price of
0.00001721
Entry price 0.00001742
First target 0.00001812
Second target 0.00001876
Third target 0.00001976
Are you ready ???? #SHIBA#shiba is ready for takeof
The time has come for Shiba to start its flight, after the explosive price of Dogecoin, now it is Shiba's turn to change the trend and become bullish by breaking the downward trend line.

#SHIBUSDT (repeat ?? )Will history repeat itself?
I have a positive opinion
The previous 700% growth may be repeated on a smaller scale if
the red resistance ahead is broken
So wait and watch

SHIBUSDT.1DAs I analyze the SHIB/USDT daily chart, several key levels and indicators highlight potential price movements. Starting with support and resistance zones, I’ve identified two major resistance levels: R1 at 0.00002196 and R2 at 0.00002817. Additionally, two significant support zones exist, with S1 at 0.00001544 and S2 at 0.00001121. These levels form the boundaries of a potential price channel, giving a framework for likely price oscillations in the short to mid-term.
Currently, SHIB is trading near 0.00001903, positioned between R1 and S1, indicating a zone of consolidation. This range-bound activity could suggest accumulation, as the asset builds momentum for its next significant move. Notably, a break above R1 could act as a bullish trigger, with a potential target around R2. Conversely, a break below S1 may suggest bearish pressure, with a possible decline toward S2.
The MACD (12, 26) indicator, displayed at the bottom of the chart, also provides valuable insights. At present, the MACD line is moving close to the signal line, which can indicate an upcoming shift in momentum. If the MACD crosses above the signal line with increased histogram bars, this would strengthen the case for a bullish breakout towards R1 and potentially higher.
Considering these elements, my overall bias is cautiously optimistic. I anticipate that SHIB could see a bullish continuation if it maintains support above 0.00001544, with the initial target at R1. However, if SHIB fails to hold this support, it would be wise to reconsider the position, as a bearish trend might resume towards the lower support level at S2.
In conclusion, my analysis suggests a balanced approach, watching closely for confirmations at key levels. A breakout above R1 with strong volume could signal the beginning of an uptrend, while any weakness around S1 would prompt a reassessment. For now, I remain patient, awaiting a clear signal to validate the direction of the next major price movement.

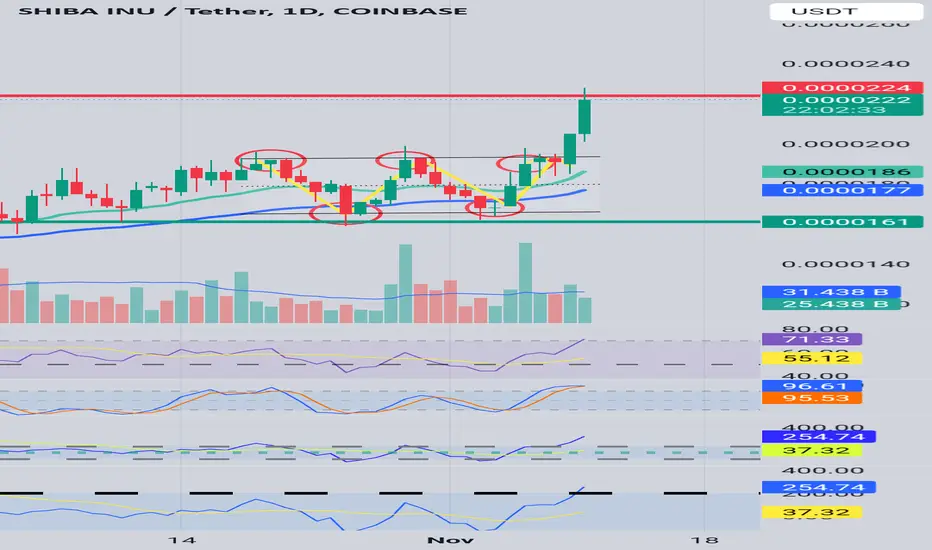
What's nextIs the double bottom formation complete even though the day chart candle did not print yet? there is a possibility of a slight pull back, a correction? hypothesizing because of the double bottom and the successful and blessed positive move after that.
Positives- weekly candle is above the 50 EMA
Day candle currently over 21 and 50 EMA
Weekly Chart has cup and handle forming
Negatives- SRSI and RSI and CCI on day chart both indicate asset is overbought. Very close to a key level possible resistance.
Buy Trade for SHIB: Harnessing Meme Power and Ecosystem Growth**Description**:
This trading idea centers on **SHIB** (Shiba Inu), a cryptocurrency initially created as a meme token but has since evolved into a multifaceted ecosystem. SHIB has gained massive popularity, thanks to its large and active community, which drives its adoption and market value. The Shiba Inu ecosystem now extends beyond just a token, with features like ShibaSwap (a decentralized exchange), NFT projects, and the development of its own metaverse initiative, adding value and utility to its ecosystem. SHIB's strong community support and ongoing developments indicate long-term potential in an increasingly competitive crypto market.
However, it is important to recognize that the market for meme and community-driven tokens like SHIB is highly volatile and can be heavily influenced by shifts in sentiment, social media trends, and regulatory developments. As a result, trading in SHIB requires careful consideration of market dynamics and a disciplined approach to risk management.
**Disclaimer**:
This trading idea is provided for educational purposes only and should not be considered financial advice. Cryptocurrencies, including SHIB, are highly speculative and involve substantial risk, including the possibility of losing your entire investment. Always conduct thorough research, assess your financial position, and consult with a financial advisor before making investment decisions. Past performance is not indicative of future results.

SHIB/USDT PLEASE TRADE AT YOUR OWN RISK
reason 15 min ob respect with 4 hour zone and for upper lqd zone tare at your own risk

Shiba Inu Update: Bearish, New Entry PossibleI am using the same chart as before with the same drawings, the same trading range.
Notice that SHIBUSDT (Shiba Inu) produced a lower high recently and continues bearish. Our leverage SHORT is active with two targets hit and now a new entry is possible.
There was a small bounce, three days green, and this is repeating all across the market. This is due to the positive US elections results. The excitement is dying out though and the market is about to resume the main trend in which it has been moving for most of the year.
A lower low is possible and we wait patiently for the chart/market to unravel.
If prices move and close above the upper boundary of the trading range, bullish potential becomes active. As long as the trading is happening within the channel, the potential remains bearish.
I will do an update for PEPEUSDT tomorrow when my publishing slots open, I belief I reached the limit for today.
Thank you for reading.
Namaste.

SHIBA USDT DAILY According to the range specified in the specified box, good targets can be predicted for the short term. The targets are specified

Is SHIB (Shiba Inu) the Next Big Player in the 2024 Bull Market?
Shiba Inu (SHIB), the popular meme coin, has been making significant strides in the cryptocurrency market. While it may not be as widely recognized as Bitcoin or Ethereum, SHIB has garnered a dedicated following and has shown remarkable resilience. As the 2024 bull market unfolds, several signs suggest that SHIB could emerge as a dominant force, potentially triggering a 90% price surge.
1. Strong Community and Social Media Presence:
One of the most significant factors driving SHIB's potential is its passionate and active community. The SHIB Army, as they are known, has been instrumental in promoting the coin and generating significant buzz on social media platforms. This strong community support has helped SHIB maintain its relevance and attract new investors.
2. Technical Analysis and Chart Fractals:
Technical analysis provides valuable insights into potential price movements. Chart fractals, which are recurring patterns in price charts, can be used to identify potential future price trends. Recent analysis of SHIB's chart suggests that the coin may be forming a bullish pattern, similar to historical patterns that preceded significant price surges.
3. Layer-2 Solutions and Ecosystem Expansion:
Shiba Inu has been actively exploring Layer-2 solutions to enhance its scalability and transaction speed. By leveraging these technologies, SHIB can address the limitations of its underlying blockchain and attract a wider range of users and developers. Additionally, the expansion of the Shiba Inu ecosystem, including the development of new projects and partnerships, can further fuel its growth.
Potential Challenges and Risks:
While the future of SHIB appears promising, it is essential to acknowledge potential challenges and risks:
• Market Volatility: The cryptocurrency market is inherently volatile, and sudden price swings can occur without warning. Investors should be prepared for potential price fluctuations.
• Regulatory Uncertainty: The regulatory landscape for cryptocurrencies remains uncertain, and any unfavorable regulatory developments could negatively impact the price of SHIB.
• Competition: The meme coin market is highly competitive, and the emergence of new and innovative projects could divert investor attention away from SHIB.
Conclusion:
Shiba Inu's strong community, promising technical analysis, and ongoing development efforts position it as a potential breakout candidate in the 2024 bull market. However, investors should approach SHIB with caution and conduct thorough research before making any investment decisions. By understanding the risks and rewards, investors can make informed choices and maximize their potential returns.
Disclaimer: This article is for informational purposes only and should not be construed as financial advice. It is important to conduct thorough research and consult with a financial advisor before making any investment decisions.

SHIBUSDT / 4h / LongI think SHIB in next weeks can reach higher levels and soon we are expecting our target which is 0.00002220 $ to be hit
