SHIB 0.0000135 waving at your faceA monthly level, logarithmic 1:1, VAL lines up to the level!
A possible good long entry for a rotation!
SHIBUST trade ideas

SHIB/USDT today SHIB/USDT is in a downward channel. The price may face resistance at 0.00001739 and is likely to continue falling towards 0.00001640.
Strategy:
Sell near 0.00001739, targeting 0.00001640.
Stop Loss above the channel to minimize risk if it breaks out.
Keep an eye on the channel for any potential reversal!

SHIBUSDT.1DExamining the daily SHIB/USDT chart, it's evident that Shiba Inu has faced significant volatility, following a declining trend that has recently started to show signs of a potential reversal. The chart exhibits a sequence of resistance and support levels that have dictated price movements over the recent months.
Currently, SHIB is trading at $0.00001176, finding immediate resistance at $0.00001610 (R1), with a subsequent higher resistance at $0.00002035 (R2). There is also a long-term declining trend line, marked as R3, which could act as a crucial barrier if SHIB continues to ascend. On the downside, the support level is established at $0.00001098 (S1), with the price having shown resilience around this mark.
The Stochastic RSI indicator is trending upwards from the oversold territory at 15.90, suggesting a possible increase in buying momentum which might aid in pushing the price towards R1. Conversely, the MACD is currently below the signal line, which typically suggests bearish momentum; however, the histogram is showing a reduction in negative momentum, indicating that the bearish pressure may be waning.
From my analysis, if SHIB maintains its stance above the current support at S1 and continues to attract buying interest, there's potential for it to test the immediate resistance at R1. A strong break above this level could see SHIB aiming for R2, facilitated by increased trading volume and positive market sentiment. Nevertheless, traders should be vigilant of the broader market conditions and news that could impact SHIB's price, particularly due to its high volatility and susceptibility to market sentiment changes.
In conclusion, for those considering trading SHIB, it would be prudent to place stop-loss orders just below the S1 level to manage risk effectively. Furthermore, keeping an eye on the MACD and Stochastic RSI for continued signs of bullish momentum will be key in determining the strength of the current recovery.

SHIBUSDT View!!Based on on-chain data showing an increase in whale activity, Shiba Inu looks to be close to a possible recovery. More than three trillion tokens were transferred through major transactions on SHIB in the last day, which represents a notable increase in volume. Whale activity spikes like this one are unusual because they frequently occur before big changes in market prices.
The increase in significant transaction volume may indicate that whales, or large holders, of SHIB are getting ready for a possible price reversal despite their recent relative quiet. There is evidence that major players are beginning to accumulate again, as seen by the 165 large transactions that were recorded in the last day with a total volume of 3.02 trillion SHIB.
SHIBUSDT
Chart by TradingView

shibusdt → a short positionhello guys!
I suppose Shiba hunted the last level!
it is a risky position but I will sit on the short position for this situation!
___________________________
✓✓✓ Always do your research.
❒❒❒ If you have any questions, you can write them in the comments below, and I will answer them.
❤︎ ❤︎ ❤︎And please don't forget to support this idea with your likes and

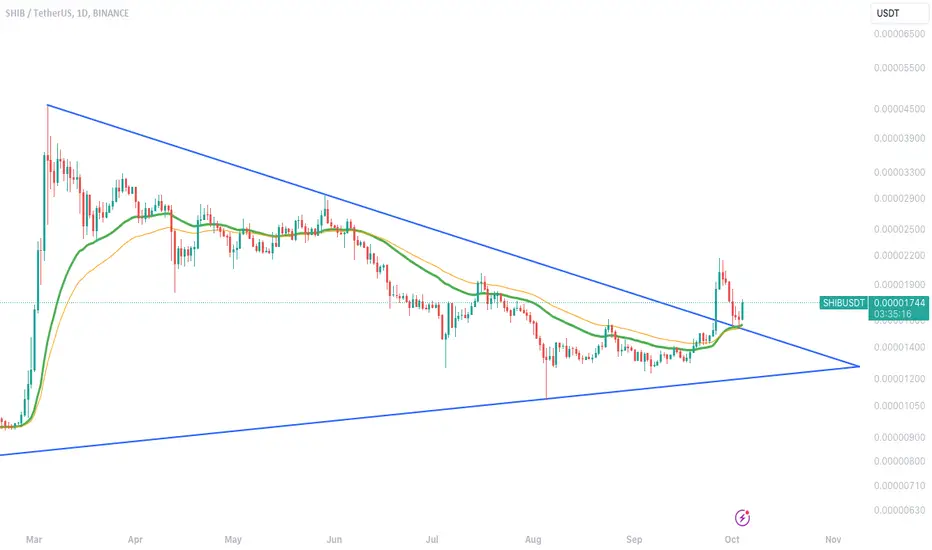
SHIBUSDT potential test of Down Trend Resistance lineSHIBUSDT is currently in an accumulation phase, with the price oscillating around the 0.000015 level. The market has bounced off this support level twice before initiating an upward impulse move. The most recent swing upward was stronger than the previous one, signaling a potential increase in bullish momentum. Growing expectations of a possible bull run could act as a trigger for further upward movement. The market continues to bounce off the upward trendline, forming higher lows, which indicates buying pressure. Based on this analysis, the price could retest the channel border, potentially leading to further bullish momentum. The target is the resistance zone at 0.00002.

Lingrid | SHIBUSDT accumulation for BULLISH times AheadBINANCE:SHIBUSDT is currently in an accumulation phase, with the price oscillating around the 0.000015 level. The market has bounced off this support level twice before making an upward impulse move. The most recent swing upward was stronger than the previous one, indicating that the price may be gaining bullish momentum. Additionally, there is a growing expectation of a potential bull run, which could serve as a trigger for further upward movement. The market continues to bounce off the upward trendline, suggesting that price action is forming higher lows, a sign of buying pressure. Based on this analysis, I expect the price to test the channel border again, potentially leading to further bullish momentum. My targe is resistance zone at 0.00002
Traders, if you liked this idea or if you have your own opinion about it, write in the comments. I will be glad 👩💻

In the 4-hour periodIn the 4-hour period, it will most likely hit its previous ceiling
BITFINEX:SHIBBTC BINANCE:SHIBUSDT

SHIBUSDT: Break out, retest and confirmation!!Join our community and start your crypto journey today for:
In-depth market analysis
Accurate trade setups
Early access to trending altcoins
Life-changing profit potential
Let's analyse SHIBUSDT both fundamentally and technically.
FUNDAMENTAL ANALYSIS:
Shiba Inu (SHIB) is a meme-based cryptocurrency launched in 2020, inspired by the Shiba Inu dog breed. It operates on the Ethereum blockchain and aims to build a decentralized community. Originally created as a playful experiment, it has gained popularity and features like ShibaSwap, a decentralized exchange. Despite its lighthearted roots, SHIB has attracted significant investment and speculation.
TECHNICAL ANALYSIS:
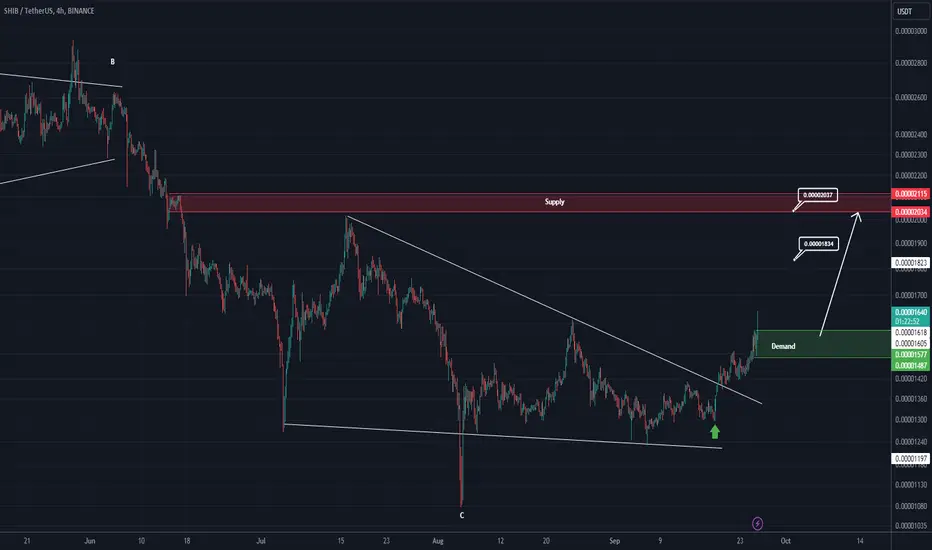
SHIBUSDT has demonstrated a bullish breakout from a descending triangle pattern, followed by a successful retest and a confirmatory candle. The price is currently supported by the 50-day Moving Average (MA).
A significant price increase is anticipated, as indicated by the substantial surge in Shiba Inu's trading volume within the last 24 hours, reaching $510.90 million. This surge suggests increased activity by Whales.
Entry Zone:
CMP to $0.00001567
Targets level:
Expecting 200% to 300% move
If you find this analysis helpful, please hit the like button to support my content! Share your thoughts in the comments and feel free to request any specific chart analysis you’d like to see.
Happy Trading!!
SHIBUSDT after more range +100% pump ahead As we cam see price is now near major daily supports and we are looking for heavy pump here once again like past like green arrows on chart.
first target is at least +100% pump also major supports and resistances mentioned on the chart.
DISCLAIMER: ((trade based on your own decision))
<

resistance from 2021 flipped to support in 2024 :)boost and follow for more ❤️🔥 I'm seeing a major trend from 2021 flip to support here on the latest dip, maybe a bit more consolidation down here but a end of year rally is likely and all my targets hitting early 2025 is the most likely scenario 🤔
ill post some more shib updates in the near future, see y'all soon ⚡

SHIB/USDT Trading Scenario UpdateAfter a significant increase in February and reaching a local maximum of $0.00004575, the price declined to the $0.00001080 mark, which represented a drop of over 76%. As a result of this decline, the quote nearly reached the POC volume level at $0.00001032.
Near this level, a rebound was observed, followed by an attempt at recovery. From the perspective of Fibonacci levels, the current asset price is within a favorable range for purchases (between 1 and 0.75).
In this range, medium-term purchases can be considered with a target price of $0.00002746, which corresponds to the 0.5 Fibonacci level.

Shiba Long-Term Bull-Market Accumulation Zone To Become ActiveAs we get closer and closer to 2025, the Altcoins market is preparing to enter the last accumulation phase of 2024. This will be the last chance to buy at low prices before the major 2025 bull-market.
The accumulation phase should last several months, so there will be time. The current bearish action we are seeing across the market goes in accordance with the trade-ideas we shared in early August, the "Pre 2025 Bull-Market" series. This series predicted one final drop where our favorite Altcoins enter an accumulation zone before major growth.
We talked about the buy and hold strategy and went deep into trading methods, the basics, market psychology and more. You can find these articles by going to my profile and going back to early August.
It seems this is actually happen. And if this comes to pass then we can have more certainty that also 2025 will come to pass, because everything is going as planned.
Shiba Inu (SHIBUSDT) produced a small rise, nothing surprising, just three weeks green. Some Altcoins took this time to grow super strong, others remained asleep. That's what I mean when I say that not everything will move. Everything moves but not with the same force, strength and magnitude.
Some will grow stronger than others and some will definitely remain blank in 2025. Shiba Inu will grow in 2025 so all is fine.
So the drop should last a few weeks. The recovery should last several months and in 2025 we get long-term sustained growth.
This is a general view of the chart and market. We cannot be hurt by something we know is going to happen. If we know it is going to crash in advance, we can prepare and adapt. We can only be hurt by price action if we are caught by surprise. No surprise here, we are well aware.
➖ If we have experience, we can sell and buy back lower.
➖ If we are beginners, we can simply hold because the whole process will only last a few months.
Whatever you do is up to you. My job is to alert of the event before it happens and you can use this information in the best way you can.
Thanks a lot for your continued support.
Namaste.

SHIBA. USDTIn my opinion, this point can be supported.
If Shiba decides to come back.
But it should be noted that the Shiba cryptocurrency has the potential to continue correction in the daily time frame.

SHIB PriceA falling channel breakout was spotted on the daily charts, and the memecoin retested the breakout region yesterday. The ongoing structure gives an idea about the bull rally ahead.

Shiba In (SHIB) shows bullish head and shoulders patternSHIB, the second-largest coin, plunged over 8% during Monday’s U.S. market trading hours. The sharp plunge can be attributed to Bitcoin drop below $65,000, with an intraday loss of 3%. With the meme cryptocurrency sector often volatile to new market changes, the Shiba Inu price hints at a potential retest to $x. support. Will the uptober rally sentiment trigger a major reversal?
Since last weekend, the Shiba Inu price witnessed a notable correction from $0.0000217 to $0.0000178, accounting for an 18% drop. The bearish turnaround likely coincides with the broader market pullback as Bitcoin drops below $65,000 on Monday. With sustained selling, the SHIB price could tumble another 9% before retesting suitable support at $0.000016.
The aforementioned level, coinciding with a bullish crossover of 20-and-100-day exponential moving average after 100 days, could recuperate the bullish momentum. The potential reversal will likely reveal a bullish reversal pattern called Inverted Head and Shoulder in daily charts.
The chart setup consists of three lows, where the middle low (the “head”) is the lowest, and the two outer lows (the “shoulders”) are slightly higher. If the pattern holds true, the Shiba Inu price could rebound from $0.000016 and rechallenge the neckline resistance at $0.000022.
On the contrary, if sellers drive a breakdown below the $0.000016 level, the buyers would also lose EMAs support and invalidate the bullish thesis.

Unlocking Potential: Guide to Buying SHIBUSDT on SpotIn this detailed guide, explore the intricacies of buying ShibUSDT on the spot market. We'll cover the essential strategies for timing your purchases, managing risks, and understanding market signals. As Shiba Inu continues to gain traction in the crypto community, this guide will help you navigate the volatility and make informed decisions. Whether you're looking to diversify your portfolio or ride the wave of Shiba Inu's popularity, this guide provides the tools to optimize your spot trading experience.

SHIB Is BullishFrom where we put the green arrow on the chart, it looks like a big bullish triangle is over.
By maintaining the green range, it can move towards the targets.
The targets are marked on the chart.
Closing a daily candle below the invalidation level will violate the analysis
For risk management, please don't forget stop loss and capital management
When we reach the first target, save some profit and then change the stop to entry
Comment if you have any questions
Thank You
shibahello everyone
Shiba either returns to the bottom of the channel and adds a zero, or breaks and stabilizes the channel ceiling and reaches the next target.
What do you think?

#SHIB time is coming? Looking at meme charts, shib have to be one of the best at entry, though already high mcap only time will tell if it will go above the last ath
here's a better look at dex chart

SHIB Major Trend. 09 2024Logarithm. Time frame 1 week.
Line chart , without market noise.
Secondary trend. Channel Zone.

SHIB/USDT Secondary trend. Channel. 14 months accumulation.Logarithm. Time frame 1 week for clarity of the channel range. 3 weeks ago, there was an exit of the price under the support of the accumulation channel by a large percentage. Many long positions were liquidated.
The chart shows the percentages from this reversal zone to the channel resistance, as well as the average profit percentage when exiting this accumulation channel from the average set price to the significant first resistance.
This is what the chart of this cryptocurrency looks like on a line chart without the “market noise” volatility.
Accumulation Zone. Pump/Dump and compliance with risk and money management.
Remember, this is a pamp/dump meme cryptocurrency, which even at -93% down from peak pumping and with a set zone of about 14 months (!) is at an inadequate profit. That's why follow risk management in your work.
It is more rational to work on such cryptocurrencies, not with stops (high volatility, slippage at high %, high probability of beaten out before price increase, the large value of stop is meaningless, they can beat out at -2% and -40%), and work from average buy/sell price (only spot!) with reasonable observance of money management.

SHIB ANALYSIS (update)🔮 #SHIB Analysis - Update 🚀🚀
💲 As we said earlier #SHIB performed the same. More than 40% move already done in #SHIB Now we can see a little retest from its major resistance zone and after that a bullish move would be seen
💸Current Price -- $0.00002127
📈Target Price -- $0.00002747
⁉️ What to do?
- We have marked crucial levels in the chart . We can trade according to the chart and make some profits. 🚀💸
#SHIB #Cryptocurrency #Breakout #DYOR
