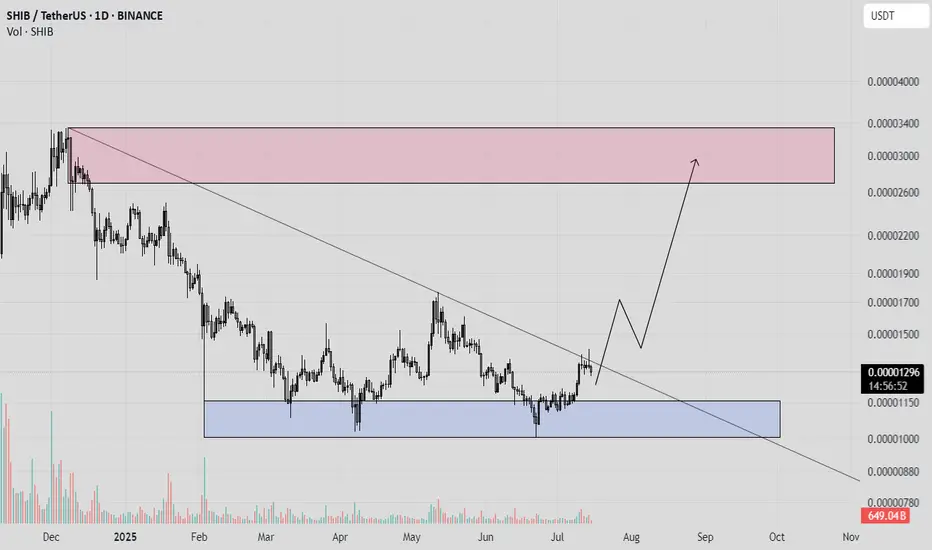
Shiba Inu (SHIB): Looking For Breakout | Do Not Miss It...Do not miss the breakout that we might see about to happen. We are looking for a breakout on SHIB coin where once we get that breakout from the zone of accumulation (sideways channel), we are going to look for further movement to upper target zones from there!
Swallow Academy
SHIBUST trade ideas

SHIBSHIBA INU
Shiba Inu is a meme token inspired by Dogecoin but aimed to take the concept further by emphasizing community involvement.
Everything is clear on the chart.
I wish everyone abundant profits.
Like and follow
for more.
SHIBA INU Heist Plan | Layered Buy Limits + SL Strategy🏴☠️💸**SHIBA INU Heist Blueprint: Rob the Bulls, Outsmart the Bears | Thief Trading Style Strategy (Swing/Scalp)**💸🏴☠️
🌍Hola! Hello! Marhaba! Bonjour! Ola! Hallo!🌍
💰Calling All Market Pirates, Profit Seekers, and Silent Thieves... the vault is open!💰
This is a special market mission for SHIB/USD (SHIBA INU), based on the notorious "Thief Trading Style" — a method designed to sneak in, grab profits, and vanish with style. 💼✨
🧠Backed by a spicy combo of technical, fundamental, on-chain, and sentiment analysis, this strategy is crafted for both swing and day traders ready to infiltrate volatile zones and escape with gains.
🎯The Robbery Plan:
We're targeting a high-risk, high-reward breakout with our eyes on the ATR police trap zone, where market makers often lure and trap traders. Our focus? The sweet spot where consolidation ends, fakeouts begin, and true reversals take off. ⚠️🐍
📥ENTRY (The Break-in):
"The Vault is Unlocked!"
Sneak in using buy limit orders at swing lows or support zones—opt for the 15m or 30m chart to catch pullbacks.
We're stacking orders like a professional thief using DCA (Layering Method) to reduce entry risk. 📊💼
🔎 Entry Zone: Market or limit entries near structure lows—be precise, not greedy.
🛑STOP LOSS (Escape Hatch):
Use the 2H swing low around 0.00001150 as your escape signal.
Risk management is your armor: adjust SL based on your lot size, order count, and trade exposure.
🔒Thief Tip: Never trade without your getaway plan!
📈TARGET (The Safe Zone):
🎯 Primary Target: 0.00001290
Optional: Use trailing SL and scale out profits as the robbery gets hotter.
Scalpers—only join the long side of the heist! If you're packing a big bag of capital, jump in earlier; if not, ride with the swing team. 🚁💸
📊THIEF FUNDAMENTAL FUEL:
SHIB bullish momentum is rising due to macro sentiment shifts, market rotation, whale accumulation, and on-chain volume flow.
Check related macro reports, intermarket insights, and crypto futures data before loading your bags. 🧠📈🔗
🛎️HEIST WARNINGS – Stay Safe!:
🚨 During major news releases, volatility can explode. Don’t get caught!
❌ Avoid fresh entries during news
✅ Use trailing stops to lock gains on existing positions
💖LOVE THIS PLAN? SUPPORT THE CREW:
💥Smash that Boost button💥 to keep the Thief Trading Crew alive and plotting!
We drop fresh heist plans regularly—help us spread the love, grow the crew, and keep stealing profits from the noise. 🚀
📌Disclaimer: This analysis is for educational purposes only—not financial advice. Always DYOR and adjust based on your personal risk profile.
📌Stay tuned for more heist missions. Let’s outwit the markets—one trade at a time.
🤑🐱👤💎 #ThiefTradingStyle #SHIBHeist #CryptoStrategy #MarketRobbery #SmartMoneyMoves

SHIBUSDT Best 3 points to save 600% gainHi as we can see on this chart Price is just starting to pump and hit our 600% Target and even then it is still far from Previous ATH.
Market is getting bullish once again and we are looking for rise and gain here too and our targets are all mentioned on the chart and major pump will start after breakout of red trendline.
DISCLAIMER: ((trade based on your own decision))
<<press like👍 if you enjoy💚

bullish simetrical pattern weekly corrective simetrical triangle done... now it should go up so fast .

SHIB NEXT TARGET#SHIB
Shiba Inu is forming a descending channel pattern on the daily timeframe🔍
The price is consolidating above the midline support and is currently testing the MA 50💁♂️
Breaking above this MA could drive the price toward targets at $0.00001500, $0.00001750, $0.00002050, and $0.00002500🎯

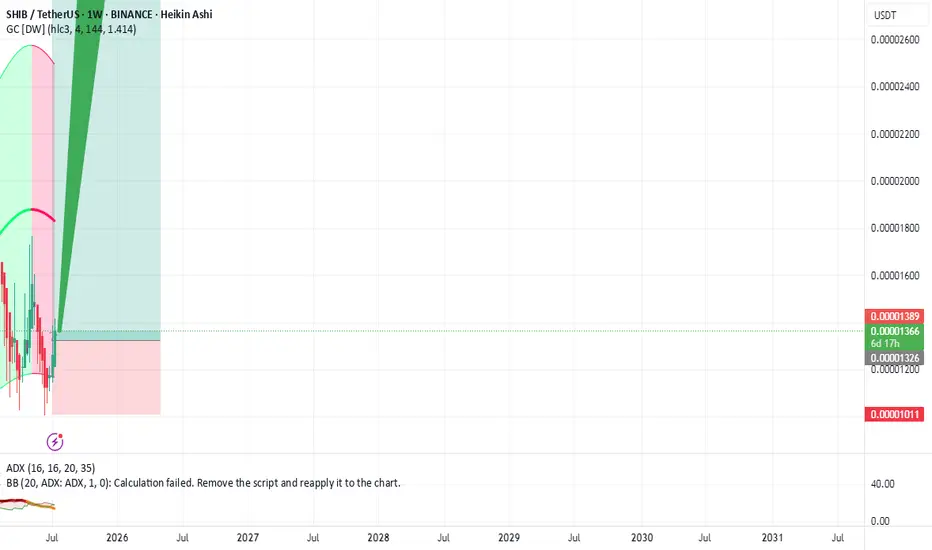
Shiba Inu Still Early Massive Wave yet Bullish —1,558% PPThe blue pattern on the chart is an analog of the purple pattern but bigger.
It is still early for Shiba Inu (SHIBUSDT) because the action is happening below MA200. The long-term bullish bias is only confirmed once the action moves and closes above this level.
This shouldn't be considered bearish because we have a clear higher low based on the two different consolidation patterns. The purple one produced the main low and the blue one the higher low. Multiple higher lows.
Lows—support confirmed—in August 2024, April & June this year. And that's it. This weekly candle is now full green and everything is about to turn positive crazy. Shiba Inu has been bearish since March 2024.
There was some bullish action in November 2024 but it ended as a lower high, what a bummer. All this time with no new highs, no major growth. This cycle is coming to an end. The null cycle, the boring cycle, the little-to-no-profits cycle is over... That's awesome. What does Shiba Inu has in store for us?
A new all-time high to start. Maximum growth. Euphoria, higher prices; growth. It will be awesome.
I am giving you all of the targets for Shiba Inu (SHIBUSDT). The highest one is 0.000220491. Total profits potential reach 1,558% from current price.
There are two resistance levels of interest below the previous ATH: 0.000067612 & 0.000057511.
Minimum new 2025 all-time high we will go for 0.000103188 for 676%.
You can find more numbers and targets by doing a close-up on the chart.
I hope you find this information useful.
Your support is appreciated.
Namaste.

SHIBUSDT Bounces Strongly from Wedge SupportSHIBUSDT is forming a bullish falling wedge on the weekly chart, showing signs of reversal after bouncing from key support at 0.00001000. A breakout above the wedge resistance could trigger strong upside momentum in the coming weeks.
Entry at current price
Stop Loss: .00000890 (Below the Wedge Support)
TP1: 0.00001700
TP2: 0.00003100
TP3: 0.00007000
$1000SHIBUSDT CRYPTOCAP:SHIB

SHIBA BULL/BEAR📊 SHIB/USDT (1H) Analysis
Price is consolidating inside a rising wedge pattern. A strong breakout is expected soon.
Possible scenarios:
✅ Bullish case: Break above the upper trendline (~0.0000124) could push SHIB towards 0.0000130 - 0.0000134.
❌ Bearish case: If support around 0.0000115 fails, a drop toward 0.0000100 - 0.0000104 is likely.
🔎 Key levels to watch:
Resistance: ~0.0000120 — critical for confirming a bullish breakout.
Support: ~0.0000115 — losing this level could trigger a sharper decline.
Watch RSI and volume for breakout confirmation.
💡 Trading idea:
Long on breakout & retest above 0.0000124, targets at 0.0000130+.
Short on breakdown below 0.0000115 with targets near 0.0000100.
Use tight stops outside the wedge for risk management.

SHIB – One Last Chance for a MoveGiving CRYPTOCAP:SHIB one last shot to do something big.
It’s sitting at a strong pivotal level with some clean weekly SFPs forming.
A 2x looks doable, especially considering how well it’s been holding—though it may take time.
CRYPTOCAP:PEPE and CRYPTOCAP:DOGE are showing strength too, so SHIB isn’t alone here.
The key? CRYPTOCAP:BTC needs to cool off and give alts some breathing room over the next two months. Otherwise, BINANCE:SHIBUSDT could drop another 50%.

SHIB AnalysisAlthough price has been recovering for the last couple of weeks, I still don´t see clear reversal indications.
We have yet to see a higher high / higher low, or bullish RSI divergence. These are key to consider a reversal.
The green resistance zone is a key level to be broken for a bullish bias.
Meanwhile, I´ll still be looking for downside reversals in smaller timeframes targeting the June low at 0...1004

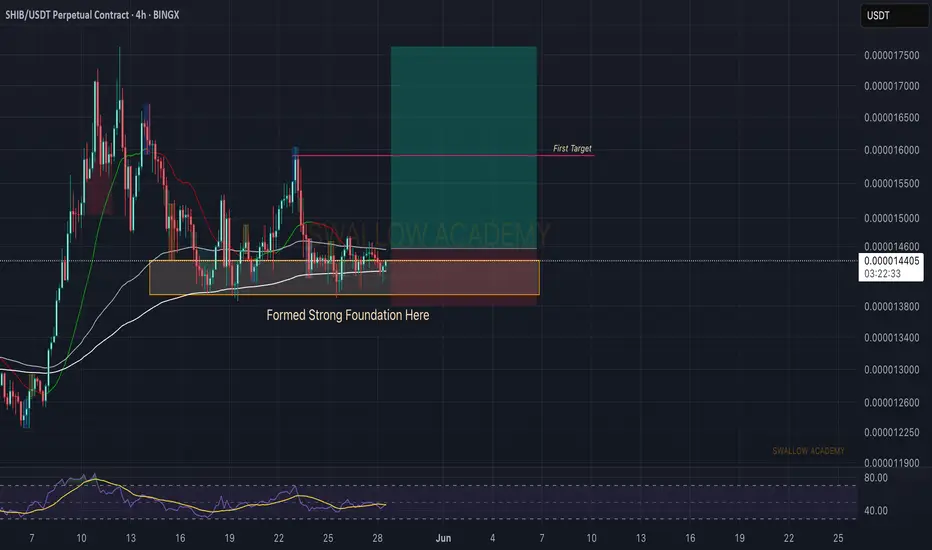
Shiba Inu (SHIB): Seeing Buyside Dominance, Looking For BreakoutShiba has formed a decent foundation near the local support area, while on the bigger timeframes we are seeing that the price is at a major support area.
With that being said, we are seeing a potential breakout happen, which would lead us to another bullish movement. We are keeping this game plan for the trade as long as we are above the $0.000011 area (as long as buyers maintain the dominance over it).
Swallow Academy

Shiba Inu (SHIB): Looking For Bounce From Current AreaShiba caught our attention with recent hovering near the local EMA area, where we have established some sort of supportive area. As we see the strength of this area, we are looking for a proper bounce from here, which then would give us a chance to get 10-20% of movement.
Swallow Academy
Shiba Inu (SHIB): Approaching Bounce Zone | Bullish TrendSHIB has reached the lower side of the bullish trend, which has aligned with EMAs (just as in previous times). We are looking for a bounce to happen from here, which would give us a nice R:R position that we can take from here.
Now we are looking for proper dominance from buyers to be seen; after that, we will be going to a long position.
Swallow Academy

Shiba Inu (SHIB): Possible Quick Fill of CME & Downward MoveSHIB has recently broken the 200EMA line and is currently retesting that area. Now, the 200EMA has been a strong downtrend holder for a very long time on SHIB (if we look at a wider chart).
With the recent fakeout above that EMA, we expect the price to continue that decline but before that, we might fill the CME gap like we did the last time so eyes on it.
If all plays out well, we should see a good BOS or just a quick fill of CME and liquidity hunting to lower zones.
Swallow Academy

SHIBUSDT lowest and strong support is ahead As we can see price is near major daily support zone now and here we have one of the last daily supports which is currently touching and price can easily receive bull candles and start pump like green arrows if the supports hold.
DISCLAIMER: ((trade based on your own decision))
<<press like👍 if you enjoy💚

Is shib getting ready to plot a Giant W on the 1W? Last year in December I spotted a W on the one week and subsequently the shib took off. Here we are one year later this time the W, If completed, is about 10 times larger than the last one. Many assets are lining up with an early February blow through the roof. Keep your eyes open and good luck!

Location, Location, Location!!!Knowledge is Power!
But how deeply do most people really understand this?
The average mind thinks power comes from possessing knowledge. But here’s a deeper truth — simply imagining yourself with mastery can trigger powerful feelings. Why? Because as Terence McKenna once described, the human brain is a chemical factory. An inspired thought — a glimpse of future achievement — can activate a cocktail of serotonin and dopamine, giving us a real sensation of power. And yet… did anything really change?
This is where ancient voices — shamans, philosophers, and modern mentors — whisper:
“You are already there…”
But are you really?
The answer is Yes… and No.
You feel the outcome, but you haven’t earned it yet. You’re not truly there until you’ve gone through the effort — the hours and hours of disciplined study, reflection, and ignoring the mental traps like “take a break,” “you have time,” or “scroll a bit.” Power, in this case, is the Knowledge itself — and to approach Power, you must become Power. Or else, it will crush you — like a boot crushes an ant. (Yes, that’s borrowed from the Avengers… we all need a laugh too.)
To actually reach that imagined reality, you must prove yourself to the knowledge itself. You have to earn it — through discipline, sacrifice, and unbroken focus. That means hours of study, observation, application, and repetition — no matter how many distractions your mind throws at you.
Focus on one subject until it bends for you.
Focus like your life depends on it.
Because in a way… it does.
🧠 Opportunity Cost = Power Equation
This focused, intentional work is what economists call Opportunity Cost. It’s the measure of how productively you spend your time. Every marked level, every reaction, every shift in volume is either:
• A step closer to mastery, or
• A missed opportunity, depending on what you choose to focus on.
TradingView becomes your journal.
A sacred workspace in the chaos.
A tool to track your evolution — mentally and technically.
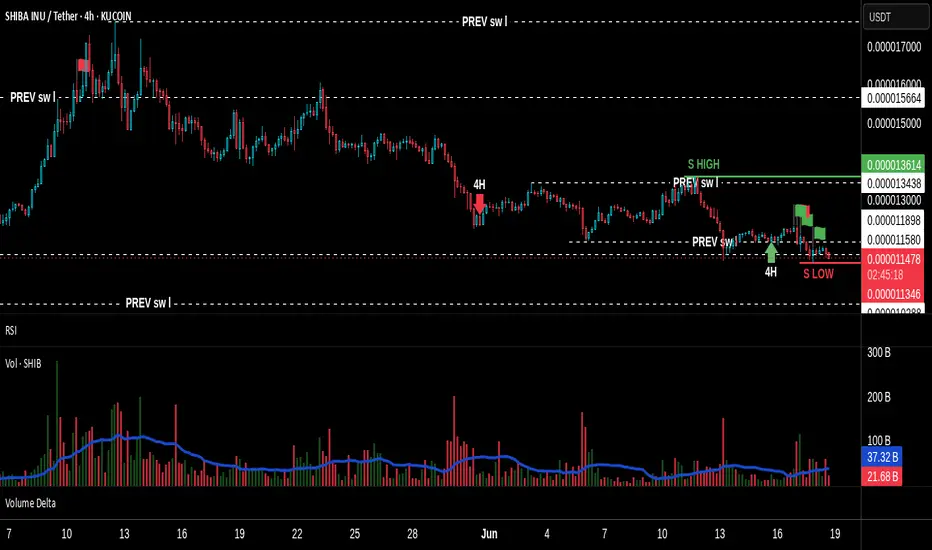
🔍 The SHIBA/USDT 4H Breakdown
On the 4H chart of Shiba Inu, key swing levels are marked — targets that can serve as entry/exit decisions depending on your strategy.
But the magic is not in the lines.
It’s in how volume reacts to those levels.
🔺 Volume — The King
Currently, the 4H Volume shows signs of a bearish continuation. But lower timeframes are beginning to show the initial signs of accumulation — strength where weakness used to live.
This is the beginning of Effort vs Result analysis:
• Are we seeing strong volume but no progress? (Demand absorption?)
• Are we seeing low-effort pushes into supply that fail to break key levels?
That’s how Smart Money behaves. Quietly, strategically, and always one step ahead.
And all this happens near key demand/supply zones — where Location meets Volume.
🔄 Timeframe Psychology: Past–Present–Future
Lower timeframes = The Past (they push).
Higher timeframes = The Future (they pull).
Your active timeframe = The Now — where you make your move.
A shift on the 3M chart might hint, but until it aligns with the 1H or 4H, nothing is confirmed. That’s why true traders are observers first, executors second.
🎯 Alignment: Levels, Volume, Effort
• 📍 Levels: They are not just technical — they are psychological battlegrounds.
• 🔊 Volume: It shows us where energy is being spent and whether it’s paying off.
• 🧱 Effort vs Result: The ultimate measure of Smart Money’s hidden hand.
When everything aligns, you don’t guess — you act.
🧭 Final Thoughts
At the time of this writing — 17:26 IST on June 18, 2025 — the 4H chart remains bearish in tone. But markets shift fast, and for all I know, a power transition could be unfolding on a micro timeframe as I type. That’s the nature of this game.
TA is not rigid. It is an art.
And once mastered, it becomes a part of how you think — not just how you trade.
Use your time wisely.
Let your focus become your fortress, and that fortress will guard you through every storm.
Work Smart. Think Deep. Act with Purpose.
Study the Bitcoin and Bitcoin Dominance cycle to understand altcoin flow.
Explore previous posts — I’ve shared them to help you grow.
The market is a breathing organism, I’ve pointed this in previous ideas. If you’re in sync with it—you’ll feel it.
And for those who believe there’s more to learn—but are struggling to find answers—there’s no shame in asking questions. But remember, nothing in the market is free.
Work Smart, and you’ll earn the right to follow — and even think like — Smart Money.
Till next time, take care—and trade wisely.
The trendlineSHIB needs to beat the 0.00001223 key level and then the 200 EMA at 0.00001238 and then that downward trendline, to get the bulls fired up.

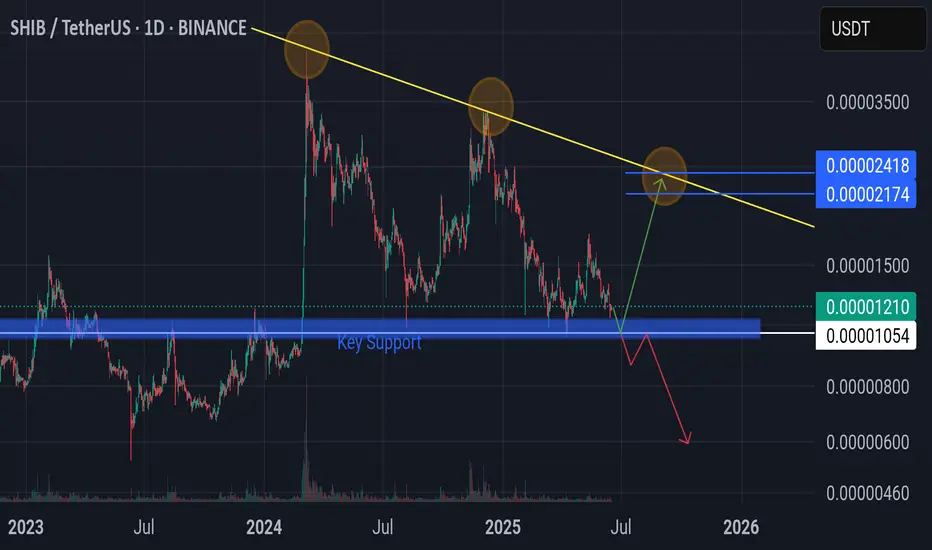
Shiba Inu!! next chapterCurrently near key support. potential reversal towards target 0.000021-0.000024.
⚠️ Invalid if falls below key support 0.00001054.
SHIBA +100%?? | BEST Buy OPPORTUNITYSHIBA has been in a downtrend for many weeks.
From here, upside is likely - especially if we look at the consecutive amount of "red" weekly candles (blue on this chart).
A 40% bounce zone is easily possible from this zone. Even at modest, 20% would be ideal:
____________
BYBIT:SHIBUSDT

SHIB/USDT is in Bullish TrendSHIB/USDT is looking good to go up side it is showing good retracement on daily chart and also showing bullish divergence on daily chart it can be buy current price or if some one want to be more sure then buy after new HH
