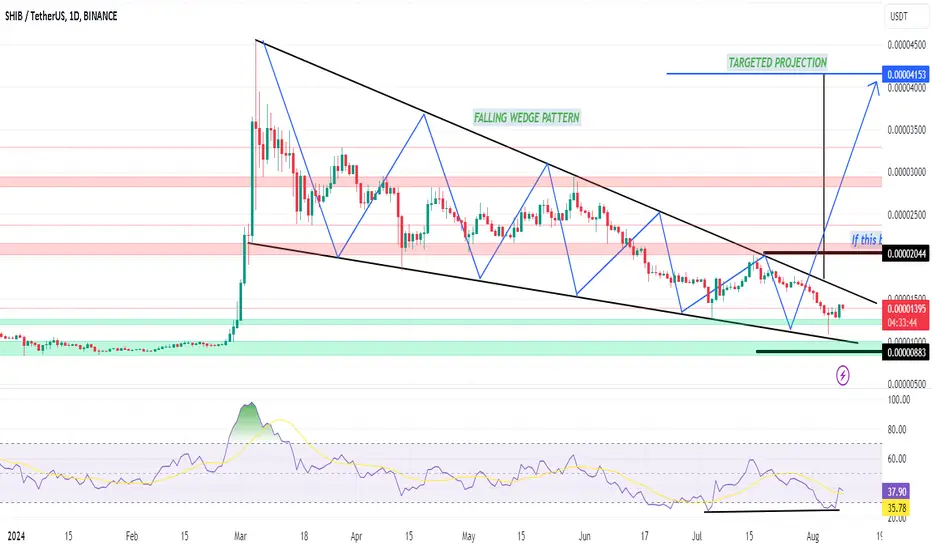
A long trade on SHIB/USDT with Falling Wedge.Here I found Falling wedge with a clear BULLISH Divergence.We are waiting for Breakout
SHIBUST trade ideas
Shib path to November 2024 - 2025 Hola Shib-inu fans, I have been getting request while I was away - asking what's the next move for Shib in this current market today.
Along with questions such as:
Why is it crashing so much?
Should you buy, hold, or sell?
Where do you see the market in the next year?
To answer that question is simply put I can not answer that directly at this time. Reason being, the market is currently influenced by the United States political and economical climate and is likely going to make an even greater impact based on which candidate wins office.
Republicans🐘 vs 🐎Democrats
Currently control the market movement, and if you don't believe me, after Donald Trump was shot, Republicans believed that this would land Trump a landslide victory, so Whales and influencers to the market flooded the main crypto wallets BTC and ETH among others with rally that led the price of bitcoin from a 56k lost back to a 70k return. Another example of how the US as well as China has a major controlling factor on how the market moves, is the fact that this most recent crash is based on the US CPI report being unsatisfactory forcing both the crypto and SnP market to crash from that outcome alone.
This is mostly the results of Bitcoin and its holders trying desperately to have ETF's take center stage and by doing so gave much of the control over financial growth to the banks and the governments that control them. That's the price we paid to have ETF's we are now apart of the regulatory stock market which is mainly control by the US market base.
So to understand where the next move for shib may lead is basically impossible to tell depending on who wins in November, so to help with this issue, I made a pathing map, and possible areas of concern for holders to look out for on a modified day chart converted to a weekly chart.
This path starts and end in November of 2024 to 2025 where if the republicans win, it will influence buying power from whales looking to capitalize on the returning president trump and the republican party new policies that want to put in place that is more beneficial to those with wealth they which to extend further.
vs
Another democratic win where policies may not change to much but will be a greater impact on the financial markets as a whole which will not rally whales if any at all and will likely cause a selloff in much of the markets not just in crypto.
So hopefully this map helps guide you to a positive path to riches or avoid a possible path to ruin.

SHIBUSDT soon +150% pump and 0.00029As we can see price is now near major daily supports mentioned on the chart with green zones and we are looking for rise and pump here like the green arrows on chart and our first target is at least +100% pump here.
DISCLAIMER: ((trade based on your own decision))
<

ShibaChance for buy Shiba
Show pattern for buy and have a zone a good for little time for big profit

ShibaChance for buy Shiba
Show pattern for buy and have a zone a good for little time for big profit

SHIBA ShortShibausdt is at the strong daily supply zone, Bears can renew local demand zone. Potential downtrend -30%

Shiba Inu Price Drops 22%. Can it break the trend?The 22% drop in Shiba Inu’s price over the last 24 hours results from bearish investors and similar market conditions. Signs of SHIB holder’s negative sentiment became evident following the shift in funding rate.
The funding rate indicates that SHIB investors have been anticipating a decline, with their expectations aligning with the recent drop in price. Their concerns about a downturn were realized as soon as the price turned red.
The Chaikin Money Flow (CMF) further illustrates that Shiba Inu investors have been actively withdrawing their investments. This trend of significant outflows highlights growing caution or dissatisfaction among the investor base.
Shiba Inu’s price at $0.00001105 fell below the support of $0.00001141, leaving the altcoin vulnerable to falling to the support of $0.00000898. This level has prevented further decline in the past, and SHIB could bounce back from it.
To recover and break the downtrend line, the meme coin must first turn $0.00001473 into support. Given the current challenges, this could be difficult, and SHIB might consolidate below this level.
On the other hand, if SHIB investors change their stance and turn bullish again, recovery is possible. Breaching the downtrend line would invalidate the bearish thesis and help reclaim lost profits.

SHIBUSDT.1DAnalyzing the SHIB/USDT daily chart, it's clear that the market has shown a mixture of explosive growth followed by a sharp decline, which is typical for volatile assets like SHIB. Let's dive deeper into the key technical indicators and the support and resistance levels to get a clearer picture of potential market movements.
Support and Resistance Levels:
Support Level 1 (S1) at $0.00000549, which the price is currently testing. This level is crucial as it has previously acted as a floor, preventing further downward movement.
Resistance Level 1 (R1) at $0.0000219, which marks the recent high point and could serve as a strong resistance if the price attempts to recover.
Resistance Level 2 (R2) at $0.00004567, representing the peak of the previous bullish spike.
Technical Indicators:
The MACD (Moving Average Convergence Divergence) shows a divergence below the signal line and is deeply negative, indicating strong bearish momentum. This suggests that the downward trend could continue unless there's a shift in market dynamics.
The RSI (Relative Strength Index) is approaching the oversold region but has not yet breached the 30 level, suggesting that there might still be room for further downside before a potential reversal could occur.
Conclusion:
From my analysis, the SHIB/USDT pair currently presents a bearish outlook. The price testing the support at $0.00000549 is pivotal; a break below this could lead to further declines, potentially creating new lows. Conversely, should the asset stabilize and rebound off this support level, it could attempt to challenge the resistance levels above. Given the current negative MACD and approaching oversold RSI, traders should remain cautious and look for potential signs of reversal or consolidation at the support level. As always, keeping an eye on broader market sentiment and news that may affect SHIB's price is crucial for timely decision-making.

SHIBA BACK TO THE BLUE ZONEShiba seems on the low time frame to make a new increase trend with a high chance back to the blue box.
We \will follow \SHIB/USDT

Strong selling pressureBINANCE:SHIBUSDT Shiba has faced a sharp decline in price, and as you can see, it is below its downward trend line and it has failed to break through identified resistance levels. This indicates strong selling pressure and decreased investor confidence.
Support and Resistance Levels:
Support Level: If the downtrend continues, the price is likely to reach the support level of 0.0000137885. This level acts as a key point to prevent further price declines.
Resistance Levels: To reverse the current downtrend, the price needs to break out of the descending channel and surpass important resistance levels at 0.0000150638 and 0.0000160392. Breaking through these levels would indicate a return of buyer strength and the potential start of an upward trend.
If the price fails to break through the key resistance levels, the selling pressure may continue to push the price downward. Conversely, if the price surpasses these levels, the likelihood of a trend reversal and an upward movement increases.

SHIB.USDT only long, long, long. Based on the available factors, such as price action, indicators and positive news, and more importantly, the significant correction of Shiba Inu.
Every price drop is an opportunity to buy.

$SHIB support and green zone for buying long and refillI have been following CRYPTOCAP:SHIB for quite a long time, and it is in a very long downtrend. This chart is similar to the setups I have created for other coins; it highlights a great zone to refill your portfolio with a high probability of good performance.
DYOR, check my other setups; they are all good and doing +30% with no leverage. Don't forget to take your profit and control your greed. Meme coins are not for holding long-term—make a profit, sell, and buy another one.
We are in a CRYPTOCAP:BTC downtrend, so it's time to catch opportunities. In 2 months, the current prices will look very cheap.
An entry at 0.000015 or less is a bargain. Then, just wait 2 months and sell at the top of the altseason.

SHIBUSDT easy +100% pump is coming As we can see price is now near major daily supports and we are looking for pump and rise here at least the first red zone and resistance zone which is almost 100% profit.
DISCLAIMER: ((trade based on your own decision))
<

SHIBUSDT pump ahead As we can see we had about -70% dump and rest and soon we are expecting next bull run and pump here like the green arrows on chart to the targets and next possible supports on chart.
DISCLAIMER: ((trade based on your own decision))
<

Why I say SHIBA INCREASE is CLOSE We'll take a look at a few methods of chart analysis that ultimately says a Shiba Inu increase season is on the horizon.
✅ RSI
The RSI has been fair to low for an extended period of time. We also observe a bottom out on the RSI where an all time low is observed for the year, likely indicating the bottom is in:
✅ V-Shape Recovery
A strong V-Shaped recovery is observed in the 4h, indicating buyers were ready to scoop up lower prices:
So what are we waiting for?
👉 Technical Indicator
In order to send SHIB, we will first need to see the price close ABOVE the trendline, at which point a "BUY" alert will go off:
What would invalidate my bullish sentiment, is IF the price is unable to et back above the trendline pointed out above on the technical indicator, and IF we lost the higher lows:
_______________________________________
BINANCE:SHIBUSDT

SHIB Burn Rate Spike 7300% Sparks Potential for a BreakoutThe Shiba Inu coin (SHIB), often referred to as a meme cryptocurrency, has captured significant attention in the crypto community with a dramatic increase in its burn rate. The recent surge of over 7300% in SHIB's burn rate has sparked optimism and speculation about a possible price rally.
Burn Rate Skyrockets
According to Shibburn, the burn rate for Shiba Inu ( CRYPTOCAP:SHIB ) soared an astonishing 7334.38% in the past 24 hours, with 2.37 million coins being destroyed. This significant reduction in the coin’s total supply, now trimmed to 589.27 trillion CRYPTOCAP:SHIB , has reignited hope among investors and market watchers. Over the past week, a total of 70.44 million CRYPTOCAP:SHIB were incinerated, further emphasizing the aggressive burn strategy.
Market Reaction
Despite the burn rate spike,$ SHIB's price has been on a downward trajectory, slipping to $0.00001673, a 3.04% dip at the time of writing. The coin's recent high was $0.00002 on July 16, but it has since faced a steady decline. This price movement has raised concerns among investors, especially given the recent increase in burn activity.
Technical Analysis and Market Sentiment
Recent CRYPTOCAP:SHIB price analysis indicates a positive sentiment for the asset’s future. The coin is currently navigating a downtrend within a falling wedge pattern, a formation often seen as a precursor to a potential breakout. Further accentuating to the bullish outlook is the Relative Strength Index (RSI) which sits at 44.85. The maturity of this pattern suggests that the downtrend may be nearing its end, paving the way for a possible price pump. Shiba Inu also shows pattern of a Golden cross which is a major bullish reversal pattern it occurs as the result of a crossover of the 200-day average by the 50-day average.
Furthermore, SHIB’s futures open interest (OI) rose by 0.81% to $41.56 million, and derivatives trading volume spiked by 42.52% to $68.79 million. These indicators show a growing interest in SHIB among investors, despite the recent price dip.
Shibarium's Role
Shibarium, Shiba Inu’s Layer 2 (L2) solution, has recently surpassed 6 million blocks, marking a significant milestone for the coin’s ecosystem. This development, coupled with the increased burn rate, suggests a robust underlying framework that could support future price growth.
Future Outlook
A bullish signal that could indicate the end of the downtrend. With the burn rate surge and strong technical indicators, there is a growing belief that SHIB could reach the $0.0000377 target in August.
Conclusion
The Shiba Inu coin’s dramatic increase in burn rate and the associated market optimism present a compelling narrative for potential price growth. While the coin has faced a recent decline, the underlying technical and market dynamics suggest a possible turnaround. Investors and market participants should watch closely, as SHIB's price action in the coming weeks could confirm or challenge these optimistic projections.

SHIBAUSDT 1WSHIB ~ 1W
#SHIB This support block would be a very interesting buy for now.
We will place small purchases here. Expect a 20%+ increase at minimum.

SHIBSHIB price fell to break above still pushing to the downside. Keep an eye around the yellow zone if there is any rejection to confirm, if it is coming down.

shib inu usdt 4HAccording to my analysis, 4H
pattern wedge vs head and shoulders ,
if sudden changes or unusual drops do not happen in Bitcoin, because it is in a sensitive area and important news will be in the next few days.
En : 0.01685 or 0.01690 $
sl : 0.01660$
tp1 : 0.018$
tp2: 0.020$
Good luck

SHIB: Breakout or Consolidation?The trading volume is 88.414B SHIB, indicating significant market activity.
Parabolic SAR indicates a potential bullish trend with the SAR at $0.00001652.
The SMA is at $0.00001705, indicating that the current price is slightly above the moving average, which can be a bullish sign.
The histogram value is 0.00000011, MACD line is -0.00000001, and the signal line is -0.00000012, indicating a neutral trend but showing signs of a potential bullish crossover.
%K at 78.02 and %D at 82.52, indicating near overbought conditions.
The RSI stands at 55.80, suggesting that SHIB is in a neutral zone with a slight bullish bias.
Market Sentiment
The market sentiment for SHIB appears cautiously optimistic. The MACD is showing signs of a potential bullish crossover, while the RSI and Stochastic Oscillator indicate neutral to near overbought conditions.
Potential Market Scenarios
Bullish Scenario:
A decisive break above the dynamic resistance at $0.00001755 could lead to further upward movement, targeting higher resistance levels around $0.00001800.
Bearish Scenario:
If SHIB fails to break above the dynamic resistance, it could retest the support levels at $0.00001677 and $0.00001598. A break below $0.00001598 could signal further declines.
When to Buy SHIB for Investment
Current Situation:
Given SHIB's current price at $0.00001723 and the technical indicators suggesting potential consolidation or a slight bullish trend, a cautious approach is warranted.
Optimal Buying Strategy:
Wait for a Breakout or Dip: Watch for a breakout above $0.00001755 for bullish confirmation or wait for a dip towards the solid support level at $0.00001598.
Solid Support Level: If the price drops further, the solid support at $0.00001598 is a strong level to consider for investment. Historically, SHIB has found significant buying interest at this level, making it a safer entry point.
Gradual Accumulation: Alternatively, adopting a dollar-cost averaging (DCA) strategy by buying small amounts at regular intervals can mitigate the risk of market timing and take advantage of potential dips.
Conclusion and Market Outlook
SHIB is currently positioned with significant support and resistance levels to watch. While technical indicators suggest potential consolidation in the short term, the MACD showing signs of a bullish crossover and overall market activity suggest room for growth.
Impact of Bitcoin:
It's essential to note that Bitcoin (BTC) is currently at a crucial level. If BTC fails to surpass its all-time high and experiences a significant drop, it could negatively impact the broader cryptocurrency market, including SHIB. Monitoring BTC's price action is vital for understanding potential risks to SHIB's price movements.

Revealing the Masons' Secret Strategy for SHIB/USDTHey everyone! 🎉
Guess what? We’ve got some super exciting news for you today! 🎊 We’ve been working our magic behind the scenes, keeping our strategy a top-secret recipe 🍲, but now, it’s time to reveal a little bit of the Masons' magic 🧙♂️✨! And not just any Masons – we’re talking about the big Masons who control the world! 🌍🔮
Targets and Fun Stuff:
Current Price: SHIB is hanging out at around 0.00001705 USDT. 🤑
Support Levels:
Primary Support: 0.00001651 USDT – This is our cozy little safety net. 🛏️
Secondary Support: 0.00001540 USDT – Extra cushion just in case! 🛋️
Resistance Levels:
First Resistance: 0.00001718 USDT – First checkpoint, here we come! 🚀
Second Resistance: 0.00001850 USDT – Next stop, a bit higher! ⏫
Third Resistance: 0.00001904 USDT – Keep climbing! 🧗
Our Master Plan:
Initial Target: 0.00001718 USDT – Easy peasy, lemon squeezy! 🍋
Intermediate Target: 0.00001850 USDT – Let’s go higher! 🎈
Extended Target: 0.00001904 USDT – We’re on a roll! 🏄
Stop-Loss:
To keep things safe, we’ve got our stop-loss just below the primary support at 0.00001651 USDT. It’s like our trusty parachute 🪂 in case things go south!
Why the Secrecy?
We’ve been keeping our strategy under wraps because, well, where’s the fun in giving away all our secrets? 🤐 But now, it’s time to share the love and show you the power of the Masons' work! 🏰🔮
The Big Reveal:
So, get ready to witness some serious market magic. Whether you’re a seasoned trader or just dipping your toes in the crypto waters, we’ve got something exciting lined up for you! 🌊💸
Remember, we know what we’re doing, and we’re here to prove that a little bit of the Masons' magic goes a long way. Buckle up, enjoy the ride, and let’s make some gains together! 🚀💰
Stay awesome and happy trading! 😎✨
Your friendly neighborhood Masons 🧙♂️🧙♀️

SHIBUSDT.PThe flag pattern has broken down and my expectation here is to continue down the length of the flag

Walkies!! - SHIB/USDTwent below the 786 there so i think- correction over, so treating these minor waves on alts as 1-2's from here, i thnk probably 3.618 here just because of overhead resistance on the left
