SHIBUSDT#SHIB CRYPTOCAP:SHIB has broken the downtrend, sustained above the resistance, and completed the retest. This gives us a bullish signal. We can position ourselves accordingly.
SHIBUST trade ideas

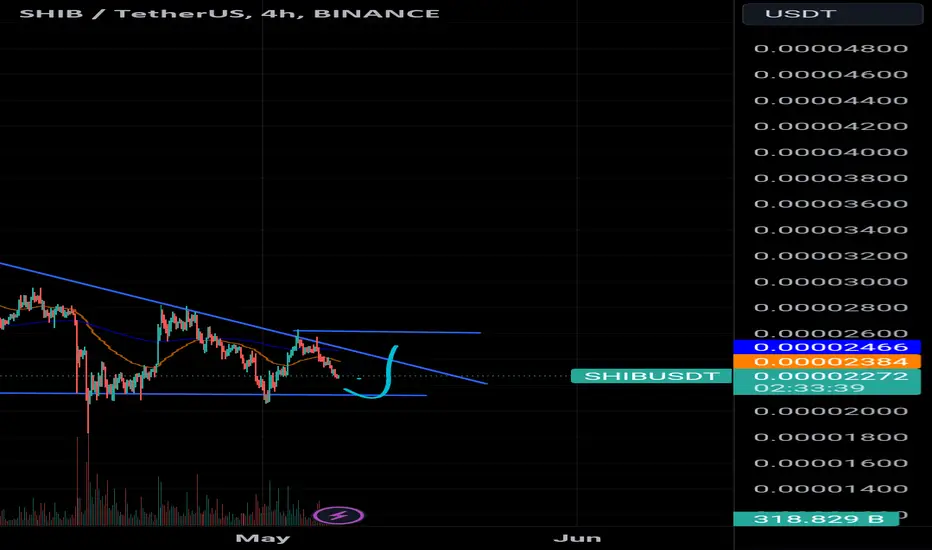
Lingrid | SHIBUSDT more BULLISH Moves are IncomingThe price perfectly fulfilled my previous idea. BINANCE:SHIBUSDT went up and hit the target level. The market surged upwards, breaking through the range zone and closing above it. This move has resulted in a series of updated higher lows, with the highs becoming increasingly similar, indicating a growing buying pressure. As the price continues to move upward, it's heading towards the resistance zone that originated from the swap level. I'm anticipating a potential retest of the key zone around 0.000030, as well as the upper border of the channel and trendline. My target is the resistance at 0.000027.
Traders, if you liked this idea or if you have your own opinion about it, write in the comments. I will be glad 👩💻

SHIB/USDT: Potential Breakout and Retest - Trade Idea!!Hey everyone! If you find this content valuable, please consider giving it a thumbs up and following for more analysis.
SHIB is showing some interesting signs on the chart. We've seen a potential breakout from a previous resistance level, and the price is currently retesting that level as support. Additionally, the 100-day moving average (100MA) is acting as potential support.
This could be a buying opportunity for those interested in SHIB. However, it's important to manage your risk. Here's a possible trade setup:
Entry: Current market price (CMP) with potential for adding more on a dip down to $0.000024 (be sure to use a stop-limit order for this)
Target: 80-100% potential profit (be sure to set realistic take-profit orders)
Stop-Loss: $0.00002225 (place a stop-loss order below the support level to limit potential losses)
Remember, this is just an idea, and the market can be unpredictable. Always conduct your own research before making any trading decisions. What are your thoughts on this SHIB setup? Share your analysis in the comments below!

shiba inu has a crazy nice setupthe price is pinned but its amazingly bullish... lets hope we can make some money!

I Cannot SHORT This !!!Hi.
BINANCE:SHIBUSDT is following a Descending Triangle pattern and it has recently pumped from a horizontal support level.
The 200 moving average signals a bullish trend
A clear breakout from the triangle pattern is required to confirm a bullish move.
Stay awesome my friends.
_ _ _ _ _ _ _ _ _ _ _ _ _ _ _ _ _ _ _ _ _ _ _ _ _ _ _ _ _ _ _ _ _
✅Thank you, and for more ideas, hit ❤️Like❤️ and 🌟Follow🌟!
⚠️Things can change...
The markets are always changing and even with all these signals, the market changes tend to be strong and fast!!

SHIBUSDT 3D LONG📈Hi all. Timeframe 3D. SHIBUSDT has formed a triangle in 2 years and is in strong support. I am considering entering spot now and/or going long during a breakout/retest of the trend line. Marked goals and levels on the chart.

Shibainu... 🎯 Target Shiba can grow by 300%.
After exiting the triangle, wait for Shiba's pump to reach the drawn area.

SHIB COIN TARGET $ THIS SUMMERWe about to have a breakout from this flag if we did up we need to break first the orange line to have a bullish pump up, if we broke it from below , we going to have a huge dip towards the second red line where we going to have a huge reversal there .

SHIB AT THE EDGE OF BREAKING THE TRIANGLEBreakout can lead the target at 2600,2800,3500,and at the final resistance to 4550.after that we can see they choppy movement or a retest.

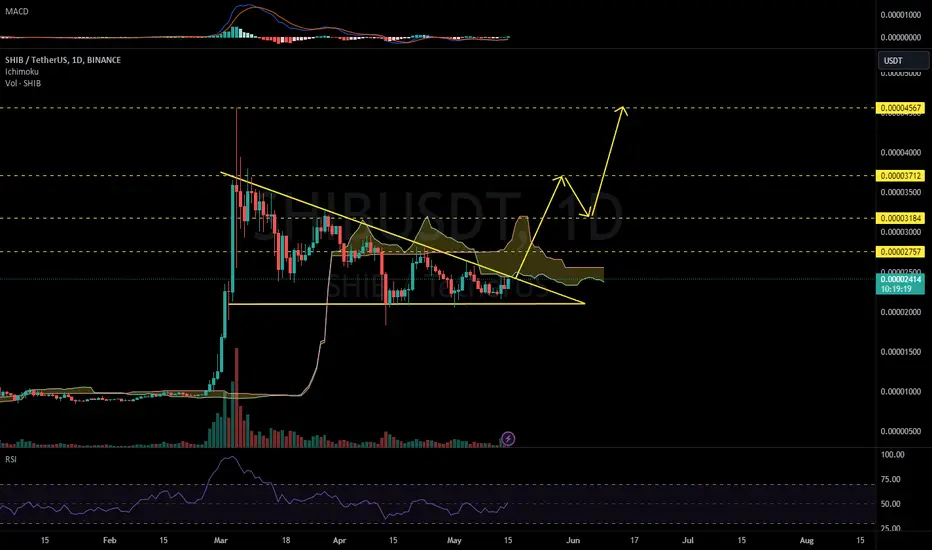
SHIBUSDT 1DKeep an eye on #SHIB. It is testing the triangle resistance and Ichimoku cloud on the daily chart. In case of a breakout, the targets are:
$0.00002757
$0.00003184
$0.00003712
$0.00004567

Shiba needs closing above 0.000026 to move new target 🙂👍Personal idea: In daily time frame we see changing Shiba moving from bearish to bullish movements. In this situation closing above 0.000026 and finding support in this zone can accelerate Shiba moving, possible target in my opinion in full bull run could be at least around 0.000026

SHIB - Daily Short term Trend & Support/Resistence levels CRYPTOCAP:SHIB : now completed a correction and are ready to return to gain higher. The new opportunity at the current price
🟢 Trend: Bullish 🚀
🟢 Support: 0.00002150
🟢 Target: 0.00002640
------
Current CRYPTOCAP:SHIB : 0.00002320

I expect a neutral and indecisive market in the future.
See, I don't want to give you false hope because we're in the stock market and looking to make money. In some analyses, I've seen people drawing two lines and claiming it resembles a triangle pattern, playing with people's capital, which is truly shameful. Let's forget that. Two months ago, we witnessed a strong upward trend with high momentum, where this currency saw about a 400% growth. It's been about two months now that we've been in a corrective phase, and the price is consolidating at a point.
As I've written on the chart, this is the third continuation trend line, indicating a weakening downward trend, and we're now entering the trading range phase. Given Bitcoin's situation and other market conditions intertwined with the price, I currently don't expect significant price increases, at least not this month. The time conditions will be violated when the first resistance, which I labeled as "First Minor R" on the chart, is broken with a strong candle. For now, my buying points are at supports and my exit points are gradually at resistance levels on the chart. Keep in mind that after breaking the trend line, don't expect a rapid move because buyers and sellers will have to make decisions regarding the price in the next few days, and their conflict creates a trading range or what we call a ping-pong movement and market indecision.
Wishing you profitable trades.

as we predicted shib got a downtrend and today pumped back!We have records that shib would get downtrend and today it pumped back, now we have another down run soon. and on key support 0.000022+ it will come back as a baby to 0.000025 and then we will share more predictions please all of shib holders and traders move with us in order we can control the price together :) this is not a financial advise but we belive once you so our exact moving predictions you will trade with us and it will be a big power at a near future, so lets move shib to the moon !

What is token burning in crypto?Understanding Token Burning in Cryptocurrency: A Comprehensive Guide
What is Token Burning?
Token burning is a crucial strategy in the volatile realm of cryptocurrencies, where assets lack real-world backing. Developers employ innovative approaches to maintain long-term price stability and incentivize investors. One such method is burning tokens, which involves removing coins from circulation. This action reduces the total supply, increasing scarcity, and potentially boosting the value of each remaining coin.
Why Do Projects Burn Tokens?
There are several reasons why cryptocurrency projects may choose to burn tokens:
Scarcity and Value Appreciation By reducing the supply of tokens, projects can create scarcity, leading to potential value appreciation for the remaining tokens. This can incentivize holding and discourage selling, contributing to price stability and growth.
Reward Mechanisms Some projects use token burning as a reward mechanism for users or participants. For example, platforms may burn tokens as part of a buyback program, where they purchase tokens from the market and then burn them, effectively reducing supply and rewarding holders.
Economic Alignment : Token burning can align economic incentives within a project's ecosystem. For instance, platforms may allocate a portion of transaction fees to token burning, ensuring that stakeholders benefit from increased token value as the supply decreases.
Coin Migrations : During blockchain upgrades or migrations, projects may burn old tokens that are being replaced by new tokens on a different blockchain. This process helps maintain continuity and security during transitions.
Examples of Token Burning:
Binance Coin (BNB): Binance, one of the largest cryptocurrency exchanges, regularly conducts token burns of its native token, BNB. A portion of the trading fees collected on the Binance platform is used to buy back BNB from the market and subsequently burn the tokens, reducing the total supply over time.
Ethereum (ETH): Ethereum has proposed a shift to a proof-of-stake (PoS) consensus mechanism with Ethereum 2.0. As part of this transition, ETH holders can lock up their tokens in the new Ethereum Beacon Chain, effectively removing them from circulation and reducing supply, akin to token burning.
TRON (TRX): TRON Foundation has conducted multiple token burns of its native token, TRX, to manage supply and support token value. These burns are often announced publicly, providing transparency to the community.
Crypto Exchanges: Some cryptocurrency exchanges conduct token burns of their exchange tokens as part of periodic events or promotions. This practice can benefit token holders by reducing supply and potentially increasing token value.
Does burning impact token price?
Token burning can indirectly affect token value. Reducing circulating coins typically generates positive sentiment, potentially increasing asset popularity and value. While not the primary price driver, decreased supply can create scarcity and lift remaining token values. However, many factors influence token price, such as market conditions, sentiment, and project reputation.
In conclusion - Token burning remains a potent method for enhancing and stabilizing crypto asset value. Transparency and stability through burning incentivize investor trust, contributing to sustained price levels. Despite not guaranteeing immediate value hikes, burning offers long-term benefits, especially for projects with substantial user bases. Other advantages include community reinforcement and inflation control, making token burning a strategic practice in the cryptocurrency landscape.
Hope you enjoyed the content I created, You can support with your likes and comments this idea so more people can watch!
✅Disclaimer: Please be aware of the risks involved in trading. This idea was made for educational purposes only not for financial Investment Purposes.
---
• Look at my ideas about interesting altcoins in the related section down below ↓
• For more ideas please hit "Like" and "Follow"!

Lingrid | SHIBUSDT double BOTTOMEDBINANCE:SHIBUSDT market has formed a double bottom at the support level, a bullish sign that suggests a potential trend reversal. On the daily chart, a triangle formation is taking shape, which is a classic trend continuation pattern. This pattern indicates a price squeeze, where the market is building up energy for a breakout. I think the market will soon break through the downward channel and surge upward, retesting the key resistance levels. This would be a strong indication that the bull run is about to begin. In anticipation of this move, I expect the market to make a temporary pullback towards the support level before resuming its upward momentum. My target is the resistance zone at 0.00002440
Traders, if you liked this idea or if you have your own opinion about it, write in the comments. I will be glad 👩💻

SHIBA TO 0.000028!!!!!!!!!!SHIBUSDT just got rejected from the fvg zone now price is heading towards to sweep liquidity at 0.00002157 am looking forward to take entry opportunity from the second price rejections from the fvg zone making it double bounce support to breakout to the upside to take out the buy side liquidity
JOIN AND ENJOY....
Tell us what you think...............?

Downtrend 1H chart then under 0.000022 it will pump backShib returns below 0.000022 and goes up back to 0.000025, this is after the Federal Reserve risk every time the risk is released bitcoin loses part of its price and of course altcoins follow and this is reflected in Shib Often for quick trading this is in our favor but don't forget to just follow our forecasts. The Shib 1 Cent team is always at the forefront and you move with us to build a strong forecasting force and the chart will follow us. this is how we can win together!

$SHIB will make millionaires out of usPrice target is ATH $0.0001 by YE '24.
This analysis is based on technical indicators (MA Cross, Volume, RSI) and historical trading patterns. Position is long (DYOR). Please note that I am not a financial advisor; and I personally own this token.
For more information visit: shib.io

TURBOUSDT Don't miss the flightIs another currency like bonk coming
Yes
Turbo does not travel to the moon
But
It will go to Mars
Community Verified icon

$SHIB has a nice target after breakout from gigantic channelGigantic forming (bull?) flag on CRYPTOCAP:SHIB
Price is holding nice above 200MA 12h and it forms a triangule with the resistence channel
The target is conservative, and it was traced from the bottom of channel

1000SHIB/USDT 4H Time Frame Analysis Shib running overall bulli1000SHIB/USDT 4H Time Frame Analysis
Shib running overall bullish after showing a significant Change of Character (ChoCh) on Daily and Weekly Time Frame.
Planning to buy aggressively at market price would be a poor decision, so marked lower POI to plan further trades.
Lets see how the price reacts from here then will share proper entries for Futures.