SHIBUSDT 6D Analysis SHIB ~ 6D Analysis
#SHIB Buy back gradually from here if you still have confidence in this coin with a short term target of at least 20%+ from this support.
SHIBUST trade ideas

SHIB Accumulation Phase: Double Bottom Formation SHIB is currently trading sideways on the daily timeframe, showing signs of accumulation as price consolidates between well-defined support and resistance levels. The lack of directional breakout has kept the market in range, but recent structure suggests that buyers may soon gain control — if key support levels hold.
Price is revisiting the value area low and weekly support zone, where a potential double bottom formation is in progress. The first bounce from this region triggered a bullish reaction. If bulls step in again at the same level, the pattern will be technically confirmed — a strong reversal signal that often precedes upward continuation.
This setup also aligns with the broader accumulation narrative: sideways movement with strong support reactions and no major breakdowns, which typically builds the base for a breakout. However, without a decisive move above resistance and confirmation via volume expansion, SHIB may continue to chop within the current range.
For now, price remains in a constructive position, and dips into support are considered high-probability buy zones, as long as buyers continue defending key levels. A confirmed breakout above range resistance would shift momentum decisively in favor of the bulls.
Key Levels to Watch:
Support: 0.0000180 – 0.0000172 (Weekly + Value Area Low)
Resistance: 0.0000225
Confirmation: Breakout on increased volume
Bias remains neutral to bullish until the range is resolved.

SHIBUSDT soon after breaking red trendline can pump hard On this pump for market we may not have a new ATH for coins like SHIBUSDT or we may have(10% possible).
But as we can see price had a huge amount of fall and now with simple touch near previous daily high we earn good +200% profit.
DISCLAIMER: ((trade based on your own decision))
<<press like👍 if you enjoy💚

"Crypto Charts Whisper—Are You Listening?"As I’ve mentioned before, the market is manipulated. In a previously published idea, “VSA vs BTC: Into a Bearish Scenario or Not?”, this manipulation becomes obvious. The big players—whales, institutions, banks—are deliberately engineering traps to absorb liquidity from uninformed retail traders, boosting their profits and power.
Some informed retail traders like you and me understand that behind these entities are teams of insiders and highly trained traders operating around the clock—24/7, 365 days a year. That’s what it takes to survive in such a demanding environment.
This is especially true in the crypto market, which—despite its explosive growth—is still a baby in terms of total market cap. That’s why price fluctuations are so extreme, whether it’s Bitcoin, Ethereum, or altcoins.
Many of you who have been in the space since the early days already know: Bitcoin is the king. As the first coin built on cryptography, Bitcoin leads the way—and where it goes, altcoins follow. These movements often align with changes in Bitcoin Dominance.
So, yes, Bitcoin is the king—but its movements aren’t random. Bitcoin follows rules, and these rules are shaped by data—especially macroeconomic data. One major example is the Consumer Price Index (CPI), released monthly by the U.S. Department of Labor and Statistics.
And here's the key: the big players often have early access to this kind of information. They prepare accordingly—days before the official release—and when the data hits, they move the markets up or down. Even whales don’t act on gut feelings. They follow a framework.
We, as retail traders, must adopt a similar approach. We may not have insider access, but we do have knowledge—and with an open mind, we can act in advance.
As I’ve emphasized before: learning to read Market Structure lets you decode not just market psychology, but also the intentions of the big players. Their large positions leave footprints, just like a ship cuts a path through water. That trail is visible—for those who know where to look.
If you study volume correctly, you’ll start to notice certain zones that keep coming back. That’s all I’ll say—for now.
Unfortunately, many traders rely blindly on strategies like swing trading, expecting price to react at predefined swing highs or lows. But this rarely happens on schedule—especially in crypto. Yes, swing highs and lows exist—that’s the nature of all markets—but in between those levels, the big players create hidden structures that act as signals.
These aren’t just random formations—they’re part of how the big players "communicate" with one another. First, to maintain balance within their own circles. Second, to create FOMO and trap emotional retail participants.
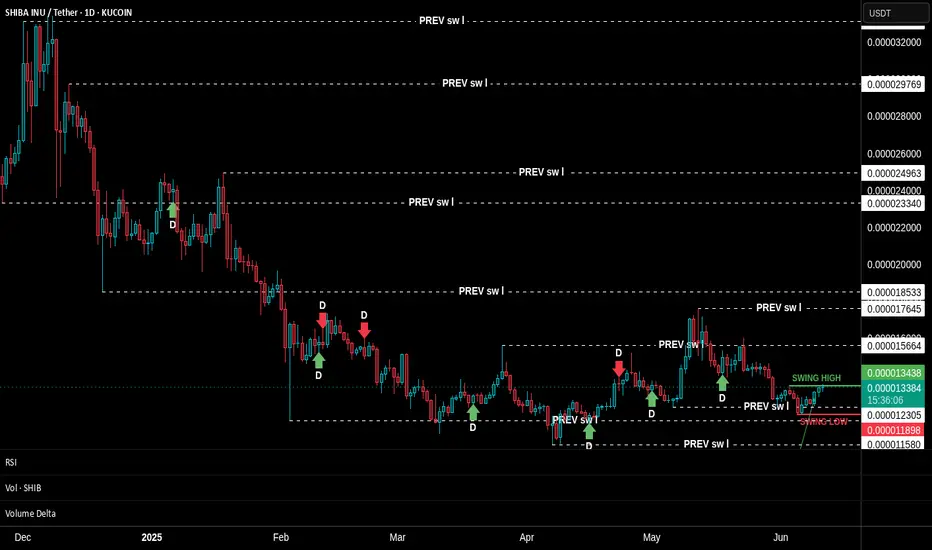
Look at the SHIBA INU chart I’ve shared. This technique is unfolding in real time. Do you notice how the structure is compressing? How price and new swing levels are squeezing in? Look closer at the footprints I’ve highlighted—some of those levels are being respected and reused in the future.
We’re taught from childhood that "we can’t know the future." But is that really true? Repetition of such beliefs is common—worldwide. But again, is it true? I think not.
Think about this: if you drive a car full-speed toward a wall and don’t brake, what happens? You crash. Isn’t that a form of future reading? It’s based on logic, observation, and probability. The same tools we use in market analysis.
So, I hope my words challenge your thinking.
📅 As of this writing (June 11, 2025), Bitcoin is trading at $109,588.
Today’s candle still has about 17 hours left to form, and price action on the daily timeframe is sitting within a previously established supply zone. Bulls and bears are clashing here. But zoom in: what's happening on the lower timeframes? Which signals have been tested, and which haven't?
Are we about to see a breakthrough above the all-time high?
Could this be the launch of the next leg of the bull run?

Lingrid | SHIBUSDT Bullish Divergence at Support ZoneBINANCE:SHIBUSDT is attempting to recover from a structural divergence near the key 0.00001217 support area. The recent breakout above the descending channel suggests bullish intent, though price is now retesting the breakout level. If buyers hold this zone, SHIB could rally toward 0.00001430.
📈 Key Levels
Buy zone: 0.00001205–0.00001230
Buy trigger: strong bounce above 0.00001250
Target: 0.00001430
Sell trigger: break below 0.00001200
💡 Risks
Failure to hold above 0.00001200 would invalidate the divergence setup
Rejection near the downward trendline could trigger renewed downside
Market-wide weakness may cap follow-through beyond resistance
Traders, if you liked this idea or if you have your own opinion about it, write in the comments. I will be glad 👩💻

SHIBUSDT wait for 0.000020$As we can see major resistance now is red trendline so the pump from daily supports like 0.000010$ and 0.000007$ is now possible and our first target is at least 0.000020$ which is around 80% pump from here and market can get bullish once again if BTC hold above 100K$.
DISCLAIMER: ((trade based on your own decision))
<<press like👍 if you enjoy💚

ShibThis image is a price chart of the SHIB/USDT trading pair on a daily timeframe (1D) from the Binance exchange, sourced from the TradingView platform. Let’s break down the analysis of this chart:
1. Chart Overview
• Trading Pair: SHIB/USDT
• Timeframe: Daily (1D)
• Current Price: 0.00001296 USD
• Price Change: +0.00000151 USD (+1.7%)
• Date Range: The chart covers December 2024 to September 2025.
• Indicator: RSI (Relative Strength Index) is displayed at the bottom of the chart.
2. Technical Analysis
a) Support and Resistance Levels
• Demand Zone: Around 0.00001296 USD (marked with the horizontal “DEMAND” line). This level indicates a zone where the price has previously bounced back up and is now acting as support.
• Supply Zone: Around 0.00001800 USD (marked with the horizontal “SUPPLY” line). This level represents resistance where the price has faced selling pressure in the past.
• Point of Interest (POI): Positioned between these two levels, indicating a potential equilibrium zone or a pivot point for price action.
b) Price Trend
• Past Trend: From December 2024 to early May 2025, the price was in a general downtrend, reacting multiple times to the demand zone.
• Break Below Demand: In early May 2025, the price broke below the demand zone, dropping to around 0.00001050 USD.
• Price Recovery: Starting mid-June 2025, the price began to rise and has now returned to the demand zone (0.00001296 USD). This recovery could indicate buyer strength at this level.
• Next Target: If the price can move upward from the demand zone, the next target would be the supply zone at 0.00001800 USD.
c) RSI Indicator
• Current RSI Status: The RSI is currently around 50, indicating a neutral state (neither overbought nor oversold).
• RSI Trend: Since early June 2025, the RSI has been trending upward alongside the price increase, suggesting growing bullish momentum.
• Key RSI Levels: If the RSI rises above 70, it may enter overbought territory, potentially signaling a price reversal. Conversely, a drop below 30 could indicate weakness and a possible further decline.
d) Price Patterns
• Double Bottom Pattern: In late May 2025 and early June 2025, the price hit the 0.00001050 USD level twice before rising. This pattern can signal a bullish reversal.
• Break of Downtrend Line: In June 2025, the price broke above a descending trendline (drawn from previous highs) and has since moved upward. This breakout confirms a shift to a bullish trend.
3. Order Block Analysis
• Buy Signal: At the 0.00001296 USD level, a buy signal is displayed. This suggests that this level is identified as a good entry point for buying.
• Sell Signal: There’s also a sell signal at the same 0.00001296 USD level. This might indicate market indecision at this level, but given the recent upward movement, the buy signal carries more weight.
4. Possible Scenarios
a) Bullish Scenario
• If the price can hold the demand zone (0.00001296 USD) and move upward, the next target would be the supply zone at 0.00001800 USD.
• Breaking the supply zone could push the price to higher levels (e.g., 0.00002000 USD or more).
• The rising RSI and the break of the downtrend line support this scenario.
b) Bearish Scenario
• If the price fails to hold the demand zone and falls below 0.00001296 USD, it could head toward the next support level at 0.00001050 USD.
• A neutral or declining RSI and increased selling pressure could confirm this scenario.
5. Trading Suggestion
• Entry Point: Given the buy signal at 0.00001296 USD and the recent upward movement, entering a long (buy) position could be reasonable.
• Take Profit: The supply zone at 0.00001800 USD could be the first target (around 39% profit).
• Stop Loss: Below 0.00001050 USD (around 19% loss) for risk management.
• **Riskവ: Risk-to-Reward Ratio: This trade offers a risk-to-reward ratio of about 1:2, which is acceptable.
6. Conclusion
The price of SHIB/USDT is currently at a critical juncture. The return to the demand zone and the break of the downtrend line suggest potential for a continued uptrend, but the price needs to consolidate above 0.00001296 USD to confirm this trend. The RSI is neutral and requires further movement to confirm bullish or bearish momentum. Traders should proceed with proper risk management and monitor price action at key levels.
If you need further analysis or additional information, I’d be happy to help!

Which event will prevail?!I personally see the ascension path as more likely, because the Shiba community supports it with a particular fervor.

Short trade
5min TF overview
🟥 Sell-side Trade Log
📉 Pair: SHIB/USDT
🏷️ Type: Intraday | LND to NY Session AM
🧠 Setup: Liquidity Sweep & Time-Based Breakdown
📅 Date: Tuesday, 27th May 2025
🕘 Time: 9:45 AM
🔹 Entry Price: 0.00001457
🔹 Profit Target: 0.00001404 (+3.645%)
🔹 Stop Loss: 0.00001459 (-0.14%)
🔹 Risk-Reward Ratio: 26.5
🔍 Reasoning:
The trade setup leveraged time-based volatility dynamics around the 9:30 AM window, a high-activity period during the London to New York session crossover. A clear liquidity sweep at session highs confirmed sell-side momentum.
Entry 30sec (2.33%) Potential
9.30am to 10.30 am window

SHIB: Watch this level!Trading Setup
If you’re considering trading SHIB, here’s a quick setup that may help you.
The idea is: Buy when the price breaks above $0.0000185 and take profits at the levels shown in the chart.
Targets:
1. $0.00002
2. $0.0000235
3. $0.000028
-------------------------------------------
About our trades:
Our success rate is notably high, with 10 out of 11 posted trade setups achieving at least their first target upon a breakout price breach (The most on TW!). Our TradingView page serves as a testament to this claim, and we invite you to verify it!

Short trade
🟥 Sell-side Trade Log
📉 Pair: SHIB/USDT
🏷️ Type: Intraday | LND Session AM
🧠 Setup: Liquidity Sweep & Breakdown
📅 Date: Sunday, 26th May 2025
🕗 Time: LND Session AM
🔹 Entry Price: 0.00001433
🔹 Profit Target: 0.00001401 (+2.23%)
🔹 Stop Loss: 0.00001440 (-0.49%)
🔹 Risk-Reward Ratio: 4.57
🔍 Reasoning:
A New York session high was swept during the Tokyo session, triggering a liquidity trap. This was quickly followed by strong sell-side pressure, validating the setup for a lower low. The LND session entry capitalised on directional momentum as market structure broke to the downside

ChannelsOn the hourly chart, SHIB has recently tested the 200 EMA(in orange) unsuccessfully two times. As of this time, it is consolidating under the 200 EMA again. The testing and rejecting of the 200 EMA has seem to form a parallel channel. Failure of the 200 EMA again, can lead to price drop to possibly 0.00001428 or lower. We need a break out from the 200 EMA with Higher Highs and Higher Lows.

SHIB levelI have been watching this level on SHIB and it has been holding for a while. I think it's a good level with potential of something big.

Lingrid | SHIBUSDT Potential Rally to Key Resistance ZoneBINANCE:SHIBUSDT is consolidating above the key support at 0.00001373, sitting right at the intersection of the upward trendline and a major structure retest. A wedge pattern suggests cooling pressure, with the setup favoring a bullish breakout if buyers step in near this confluence. The key target lies in the 0.00001727 zone, aligning with prior highs inside the resistance channel. A breakdown below trendline support would invalidate this bullish outlook.
📈 Key Levels
Buy zone: 0.00001350 – 0.00001373
Buy trigger: breakout above wedge and upward trendline defense
Target: 0.00001727
Sell trigger: close below 0.00001350
💡 Risks
Weak volume on breakout may signal a fake move.
Sudden volatility from BTC could derail recovery.
Failure to hold the trendline flips structure bearish.
Traders, if you liked this idea or if you have your own opinion about it, write in the comments. I will be glad 👩💻


Short trade
🟥 Sell-side Trade Log
📉 Pair: SHIB/USDT
🏷️ Type: Intraday | LND Session PM
🧠 Setup: Breakout / Liquidity Sweep
📅 Date: Friday, 23rd May 2025
🕕 Time: 6:00 AM
🔹 Entry Price: 0.00001555
🔹 Profit Target: 0.00001440 (+7.40%)
🔹 Stop Loss: 0.00001564 (-0.58%)
🔹 Risk-Reward Ratio: 12.78
🔍 Reasoning:
This sell-side trade was executed following a sweep of local buy-side liquidity and a rejection from overhead resistance during the LND session. Price action confirmed the shift in order flow with strong bearish momentum and displacement to the downside. The entry capitalised on a microstructure break and the presence of a nearby Fair Value Gap (FVG), targeting inefficiency below.

Analysis shib in Neo wave method strategy for d times Shib Aegean fractal time for majority waves
Top price for 786 fbr
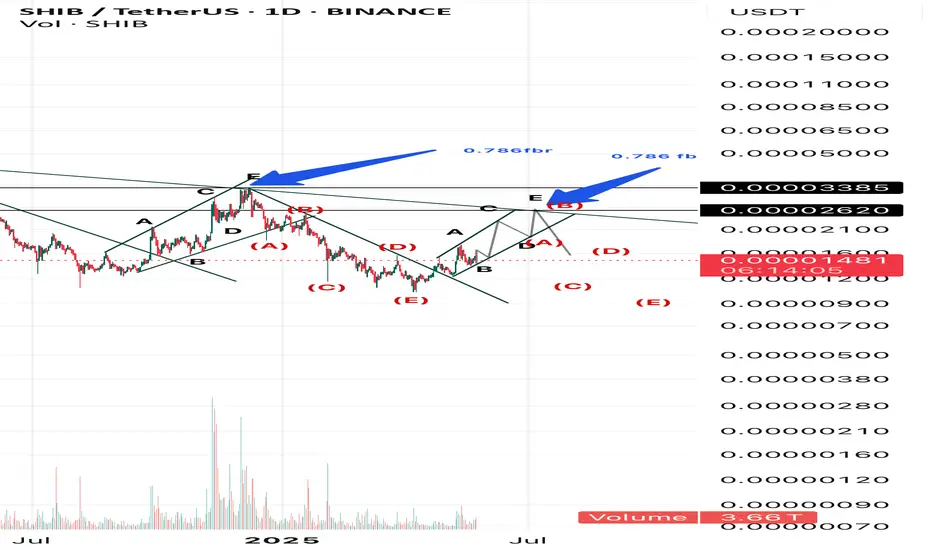
SHIB'S FUTUREMy scenario is like this.
* The purpose of my graphic drawings is purely educational.
* What i write here is not an investment advice. Please do your own research before investing in any asset.
* Never take my personal opinions as investment advice, you may lose your money.

Long trade
1Hr TF overview
🟩 Buyside Trade Log
📈 Pair: SHIB/USDT
🏷️ Type: Intraday | NY Session PM
🧠 Setup: Wyckoff Accumulation (Breakout Phase)
📅 Date: Monday, 19th May 2025
🕐 Time: 1:00 PM (1.55 pm)
🔹 Entry Price: 0.00001393
🔹 Profit Target: 0.00001535 (+10.19%)
🔹 Stop Loss: 0.00001388 (-0.36%)
🔹 Risk-Reward Ratio: 28.4
🔍 Reasoning:
The trade was structured around the Wyckoff Accumulation narrative, where the price completed its consolidation phase and transitioned into a breakout from the resistance ceiling. This move followed clear signs of absorption, a spring phase, and confirmation via higher lows within a trading range. Volume confirmed the breakout leg during the NY PM session.
5min TF entry
Observe the failed first attempt (which provided the consolidation range) and added further conviction to the buy-side entry 2nd attempt.

SHIB/USDT Potential UpsidesHey Traders, in today's trading session we are monitoring SHIB/USDT for a buying opportunity around 0.00001420 zone, SHIB/USDT is trading in an uptrend and currently is in a correction phase in which it is approaching the trend at 0.00001420 support and resistance area.
Trade safe, Joe.

Shiba Inu Crypto: A Useless Coin That Can Still Make You RichHey everyone, welcome back to a new supply and demand crypto analysis. Today, I will analyse one of the most unexpected — but potentially lucrative — investment opportunities in the crypto space right now: Shiba Inu Metaverse crypto.
Yeah, I know what you’re thinking… “Isn’t Shiba Inu just another meme coin?”
And yes, fundamentally, it’s not trying to solve world hunger or revolutionise finance. But guess what? You don’t need a coin to be helpful to make money from it.
All you need is to understand price action and supply and demand. That’s it.
What is Shiba Inu?
So let’s break it down. Shiba Inu started as a meme — a direct competitor to Dogecoin. It’s an ERC-20 token on the Ethereum network with a massive circulating supply and a huge following. Over time, it has evolved and launched its own ecosystem — including Shibarium, SHIB: The Metaverse, and other utilities.
But let’s be real: Shiba Inu is not about real-world utility. It’s about speculation, community hype, and timing the market right based on simple but powerful trading concepts.
Daily Timeframe is Trending UP
Right now, things are shifting in our favour on the daily timeframe. We’ve just entered an uptrend — a key change in market structure — and more importantly, we’ve got a new imbalance forming around $0.00001320. This is the next key level where we’re waiting to re-enter the market.
Why wait? Because smart investors don’t chase candles. They wait for the price to return, where demand will likely kick in again. That level is $0.00001320. Once price returns there and confirms demand, we buy — and we ride the next wave.

Long trade🟩 Buyside Trade Log
📈 Pair: SHIB/USDT
🏷️ Type: Intraday | NY Session PM
🧠 Setup: Breakout
📅 Date: Monday, 19th May 2025
🕜 Time: 1:30 PM
🔹 Entry Price: 0.00001393
🔹 Profit Target: 0.00001448 (+3.95%)
🔹 Stop Loss: 0.00001388 (-0.36%)
🔹 Risk-Reward Ratio: 11.00
🔍 Reasoning:
The trade was triggered during the NY PM session following a breakout from local consolidation. Price action demonstrated strong bullish intent with a clean sweep of near-term resistance and no immediate supply overhead
30min TF
