SHIB To start exiting the downtrend, Shiba must first break its downtrend line and reach and cross the 0.00001856 area, which is also an important resistance.
Unfortunately, in the daily time frame and in the range of 0.00001916, the probability of a death cross is very high, and if it happens, a worse downtrend will be expected.
But if it can close a strong candle above 0.00002123 in the 8-hour time frame, the death cross will be invalidated.
My targets for the next 2 months for Shiba can be 0.00004807 and 0.00007078.
In the event of a correction and market decline, the number 0.00001028 will be available.
Shiba is dependent on the positive movement trend of Ethereum, so it can be said that with the rise of Ethereum, Shiba will also be bullish.
SHIBUST trade ideas

Shiba Inu About To Make Strong Up MoveShiba Inu (SHIB) Poised for Breakout: Triangle Pattern Signals Strong Upward Momentum
Shiba Inu is generating significant buzz in the crypto market as technical indicators, particularly a bullish triangle pattern, suggest an imminent upward surge. Here’s a breakdown of the key factors driving this optimism:
1. Bullish Triangle Patterns Fuel Optimism
Analysts have identified multiple bullish chart formations, including a symmetrical triangle and falling wedge, which historically precede significant price breakouts. For instance:
Javon Marks highlighted a bullish triangle pattern, projecting a 258% rally toward $0.000081 1.
CryptoElites speculates an even more aggressive target of $0.0023 (100x gains) if the pattern confirms 1.
A falling wedge on SHIB’s daily chart aligns with a potential breakout to
0.00003340
∗
∗
(
N
o
v
e
m
b
e
r
2024
h
i
g
h
)
o
r
∗
∗
0.00003340∗∗(November2024high)or∗∗0.0000455 (March 2024 peak) 10.
2. Technical Indicators Reinforce Momentum
Resistance Breakthrough: SHIB recently broke above a critical resistance level at $0.00002238, signaling strong buyer dominance and setting the stage for further gains 14.
Descending Wedge Reversal: A bullish reversal pattern forming on the weekly chart suggests SHIB could target $0.000066651 (cup-and-handle breakout) 5.
Fibonacci Retracement Levels: Trading near key Fibonacci levels, SHIB is positioned for a trend reversal if market conditions stabilize 3.
3. Ecosystem Growth and Whale Activity
Shibarium Network: The Layer-2 solution’s expansion, including swaps and bridges, is enhancing SHIB’s utility and adoption 7.
Whale Accumulation: Large holders now control over 20% of SHIB’s supply, with netflows surging to 665 billion SHIB, signaling institutional confidence 714.
Token Burns: The community’s aggressive burn strategy (1.2+ billion SHIB monthly) aims to reduce supply and boost scarcity-driven value 112.
4. Price Targets and Market Sentiment
Analysts are divided on the magnitude but agree on upward potential:
Short-Term: Targets range from
0.00003236
∗
∗
(
d
e
s
c
e
n
d
i
n
g
c
h
a
n
n
e
l
b
r
e
a
k
o
u
t
)
t
o
∗
∗
0.00003236∗∗(descendingchannelbreakout)to∗∗0.00009623 by July 2025 111.
Long-Term: Ambitious projections suggest
0.0001
∗
∗
–
∗
∗
0.0001∗∗–∗∗0.000155 by late 2025, contingent on sustained momentum 511.
5. Risks to Consider
Bearish Flags: A recent 60.59% dip in burn rates and a bearish flag formation could delay the rally if selling pressure intensifies 12.
Macro Factors: Broader market volatility, regulatory shifts, and competition from newer meme coins (e.g., Fartcoin, Pudgy Penguins) pose challenges 610.
Conclusion: A Critical Juncture for SHIB
Shiba Inu stands at a pivotal moment. While technical patterns and ecosystem developments align for a bullish surge, investors must monitor key resistance levels (
0.000020
0.000020∗∗–∗∗0.000022) and macroeconomic trends. The combination of whale activity, token burns, and Shibarium’s growth provides a strong foundation, but discipline and risk management remain essential in navigating SHIB’s volatile landscape.

Lingrid | SHIBUSDT potential BULLISH Momentum is BuildingThe price has perfectly fulfilled my previous forecast . BINANCE:SHIBUSDT market has broken through the range zone, initiating an impulse move and subsequently forming a new range zone in the shape of a triangle pattern. This squeeze suggests that an expansion is imminent. Currently, I think the market is in the accumulation phase around the level of 0.000015. We observed a significant long-tailed bar that rejected the support level, which indicates a strong buying zone. I anticipate that the market to pull back towards this support level before moving upward, provided we see a buy confirmation. My goal is resistance zone around 0.00001970
Traders, if you liked this idea or if you have your own opinion about it, write in the comments. I will be glad 👩💻

SHIB - Posb Long Idea If we do reclaim 0.017$ ~ with good volume that's good be a potentional buy signal

SHIB vs PEPE! Who will fall first?Pretty Obvious for me they both look weak as a stick to me. Nothing much to explain when overall stances are negative for me! Plan your trades accordingly

TradeCityPro | SHIBUSDT $1 Target ?👋 Welcome to the TradeCityPro channel!
Let’s analyze Shiba, one of the most famous meme (shitcoins) in cryptocurrency, which has changed many lives for better or worse to see if it can reach $1.
🌐 Overview Bitcoin
Before analyzing today’s altcoin, let’s take a look at Bitcoin on the one-hour timeframe. It is breaking the 96,330 support, and if our RSI enters the oversold zone, we might see a move down to the 92,701 support.
Along with this, one of the scenarios I mentioned last night is playing out—Bitcoin dominance is increasing as Bitcoin drops. Even though I personally feel this dominance increase is fake, it will still lead to further declines in altcoins.
📈 What is Market Cap?
Before starting the analysis, I want to clarify the concept of market capitalization. Market cap refers to the total value of a cryptocurrency in the market and is calculated using the formula:
Circulating supply × current price
For example, if a cryptocurrency has 100 million coins in circulation and each coin is worth $5, its market cap would be $500 million.
Market cap determines a project’s dominance and size, helps compare cryptocurrencies, and serves as a measure of risk and growth potential. High market cap projects have lower risk but grow slower, while low market cap projects carry more risk but have higher growth potential.
Why am I explaining this? So that you understand how to verify if someone claims that Shiba will reach $1. Look at its token supply and market cap. A simple calculation shows that for SHIB to reach $1, its market cap would need to be $589 trillion while the total market cap of gold is only $19 trillion! Don’t fall for misleading advertisements, stay informed!
📊 Weekly Timeframe
Like most crypto coins, SHIB spent a long time inside its weekly range, with the upper limit at 0.00001171. After spending 620 days inside this range, it finally broke out with higher lows and momentum, starting an uptrend.
After this rare bullish move, SHIB hit 0.00003279, rejected from it, and retraced to the 0.00001296 support. It then moved back up but got rejected from the same resistance, reinforcing its importance and forming an equal high, which can be seen as a double-top pattern.
This double-top pattern, which is well-known and widely used, is typically a bearish signal indicating a trend reversal. However, we cannot officially call it a double-top until the 0.00001296 support is broken. That’s why I haven’t drawn it yet.
If 0.00001296 breaks, the double-top target will be its risk-to-reward ratio of 1, meaning we could see a move down to 0.0000067.
For buying, I will never buy SHIB, no matter how much profit it makes. If I want to speculate on shitcoins, I’ll go for ones with lower market caps. And remember, if a shitcoin is meant to make you rich, it will do so even with just $10, so you don’t need a large investment :))
For selling, I suggest exiting below 0.00001296, at least temporarily. Later, if the trend turns bullish, you can buy back the same amount of USDT, potentially avoiding further downside.
📝 Final Thoughts
Stay calm, trade wisely, and let's capture the market's best opportunities!
This analysis reflects our opinions and is not financial advice.
Share your thoughts in the comments, and don’t forget to share this analysis with your friends! ❤️

SHIBA update#SHIBA made a clear pattern of a expanding diagonal that was the first wave
we had some demand zones on this wave which could stop the market from going deeper but they didnt work so the market was targeting the stacked volume in lower prices and finally took it now one of those demand zones is working as a flip zone if the market be able to cross it so it can rise to the next stacked volume zone !

Shiba-Inu announced a partnership with the UAE's governmentShiba Inu announced a partnership with the UAE's government
Yesterday, Shiba Inu announced a partnership with the UAE's government to drive digital transformation across energy and infrastructure.
The partnership marks the first time a world government is integrating blockchain at a federal level, claims the Shiba Inu team.
Despite prevailing market uncertainty, there are indications that SHIBA's price could see a short-term increase.
Technical Analysis:
The price has completed a "Bullish Contracting Triangle Pattern," suggesting the potential for a bullish wave in the coming hours and days.
The targets currently set may be conservative, as there is potential for further upside.
Key Resistance areas:
0.0000168887
0.0000175495
0.0000187666
You may find more details in the chart!
Thank you and Good Luck!
❤️PS: Please support with a like or comment if you find this analysis useful for your trading day❤️

SHIBUSDT Price Action - Liquidity & Order Block AnalysisPremium Zone Rejection:
Price is approaching a FVG (Fair Value Gap), which could act as a resistance zone.
If rejection occurs, smart money may be engineering liquidity to take out lower levels.
Liquidity Levels to Watch:
Feb 3 High (0.000016980): A significant level where liquidity is resting. A potential raid could occur if price breaks structure to the upside.
Feb 2 Low (0.000013080): A key downside liquidity pool where price may seek orders.
Feb 3 Low (0.000011590): The ultimate downside draw on liquidity if price continues distributing lower.
Possible Scenarios:
Bullish Case: A clean break and hold above 0.000015764 could lead to a liquidity grab towards the Feb 3 High.
Bearish Case: Failure to reclaim the fair value gap could send SHIB lower to test 0.000013080, possibly even targeting the Feb 3 Low.

Long trade
15min TF overview
Buyside trade
Mon 3rd Feb 25
NY Session AM
1. 45 pm
Entry 0.000015682
Profit level 0.000018691 (19.19%)
Stop level 0.000015628 (0.34%)
RR 55.72
Reason: Observing the full structure of SHIB and incorporating the Wyckoff narrative—specifically Phase A (Selling Climax) and Phase B (Secondary Retest)—was pivotal in mapping directional bias for the buyside trade.

SHIBUSDT Long Trade Setup📊 Price Action & Trend Analysis
Analyzing market trends using price action, key support/resistance levels, and candlestick patterns to identify high-probability trade setups.
Always follow the trend and manage risk wisely!
Price Action Analysis Interprets Market Movements Using Patterns And Trends On Price Charts.
👉👉👉Follow us for Live Market Views/Trades/Analysis/News Updates.

Long trade
4hr TF overview
Buyside trade 1
Sun 2nd Feb 25
LND to NY Session AM
11.00 am
Entry 0.000015469
Profit level 0.000017276 (11.68%)
Stop level 0.000015273 (1.27%)
RR 9.22
Reason: overnight drop (12.82%)
Whykoff narrative: I assumed we reached the Selling climax..?
Indicative of a buyside trade.
Observed 4Hr TF

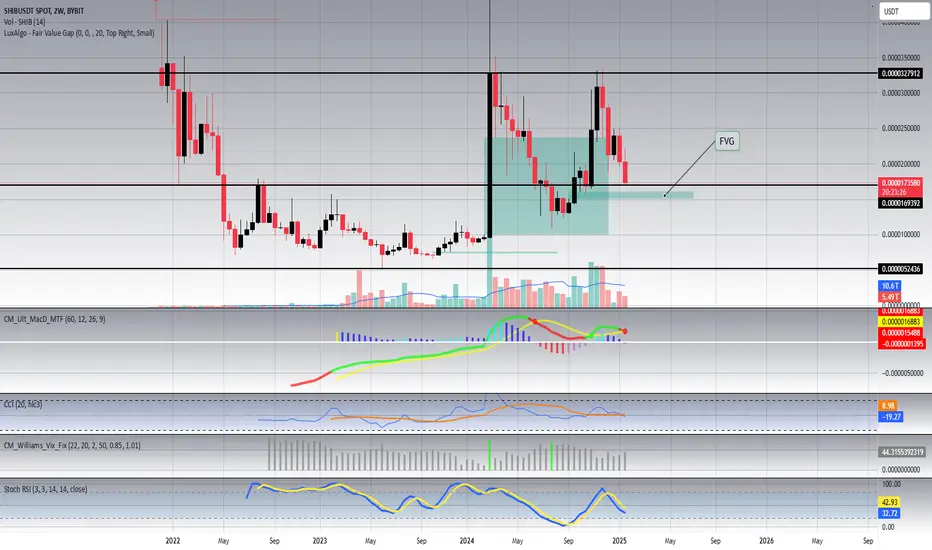
Bearish Activity SHIB on the 2 Week Chart is very bearish. Last candle was a bearish momentum candle and this candle forming is in the red. What also complicates matters, is the bearish MACD(Chris Moody) crossover that recently happen last candle. If the key level 0.00001693 and the fair value gap underneath don't stop the pain, SHIB can possibly go much lower. Please be careful and do your own research.
Short trade
1Hr TF
Overview
Sellside trade
Sat 1st Feb 25
NY Session AM
11.00 am
Entry 0.000018188
Profit level 0.000017820 (3.08%)
Stop level 0.000018357 (0.93%)
RR 2.18
Reason: Observation of supply dominance on the 1Hr TF
Target liquidity lows

SHIBA update#SHIBA can make another down wave because it made a triangle with 5 waves
there is a down wave before the triangle which is wave A
the whole triangle is wave B
now we are waiting for wave C
its the last correction before making new highs
check out our last analysis on shiba in higher time frames

SHIBA update#SHIBA has a positive pattern NOW !
the market made an ABC correction pattern with a triangle pattern as its wave B if you check out my last analysis on this coin i told you that if the demand zone be touched bullish duration will be strated !

Long trade
15min TF entry
Buyside entry
NY Session PM
4.00 pm
15min TF
Based on the inverted Pin bar
Observation of current price action
PD Array Zones of Influence above 0.5
BOS Brk
Thu 30th jan25
Entry 0.000018713
Profit level 0.000019223 (2.73%)
Stop level 0.000018607 (0.57%)
RR 4.81

Long trade
1Hr TF Entry
Sellside Trade
Pair SHIBUSDT
1min TF
Thu 30th Jan 29
11.00 pm
LND to NY Session PM
Entry 0.000018733
Profit level 0.000019319 (3.13%)
Stop level 0.000018630 (0.55%)
RR 5.69
Buyside trade: Buyside entry is based on the narrative of supply and demand and because of the current observation and momentum of buyside pressure observed with SHIB since the 28th of January 2025.

Short trade
1min TF
Sellside Trade
Pair SHIBUSDT
1min TF
Thu 30th Jan 29
8.30 am
LND to NY Session AM
Entry 0.000018688
Profit level 0.000018576 (0.60%)
Stop level 0.000018725 (0.20%)
RR 3.03
Target equal lows (1min TF observation)
Reason: Price buyside momentum reached exhaustion and pivotal 4Hr supply zone indicative of a sellside trade

Long trade
1Hr TF Entry
Tue 28th Jan 25
NY to Toyko Session PM
5.30 pm
Buyside trade idea
Entry 15min TF
Entry 0.000017939
Profit level 0.000018705 (4.87%)
Stop level 0.000017779 (0.89%)
RR 4.79
Reason: It appears SHiB reached a pivotal demand level with buyside momentum trending to the upside.


SHIB: Big reversal could be around the corner!An inverted head and shoulders pattern is becoming more apparent, signaling a bullish reversal. A significant price reversal may be imminent! If you're looking to trade SHIB at the moment, here's a quick setup that you might find helpful!
The idea is: Buy when the price breaks above $0.000025 and take profits at the levels shown in the chart.
Targets:
1. $0.000028
2. $0.000032
3. $0.000038
4. $0.000045
-------------------------------------------
About our trades:
Our success rate is notably high, with 10 out of 11 posted trade setups achieving at least their first target upon a breakout price breach (The most on TW!). Our TradingView page serves as a testament to this claim, and we invite you to verify it!

Long trade
15min TF overview
Buyside trade
NY to Tokyo Session PM
Mon 27th Jan 25
6.45 pm
Structure Day
Entry 0.000018925
Profit level 0.000019926 (5.29%)
Stop level 0.000018725 (1.06%)
RR 5
The buy-side trade idea is based on the narrative of the supply-and-demand structure on the Day TF.
1Hr TF overview
Entry 15min
