SHIBUSDT.1DAfter thoroughly analyzing the chart, I’ve observed key technical dynamics in SHIB/USDT’s price action, which suggest significant upcoming opportunities depending on market conditions.
Trend Analysis
SHIB is currently in a gradual uptrend, supported by the ascending trendline (S1). This indicates that buyers are stepping in consistently at higher levels, which is a positive sign for maintaining bullish momentum. However, the price is consolidating between critical resistance (R1) and support levels, reflecting a period of indecision.
Support & Resistance Levels
Resistance 1 (R1): $0.00003255
This level has acted as a strong rejection zone in the past, and a breakout above it is crucial for further upside potential.
Resistance 2 (R2): $0.00004563
The upper resistance level marks a significant target if bullish momentum gains strength beyond R1. This would also align with previous highs.
Support 1 (S1): $0.00002156
This is the current support provided by the ascending trendline. A breakdown below this level could weaken the bullish structure.
Support 2 (S2): $0.00001638
This represents a historical support level and a key zone to watch in case of a bearish breakdown.
Technical Indicators
MACD (12,26,Close):
The MACD line is close to the signal line, with the histogram showing minimal momentum. This indicates a neutral state, with neither bulls nor bears dominating at the moment.
RSI (14,Close):
The RSI is currently at 44.00, slightly below neutral but not yet oversold. This suggests that the price still has room to rebound if buyers step in.
Chart Patterns & Price Action
The price action suggests higher lows along the ascending trendline (S1), reinforcing a bullish bias. However, the inability to break through R1 in recent attempts indicates strong selling pressure at higher levels.
A potential bullish breakout is forming, as indicated by the upward arrow in the chart. If the price holds above S1, the likelihood of retesting R1 and eventually R2 increases significantly.
Projection & Scenario Analysis
Bullish Scenario:
A successful breakout above R1 ($0.00003255) would likely lead to a test of R2 ($0.00004563).
Sustained bullish momentum could even push SHIB higher, potentially targeting levels near $0.00006500, aligning with previous rallies.
Bearish Scenario:
If SHIB fails to hold above S1, a breakdown could lead to a test of S2 ($0.00001638).
A failure to hold S2 would signal a deeper correction, with potential downside targets near $0.00001000.
Conclusion
In conclusion, SHIB is trading in a pivotal zone. While the ascending trendline (S1) supports the bullish outlook, the inability to break R1 suggests caution. I remain cautiously optimistic, expecting a breakout above R1 if S1 continues to hold. However, I would closely monitor the support levels for any bearish breakdowns.
For now, patience is key, as confirmation of a breakout or breakdown will dictate the next significant move.
SHIBUST trade ideas

SHIB 50% profitThis chart presents a trading opportunity for SHIB/USDT with clear take-profit (TP) levels and a promising uptrend cycle. 📈
Analysis:
The yellow moving average (MA) highlights a trend shift to bullish momentum. SHIB's price has crossed this line, indicating a potential breakout. 🚀
A strong support level is visible near 0.00002139, preventing further downside. 🛡️
The green zone represents the risk-free entry point, suggesting limited downside risk if proper stop-loss levels are respected. ✅
Targets are clearly defined:
TP1: 0.00002373 🎯
TP2: 0.00002641 🥈
TP3: 0.00003212 🥇
A big uptrend cycle suggests SHIB could reach these targets as it attracts more buyers. 🐂
Strategy:
Entry Zone: Current price levels around 0.00002139 are favorable for opening long positions. 💹
Stop Loss: Place at 0.00002019 to limit risks. 🛑
Profit-Taking: Gradually secure gains at each TP level. 📊
Market Sentiment:
Volume bars show increasing participation, signaling that buyers are stepping in. If this continues, SHIB is likely to hit its targets. 🔥
Final Note:
This is a low-risk, high-reward setup based on technical indicators and market structure. Always monitor the market for sudden changes and stick to your plan. ⚠️

Shiba Inu Burn Rate Slips 72%; What’s Next for SHIB Price?The Shiba Inu community’s consistent efforts to reduce token supply hit a snag recently, as the burn rate plummeted 72% in just 24 hours. This decline has raised concerns among investors, particularly as SHIB’s price experienced a simultaneous dip amid a broader crypto market selloff. However, there are signs that SHIB’s future may not be as bleak as it seems, with both technical and fundamental factors coming into play.
Shiba Inu Burn Rate: A Key Market Indicator
Token burns have been a critical part of the Shiba Inu ecosystem, aimed at reducing supply and creating scarcity to drive up the token’s value. Over 2024, the community successfully burned 44.62 billion tokens, demonstrating strong commitment despite challenges.
Recent data from Shibburn reveals that the burn rate fell by 71.56% in the last 24 hours, with only 8.73 million SHIB tokens burned. The two largest burns, conducted by the same account, totaled just under 900,000 tokens. While this represents a sharp decline, it’s worth noting that the burn rate over the past seven days surged 164.53%, with over 102.86 billion tokens removed from circulation. These mixed signals highlight the need for careful analysis of SHIB’s potential trajectory.
Technical Analysis
As of now, SHIB is trading at $0.0000213, up 0.40% in the past 24 hours. The Relative Strength Index (RSI) sits at 33, indicating oversold conditions. This suggests a potential reversal if buying pressure increases. Immediate support is identified at $0.0000180, which could serve as a critical demand zone.
However, SHIB’s price movement is closely tied to Bitcoin’s performance. Should BTC dip to the $70,000-$80,000 range, SHIB’s support level may flip into a resistance zone, leading to further price declines. On the flip side, SHIB Futures Open Interest rose 34%, signaling strong market momentum that could drive a recovery if broader market conditions improve.
Ecosystem Developments
Shiba Inu’s fundamentals are also evolving, with new developments boosting market sentiment. Lead Developer Shytoshi Kusama recently outlined a vision for transforming SHIB from a meme coin to a “Shib Network State,” emphasizing the utilities of ecosystem tokens like SHIB, BONE, LEASH, and the soon-to-be-launched TREAT.
The TREAT token, set to launch on January 14, has generated significant excitement within the community. Many analysts believe this could catalyze SHIB’s price recovery, especially if paired with broader market improvements. Additionally, the Shiba Inu community’s continued dedication to burning tokens remains a cornerstone of its strategy to enhance value.
Market Sentiment and Broader Trends
The general crypto market sentiment remains bearish, with the Fear and Greed Index dropping to 42. Despite this, SHIB has shown resilience, rising 0.47% in the last trading session—a modest gain but notable in a declining market.
Conclusion
While the sharp decline in Shiba Inu’s burn rate raises concerns, the token’s oversold technical indicators and ongoing ecosystem developments suggest potential for recovery. Investors should closely monitor key support levels, Bitcoin’s price action, and upcoming milestones like the TREAT token launch. With strong community backing and strategic advancements, SHIB may yet reclaim its momentum in the evolving crypto landscape.

SHIB Accumulating for the Next Bullish Surge
SHIB is currently retracing within its ascending channel, approaching the key long entry zone around 0.00001623 🧐
This correction aligns with strong Fibonacci levels, providing a solid base for the next upward move 📈
🎯 Targets Post-Correction:
1TP: 0.00002800
2TP: 0.00003500
3TP: 0.00004170
The retracement is a healthy sign of accumulation before SHIB continues its bullish trend 🚀

SHIB is gonna range for now!CRYPTOCAP:SHIB
Shib might started to be in a parallel channel which means price will range for now!
Nothing else can be expected for now.😒😒😒
⚠️ Disclaimer:
This is not financial advice. Always manage your risks and trade responsibly.
👉 Follow me for daily updates,
💬 Comment and like to share your thoughts,
📌 And check the link in my bio for even more resources!
Let’s navigate the markets together—join the journey today! 💹✨

Wave 3We are in wave 3 of 3. The end of this wave is the ceiling of the previous Shiba movement.
We are waiting for higher ceilings for wave 5.

Shiba Inu 5X LONG Leveraged Trade-Setup (1,605% Potential)I hope you've been reading the other trade-ideas. One post builds up on the previous one.
Good afternoon my fellow trader, how's your day?
I hope you are doing great.
It's been the longest time ever since we considered a Shiba Inu LONG position with leverage. Last time was in November 2023. Should we venture to try again now, new and fresh, in this year 2025? Of course, that's why you are here.
This is medium-risk. We have a stop-loss but these trades are meant as hit or miss. Either the chart setup works or it doesn't. That's how it see it. But you can use the numbers in whatever way you see fit.
My intention is to share the setup, hopefully with good timing. Expecting that you can take care to adjust your margin and manage your position in a way that the end result is positive. In a way that we end up with a winning trade.
Full trade-numbers below:
__
LONG SHIBUSDT
Leverage: 5X
Entry levels:
1) $0.00002525
2) $0.00002303
3) $0.00002072
Targets:
1) $0.00002610
2) $0.00002770
3) $0.00003019
4) $0.00003337
5) $0.00003687
6) $0.00003904
7) $0.00004254
8) $0.00004822
9) $0.00005226
10) $0.00005739
11) $0.00006701
Stop-loss:
Close weekly below $0.00002000
Potential profits: 885%
Capital allocation: 3%
___
Many of the pairs we track moved ahead. ADA and XRP are the main examples. After two days of consolidation, these are moving higher. This can indicate that the rest will do the same.
We have the same chart setup for SHIBUSDT as we have for those other pairs.
A bullish wave in late 2024 leading to a correction. The correction ending as a strong higher low and some consolidation. Now we see a bullish resumption/continuation. And we expect higher prices.
If those that moved first, rather than going higher now would produce a retrace, then we would wait for lower prices to start a new LONG position. Since these continue rising, those that are yet to move are more likely than not to do the same.
The next examples are Filecoin (FIL) and Compound (COMP) which I shared just a few hours ago, early in the morning. They broke bullish.
This is it... This is so it... I am sending you so much love.
I love you.
Thanks a lot for your continued support.
Namaste.

ShibaShiba in the daily time frame can have an upward movement to the range of 0.00002670 or 0.000030 according to the wave counting pattern and then come down to the range of 0.00001464 to complete wave C.
The overall trend is bullish and it can hit and cross ATH in the next 1-2 years.

$SHIB TA by GrokAI
Here's a technical analysis of the SHIB/USDT hourly chart:
Price Movement: The price has been in an uptrend, moving from around 0.0000217 to 0.0000250. It's currently facing resistance near the 0.0000250 level, as indicated by the price action at this point.
Volume: Volume spikes are visible at key points, particularly during the upward movements, suggesting strong buying interest. However, volume tends to decrease during periods of consolidation, indicating less conviction in price movements during these times.
MACD: The MACD is currently showing a bearish crossover with the MACD line crossing below the signal line, which could indicate a potential weakening of the uptrend or the start of a correction. The histogram is also starting to show negative values, further supporting this bearish signal.
Support and Resistance Levels:
Support: Around 0.0000228, where the price has previously consolidated before moving higher.
Resistance: At 0.0000250, where the price has faced rejection multiple times.
Trend Analysis: The chart shows a series of higher highs and higher lows, indicative of a bullish trend. However, the recent price action near resistance suggests potential for consolidation or a minor pullback before possibly attempting to break through the resistance.
Potential Entry Points:
Breakout Strategy: If the price breaks above the 0.0000250 resistance level with strong volume, this could be a bullish signal for entering a long position, targeting the next resistance levels or Fibonacci extension levels.
Pullback Strategy: If there's a pullback from the resistance level, look for support around the 0.0000228 level or previous consolidation

Shib coin 1hr potterboxShib coin 1hr potterbox the coin comes up and over the top of the box and is dancing on the roof of the top box. It could be Consolidating maybe getting ready for a big move up or possibly a move down and fill up the empty space just to the left. We shall see

SHIB 24hr potterboxShib coin is following the rest of the pack and breaking out of the box. If I watched this closer I would know more but I just check Shib and hey it's going up.

Trading opportunity for SHIBUSDTBased on technical factors there is a Buy position in :
📊 SHIBUSDT
🔵 Buy Now
🪫Stop loss 0.00002245
🔋Target 0.00002390
📏 R/R 2
💸RISK : 1%
We hope it is profitable for you ❤️
Please support our activity with your likes👍 and comments📝

Long trade
15min TF overview
Buyside trade
Pair SHIBUSDT
Fri 3rd Jan 24
LND Session PM
3.45 pm (NY time)
Entry 0.000022737
Profit level 0.000024069 (5.86%)
Stop level 0.000022561 (0.77%)
RR 7.57
Reason: According to the Whykoff method - Phase D - trending inside the range indicative of a buyside trade.

Shiba Long For Today
During the active morning of Friday Jan 3rd, 2025, Forecasting shiba to be long this morning

SHIBUSDT.1DThe daily chart for Shiba Inu (SHIB) against Tether (USDT) depicts a dynamic and volatile pattern, marked by sharp rises and deep corrections. The chart features key technical indicators and levels that might determine future price actions.
Price Action and Trend:
Shiba Inu's price action has been highly volatile, showcasing significant swings that reflect its speculative nature and sensitivity to market sentiments. The price currently shows a potential recovery from a downturn, aiming for key resistance levels.
Key Technical Levels:
Resistance Levels (R1 and R2):
R1: 0.00003239 - Acts as an immediate barrier for any bullish momentum, potentially attracting sellers or profit-taking.
R2: 0.00004563 - A stronger and more psychologically significant level that could test the bulls' commitment should R1 be decisively broken.
Support Levels (S1 and S2):
S1: 0.00001035 - A crucial level that has historically provided support, suggesting potential buy interest if retested.
S2: A lower boundary not visible on the current chart but likely significant if the downtrend resumes.
Technical Indicators:
MACD: Currently flat with a minimal gap between the MACD line and the signal line, indicating a lack of strong momentum in either direction.
RSI: Near the 40 mark, which is slightly below the midpoint, suggesting a slight bearish bias but not yet in the oversold region.
Volume:
The volume appears subdued, consistent with a lack of decisive movement, indicating that traders are possibly waiting for more concrete signals before taking substantial positions.
Conclusion and Forecast:
SHIB/USDT is at a crucial juncture where it could either rebound off the support level at 0.00001035 or face further declines if sentiment worsens. The approach to R1 will be telling; a strong breakout above this level could prompt a move towards R2, while failure to overcome it may result in a retest of S1 or even lower levels.
Trading Strategy:
Bullish Scenario: Look for entry points if SHIB stabilizes or bounces off S1, with R1 as a short-term target. A stop-loss slightly below S1 can limit downside risk.
Bearish Scenario: If SHIB breaks below S1, it may indicate a continuation of the bearish trend, with lower historical supports in focus. Traders might consider short positions on failed attempts to rise above key resistance levels.
Summary:
Traders should monitor SHIB/USDT closely for signs of increased trading volume or a breakout from its current levels to gauge the direction of the next significant move. The market's response to these technical thresholds will provide valuable insights into the short-term trajectory of Shiba Inu.

SHIBUSDT 6DSHIB ~ 6D
#SHIB If you still have Conviction on this coin,. Buy gradually after retesting this support block, with a target of at least 20%+

How Shiba Inu Could Achieve More Gain in 2025Hello and greetings to all the crypto enthusiasts, ✌
In several of my previous analyses, I have accurately identified and hit all of the gain targets. In this analysis, I aim to provide you with a comprehensive overview of the future price potential for Shiba Inu , 📚🎇
The SHIB token has gained significant attention in recent years, especially during the peak of the bull market when its price surged dramatically. This rise was driven by a flood of investors and widespread media coverage, attracting substantial capital. As with most rapid growth phases, uncertainty soon followed, leaving much of the capital stagnant and unproductive. Despite its current lull, SHIB still holds potential for significant growth if fresh investment flows in. From experience, I've learned that markets, like life, ebb and flow, and understanding when to cut losses is essential for navigating both. In summary, SHIB is in a consolidation phase, but with renewed capital, a strong rally is still possible.
🧨 Our team's main opinion is : 🧨
SHIB experienced rapid growth fueled by investor hype and media coverage, but uncertainty has led to stagnation. Despite this, it still holds significant growth potential, and a new wave of investment could reignite its upward momentum.
Give me some energy !!
✨We invest countless hours researching opportunities and crafting valuable ideas. Your support means the world to us! If you have any questions, feel free to drop them in the comment box.
Cheers, Mad Whale. 🐋

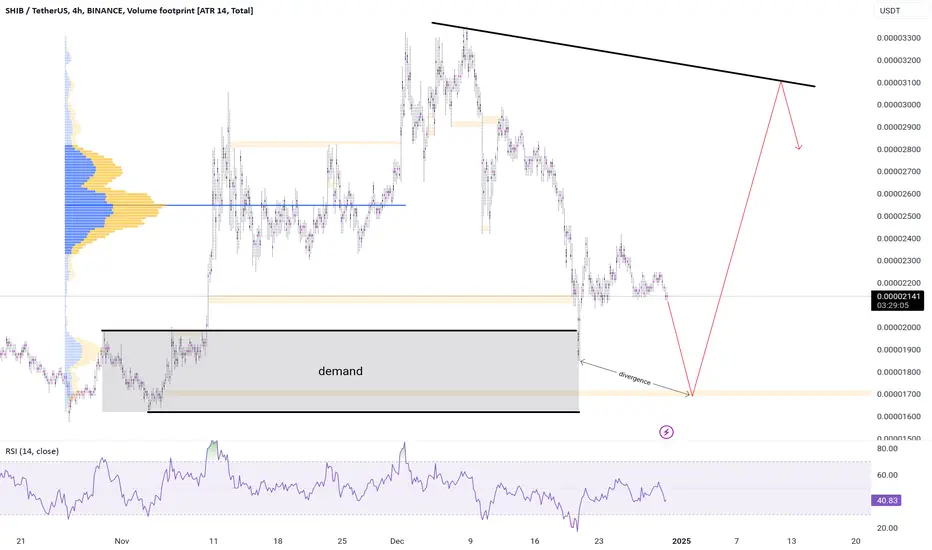
SHIBA last correction #SHIBA can make the last correction the market still has some stacked volume under the price if it corrects to this level there will be a divergence between price and RSI that can raise the market again
SHIBUSDT.1DThe daily chart for Shiba Inu (SHIB) against Tether (USDT) displays a fluctuating price pattern indicative of high volatility and speculative interest in the market.
Price Action and Trend:
SHIB's price action is characterized by significant spikes and troughs, suggesting a market driven by news events and trader sentiment. The chart shows a general uptrend marked by higher lows, but also indicates periods of rapid price increases followed by corrections.
Key Technical Levels:
Resistance Levels (R1, R2):
R1: $0.00003364 - A recent high that may act as a near-term barrier for bullish movements.
R2: $0.00004563 - The peak in the observed period, representing a strong psychological resistance level.
Support Levels (S1, S2):
S1: $0.00001963 - A key support level where the price has shown resilience, potentially a pivot point for reversals.
S2: $0.00001035 - The lowest recent point, which could see more sell-offs if broken.
Technical Indicators:
MACD: Currently in a bearish crossover, as the MACD line is under the signal line, indicating potential downward momentum.
RSI: At around 50, which suggests a neutral market condition, neither overbought nor oversold.
Volume and Market Sentiment:
The volume has been inconsistent, aligning with the volatility in price movements. High volume peaks coincide with price spikes, highlighting reactionary trading behaviors.
Conclusion and Forecast:
Given the current setup, SHIB/USDT shows potential for both upward and downward movements. The market sentiment appears cautiously optimistic but remains susceptible to shifts based on broader market sentiment or specific news related to the Shiba Inu ecosystem.
Trading Strategy:
Bullish Scenario: A sustained move above S1, particularly if volume supports an upward trend, could see SHIB testing R1 and potentially R2. Traders might consider buying near S1 with stops below this level to capitalize on potential rebounds.
Bearish Scenario: A break below S1 could accelerate losses toward S2. Traders could look at shorting SHIB on a break below S1, with R1 as a potential upper limit for stop-loss orders.
Summary:
SHIB/USDT traders should prepare for volatility and be ready to adjust positions based on sudden market moves. Monitoring volume and news related to Shiba Inu will be crucial in gauging the next significant price direction.

SHIBUSDTShibusdt is looking interesting on the Fib level of 50/61.80% areas and if you look properly to 2022 January 25 you will notice a strong demand on this point. I will be looking forward to buying after a bullish confirmation on D1 And D3. Not a financial advice.

Critical point For SHiba SHIBA Will face to Critical point which will shows us is it any Bullish pattern there or not?
if the price resist at pointed level and began new bullish trend then we will consider harmonic pattern

SHIB/USDT Analysis: SHIB is currently gaining momentum within a long-term symmetrical triangle pattern. This consolidation phase suggests a potential breakout, and if SHIB stays above key support levels and bounces off strongly, it could retest its all-time high.
SHIB is close to the apex of the triangle, a crucial point where a decisive move is expected.
Strong upward momentum could target higher levels.
Immediate support is near 0.00002150.
Critical support at 0.00001090 is marked by the dashed red line. It is crucial to stay above this level for bullish continuation.
First Target: 0.00003000
Second Target: 0.00005000
Based on sustained momentum, potentially a retest of levels near 0.00009000.
The symmetrical triangle signals a period of indecision, but a breakout could lead to substantial profits.
Monitor volume closely to confirm the strength of the breakout, while also keeping an eye on key levels for invalidation.
If the bullish momentum sustains, SHIB has a strong chance of retesting its ATH in the upcoming rally.
DYOR, NFA
@Peter_CSAdmin

SHIB/USDT Chart Analysis #Shiba Inu ( CRYPTOCAP:SHIB ) / USDT Technical Analysis
Shiba Inu (#SHIB) is currently trading at 0.00002186, showing signs of strength as it holds above a key uptrend line. The price has strong support near the Fibonacci 0.618 level, which could act as a base for a bullish rebound toward higher targets.
Key Levels:
Support Zone: 0.00002139 - 0.00001939 (Fibonacci 0.618 - 0.786 levels).
Target 1 (T1): 0.00002715 (Initial goal).
Target 2 (T2): 0.00003083 (Intermediate resistance).
Target 3 (T3): 0.00003511 (Major resistance).
