SILVER Analysis - Can buyers push toward 4,100$?TRADENATION:XAGUSD is trading within a clear ascending channel, with price action consistently respecting both the upper and lower boundaries. The recent bullish momentum indicates that buyers are in control, suggesting there's chances for potential continuation on the upside.
The price has recently broken above a key resistance zone and now came back for a retest. If this level holds as support, it would reinforce the bullish structure and increase the likelihood of a move toward the 4,100 target, which aligns with the channel’s upper boundary.
As long as the price remains above this support zone, the bullish outlook stays intact. However, a failure to hold above this level could invalidate the bullish scenario and increase the likelihood of a deeper pullback.
Remember, always confirm your setups and use proper risk management.
Disclosure: I am part of Trade Nation's Influencer program and receive a monthly fee for using their TradingView charts in my analysis.
SILVER trade ideas

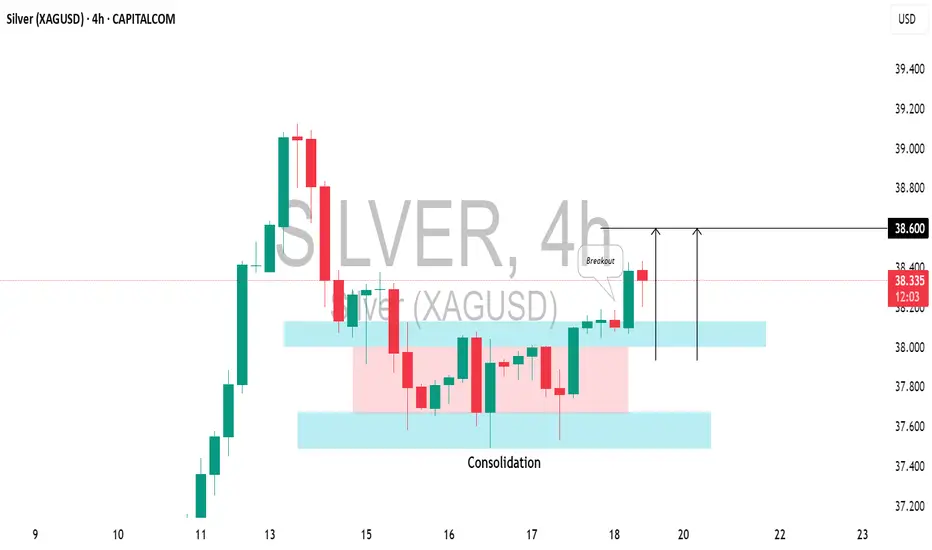
SILVER (XAGUSD): Bullish Move ConfirmedIt appears that the local correction on 📈SILVER has completed, and the pair is shifting back to a bullish trend.
Today's US economic data caused the pair to break through a resistance level within a narrow consolidation range on the 4-hour chart.
The price is expected to rise to the 38.60 level.
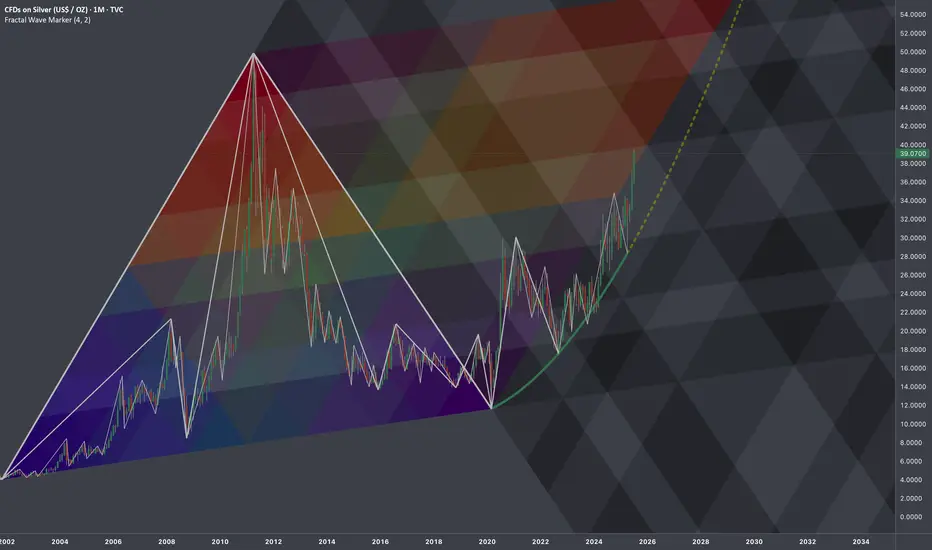
$SILVER: Fractal Geometry (Cycle 2001-2020)Research Notes
Working out probabilistic texture using multiple fibonacci channels on just 3 coordinates of fractal cycle (late 2001 - 2020) on linear scale (on log chart it would still be relevant, so you can switch to view with right click on price scale for selection).
To describe behavior of price and key levels on smaller scale starting from covid we'll use
L-H-L:
Using coordinates to express surface area of broken cycle with fibs mimicking rise, fall and side mapping cycle:
I'd look for patterns of bullish exhaustion only after price crosses the curve.
SILVER h4 bullish pattansilver bullish mode Bearish Disruption Scenario:
Fake bounce to ~$37.00
Rejection → Break $36.00 support
Bear momentum pushes to $35.00–34.50
Neutral/Range Disruption:
Price oscillates between 36.00 and 36.80 for longer than expected — builds up coiled energy before either sharp breakout or breakdown
Only Bullish IF:
Clean reclaim of 37.25 with strong close above
So how many times has silver touched or broken $40?So how many times has silver touched or broken $40?
ONLY TWICE !!!
• 1980 – short spike
• 2011 – brief sustained rally
Didn’t end well either time, both marked the end of bull markets.
But this time?
No mania. Just stealth. Silver’s quietly moving up.
silver seems goes to $40.15 very soonDXY still down-treding.
silver position looks well-aligned with a bullish trend, thanks to technical strength and macro tailwinds. Keep an eye on the $39 support zone— Next upside target $40.15
www.tradingview.com

SILVER ( XAGUSD ): Still Bullish! Take The Buy Setups!In this Weekly Market Forecast, we will analyze the XAGUSD (SILVER) for the week of July 21-25th.
Silver remains a Strong Buy rating. There is no technical reason to look for shorts. Only buys right now, until we see a bearish break of structure. Then sells can be considered.
That having been said, like Gold, there is a 4H +FVG that we are watching. If it holds, higher prices will ensue. If it fails, the lows become the draw on liquidity.
We'll soon see how it plays out.
Enjoy!
May profits be upon you.
Leave any questions or comments in the comment section.
I appreciate any feedback from my viewers!
Like and/or subscribe if you want more accurate analysis.
Thank you so much!
Disclaimer:
I do not provide personal investment advice and I am not a qualified licensed investment advisor.
All information found here, including any ideas, opinions, views, predictions, forecasts, commentaries, suggestions, expressed or implied herein, are for informational, entertainment or educational purposes only and should not be construed as personal investment advice. While the information provided is believed to be accurate, it may include errors or inaccuracies.
I will not and cannot be held liable for any actions you take as a result of anything you read here.
Conduct your own due diligence, or consult a licensed financial advisor or broker before making any and all investment decisions. Any investments, trades, speculations, or decisions made on the basis of any information found on this channel, expressed or implied herein, are committed at your own risk, financial or otherwise.

SILVER (XAGUSD): Confirmed Break of Structure
Silver updated a year's high yesterday, breaking a strong daily resistance.
With a confirmed Break of Structure BoS, we can expect that
the market will rise even more.
The next strong resistance is 40.
It is a round number based psychological level.
It can be the next goal for the buyers.
❤️Please, support my work with like, thank you!❤️
I am part of Trade Nation's Influencer program and receive a monthly fee for using their TradingView charts in my analysis

Final Phase of Circle Wave 3 XAG/USDFXOPEN:XAGUSD
We’re currently in the final stages of Circle Wave 3, which has developed through a series of 1–2–3 structures and internal ABC corrections.
Right now, we’re within the yellow count, moving from Wave 4 to Wave 5 – typically unfolding as an ABC structure.
🟡 Zooming In: Current Setup
✅ Wave A (of 4→5) is already complete – it formed as its own ABC
🔄 We’re currently transitioning from A → B
📈 A short-term move up is likely before a short entry targeting the final Wave C of 5
📏 Key Fibonacci Confluence Zone
I’ve marked the 71% extension level in green – it aligns perfectly with my broader Fibonacci target zone, where we could see the highest volume come in
My personal limit sell is at 37,700, inside this confluence zone
🛑 Stop-loss: 37,500 (below Wave 4)
🎯 Take-profit: Around 39,260, though this area could extend higher depending on momentum
💡 Trade Idea Summary
A clean, simple setup:
Look for upside push (Wave B)
Set limit short in the Fib zone (green area)
Watch for reversal into Wave C to complete Circle Wave 3
After that, I’ll be looking for mid- to long-term short setups 🔽

Bullish Continuation on Silver. 4 Areas To TargetWhen we last visited Silver we were looking at a Bullish Daily Chore opportunity. That opportunity played out nicely and now that we've officially violated the most recent structure high, it should be relatively smooth sailing to our next level of structure from back in 2011.
I say relatively, because the most conservative target area is right above current price, but don't worry, because in this video we'll discuss how there will still be plenty of trading opportunities, even if you choose to wait for a sign after that initial level.
If you have any questions or comments, please leave them below. Also, if you want to share your analysis that's always helpful for the community.
Akil

SILVER LOCAL SHORT|
✅SILVER has retested a key resistance level of 39.10$
And as the pair is already making a bearish pullback
A move down to retest the demand level below at 38.61$ is likely
SHORT🔥
✅Like and subscribe to never miss a new idea!✅
Disclosure: I am part of Trade Nation's Influencer program and receive a monthly fee for using their TradingView charts in my analysis.

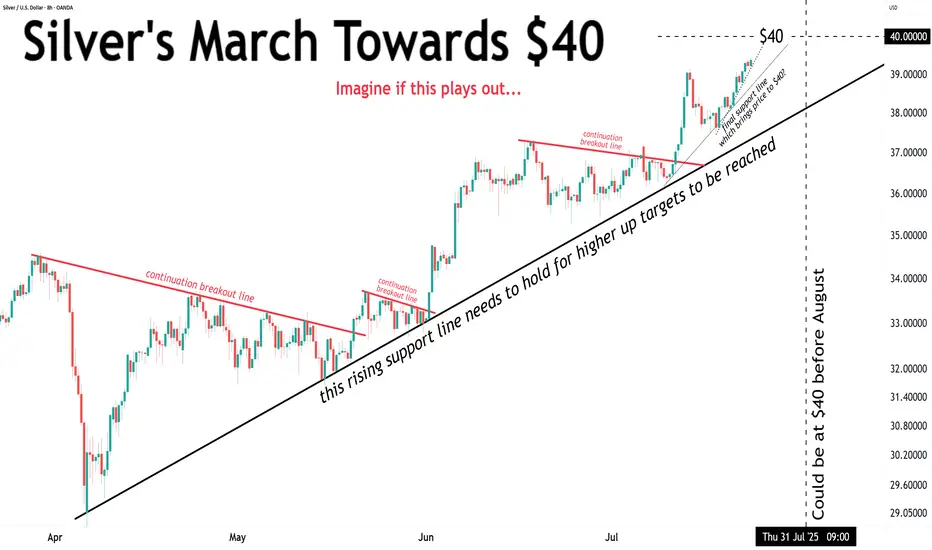
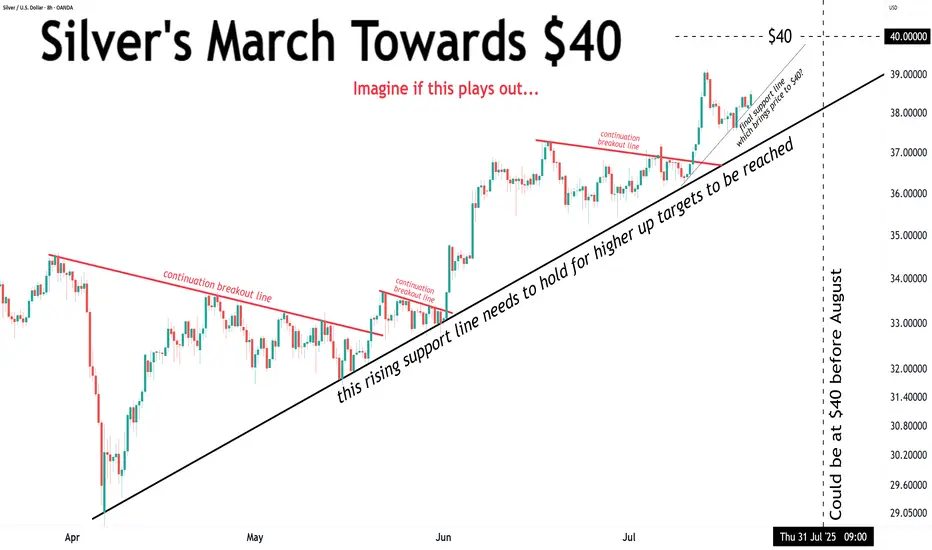
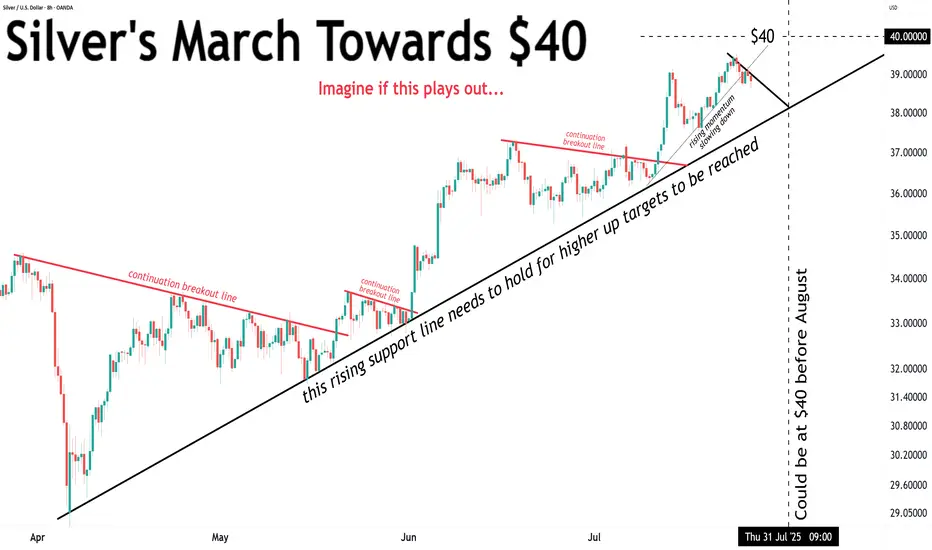
Silver’s short-term momentum is slowing down...Silver’s short-term momentum is slowing down...
Will it have enough juice to crack $40 before August?
🍿🍿🍿
Sell Plan – XAGUSD (15M)🟥 Sell Plan – XAGUSD (15M)
Context:
Price swept liquidity from the previous swing high near the red FVG zone.
Reacted from H1 T2 bearish FVG.
Dealing Range (DR) confirmed in the 15M timeframe.
Bearish FVG formed, followed by a break of internal structure to the downside.
🔻 Trade Narrative:
After sweeping the short-term high, price tapped into the 1H T2 bearish FVG. A bearish fair value gap formed on the 15M chart, leading to the creation of a valid dealing range. Price respected this DR and showed rejection, signaling bearish intent.
⚙️ Confluences:
HTF Bearish FVG tapped (H1 T2).
Internal structure broken after the FVG.
DR formed within HTF POI.
Entry taken below DR after rejection candle.
Liquidity magnet (🧲 icon) marked below, aligning with bearish direction.
🎯 Target:
EQL (Equal Lows) marked at 38.710 – acting as liquidity target.

LONG SILVERDirection: Bullish
Moving Average: Red above Blue
Pattern Impulse: Impulse correction
Fib Retracement: 38.2
MACD > 0
1st Target = 39.11
2nd Target = 39.87
RISK: Silver already making new highs

XAGUSDCOT data shows a bullish shift in sentiment for silver (XAG/USD), with managed money increasing net long positions for the third consecutive week. This rising speculative interest signals growing confidence in silver's upside potential. Combined with a weakening USD and supportive macro trends, silver is well-positioned to break above the $30 resistance zone. Continued accumulation by institutional traders suggests momentum could carry XAG/USD toward the $33–$35 area in the coming weeks.


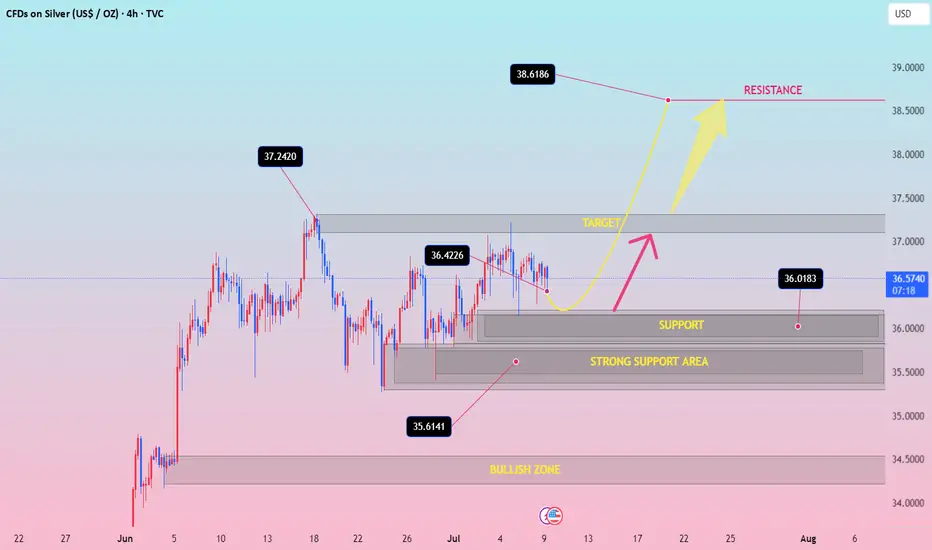
XAGUSD Outlook – 40 Remains the Next TargetIn my previous XAGUSD analysis, I argued that the trend was strongly bullish and that a move toward 40 was the next logical outcome. At the time, price was correcting, and I highlighted the 37.50 zone as a key area to look for long opportunities.
✅ Indeed, Silver respected that zone perfectly —
It retested the broken consolidation, found support, and then surged higher, marking a new multi-year high in yesterday’s session.
________________________________________
🔍 What Now?
Nothing has changed in the broader view:
• Trend: Strongly bullish
• Structure: Higher highs and higher lows remain intact
• Behavior: Dips are being bought aggressively
As long as the recent 37.50 low is not broken, the strategy remains straightforward:
Buy dips within bullish continuation
________________________________________
🎯 40 in Sight — But Don’t Be Surprised if It Goes Further
The 40 zone remains the natural next target — a major psychological level.
But based on current momentum and breakout strength, Silver could go even higher in the coming weeks and months. If buyers keep control, we might even see new ATH test by year's end (50 zone).
________________________________________
🟢 Conclusion
This breakout confirms the larger trend.
The pullback to 37.50 was bought, as expected, and now Silver is making its move.
Strategy should remain the same:
Stay long above 37.50
Buy the dips
Watch how price reacts near 40 — but keep an open mind for higher levels
Disclosure: I am part of TradeNation's Influencer program and receive a monthly fee for using their TradingView charts in my analyses and educational articles.

XAGUSD, Elliott wave analysisOutlook for XAGUSD on 1W chart.
I think we are in sub-wave (3) of the wave (ⅲ).
Sub-wave (3) shown by Green-line will probably be an extension.
If the assumption is correct, the target for wave (3) will exceed 66.4.

Silver Market Recap: Q2 2025 HighlightsSilver prices hit a 14-year peak in Q2 of 25 due to global uncertainties and a tight supply-demand balance. Although it shares some similar drivers with gold, silver has carved its own path, which one charged by robust industrial demand and its safe-haven appeal amid economic and geopolitical turbulence.
Silver’s Price Journey
The quarter kicked off with a dip, silver fell from $33.77 per ounce on April 2 to $29.57 by April 4. But then, it quickly regained traction, crossing $30 by April 9 and peaking at $33.63 on April 23. May brought volatility, with prices swinging between $32.05 on May 2 and $33.46 on May 23. June marked a turning point: silver surging to $36.76 by June 9 and reaching a year-to-date high of $37.12 on June 17. By the quarter’s end, prices stabilized between $36 and $37, holding strong into July.
Supply Squeeze Meets Rising Demand
Silver’s rally was underpinned by a persistent supply deficit. The Silver Institute’s World Silver Survey (April 16, 2025) reported record demand of 680.5 million ounces in 2024, driven by industries like solar energy, artificial intelligence, and electric vehicles. Meanwhile, mine production lagged, creating a 148.9-million-ounce shortfall-the fourth consecutive year of deficits. Some experts may say that we’re seeing flat supply and demand outpacing it by nearly 20%. Aboveground stockpiles have dwindled by 800 million ounces over four years-equivalent to a full year’s mine output. They call it a “perfect storm” for silver’s price trajectory.
Geopolitical and Economic Catalysts
Global tensions are having a very noticeable impact on the dynamics of silver. Escalating conflicts, including Israel’s June 12 and June 21 strikes on Iranian nuclear sites, heightened fears of disrupted trade and energy flows, just boosting this way silver’s safe-haven appeal. Meanwhile, the BRICS bloc’s push to reduce reliance on the U.S. dollar, including Russia’s proposal for a precious metals exchange, added further momentum. U.S. trade policies, particularly President Trump’s fluctuating tariffs, introduced volatility. The April 2 “Liberation Day” tariff announcement sparked fears of a recession, briefly pushing silver prices down due to its industrial exposure. I guess that any recession-driven dip would be short-lived, with silver buoyed by broader precious metals strength and a weaker U.S. dollar.
Industrial Demand in the Spotlight
Unlike gold, silver’s industrial role amplified its price movements. Its use in photovoltaics, military components, and energy infrastructure has surged, with national security priorities in the U.S. and elsewhere driving demand. Economist Dr. Nomi Prins states the following: “Silver’s industrial applications-especially in energy and defense-are outpacing supply. Geopolitical shifts are cementing its role beyond a traditional safe-haven asset.”
What’s Next for Silver?
Looking ahead, analysts remain optimistic. Some predicts, that silver will hold above $35, potentially reaching $40 by year-end, with a stronger dollar as a possible headwind. Speaking about long-term, they see the gold-silver ratio (currently 92:1, compared to a 50-year average of 60:1) narrowing to 40:1 or lower, potentially pushing silver past $100 per ounce in the next few years. Although a global recession could temper industrial demand, safe-haven buying and ongoing supply constraints are expected to provide support. Geopolitical tensions and trade disputes, particularly between the U.S. and China, are unlikely to fade, which will only increase the attractiveness of silver.
Silver's performance reflects the dynamic interplay between industrial demand, supply shortages, and global uncertainties. With favorable fundamentals and geopolitical conditions, silver is poised for continued strength in the second half of 2025, assuming recession risks remain manageable.
SILVER Is Going Down! Short!
Here is our detailed technical review for SILVER.
Time Frame: 15m
Current Trend: Bearish
Sentiment: Overbought (based on 7-period RSI)
Forecast: Bearish
The market is on a crucial zone of supply 3,873.5.
The above-mentioned technicals clearly indicate the dominance of sellers on the market. I recommend shorting the instrument, aiming at 3,860.4 level.
P.S
We determine oversold/overbought condition with RSI indicator.
When it drops below 30 - the market is considered to be oversold.
When it bounces above 70 - the market is considered to be overbought.
Disclosure: I am part of Trade Nation's Influencer program and receive a monthly fee for using their TradingView charts in my analysis.
Like and subscribe and comment my ideas if you enjoy them!

Bullish Daily Chore Strategy Entry on SilverFirst time I've spoken about this strategy here (as I don't personally trade it myself), but the "Daily Chore" is a very popular one amongst the traders I work with.
Essentially what we're looking for is for price action to be on the correct side of our 3 EMA's (8, 20 & 50), and for those EMA's to be running in the correct order.
If so, we are then looking for a pullback into the EMA's and for a pin bar rejection candles to give us a sign for entry.
This is a very difficult strategy to figure out as it requires a lot of testing and tweaks to optimize, but it also allows for a lot for freedom as it only requires a few minutes a day to check up on.
Please leave any questions or comments below and make sure to give me a follow so you don't miss my next shared trading idea.
Akil

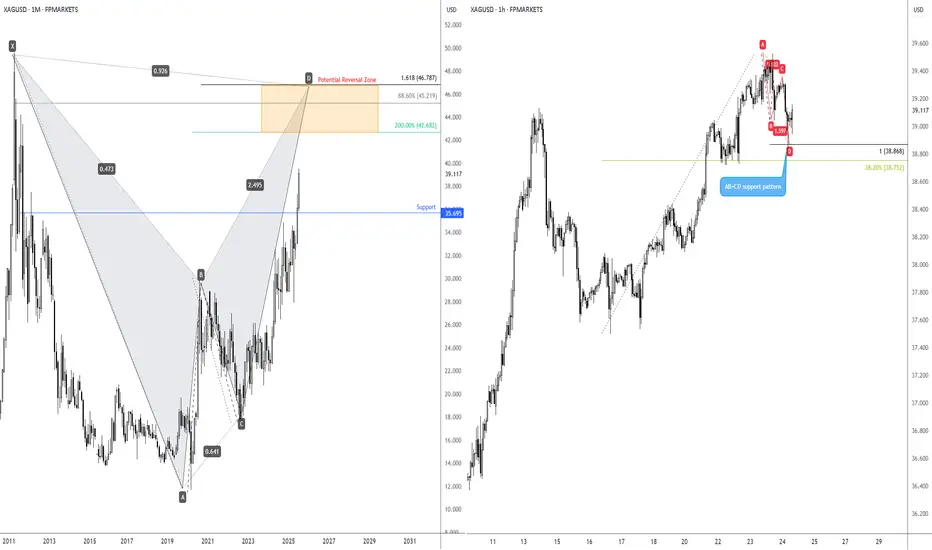
Long-term bullish action on Silver?I touched on the longer-term price action of Spot Silver (XAG/USD) last week, showing that the unit is on track to shake hands with a Potential Reversal Zone (PRZ) of a monthly harmonic bat pattern between US$46.79 and US$42.68.
Keeping things aligned with the harmonic landscape, you will note that H1 price action recently printed an AB=CD bullish pattern at US$38.87 (100% projection ratio), set just north of a 38.2% Fibonacci retracement ratio of US$38.75. While the H1 chart is generally considered short-term in nature, you may find that given we have longer-term flow suggesting scope for additional outperformance, short-term dip-buyers may consider holding a portion of their long positions open in an attempt to catch some of the possible longer-term upside.