SILVER trade ideas

SILVER: The Market Is Looking Up! Long!
My dear friends,
Today we will analyse SILVER together☺️
The price is near a wide key level
and the pair is approaching a significant decision level of 36.830 Therefore, a strong bullish reaction here could determine the next move up.We will watch for a confirmation candle, and then target the next key level 36.903.Recommend Stop-loss is beyond the current level.
❤️Sending you lots of Love and Hugs❤️

XAGUSD Analysis : Consolidation & FMFR Setup + Target🧭 Technical Overview:
Silver has had a strong bullish rally that started after the breakout of a long-term symmetrical triangle pattern. This breakout marked a Major Break of Structure (BOS) and shifted the overall market sentiment toward the bulls. Since then, price has been consolidating under a major resistance zone, forming a compression range, which is now shown as a blue elliptical zone in the chart.
This ellipse is not just a consolidation area — it represents a neutral compression zone where price can explode in either direction. The price action inside this area has been choppy and manipulative, sweeping both local highs and lows without real follow-through — a perfect environment for a Fake Move – then Reversal (FMFR) strategy.
🔍 Key Chart Components:
🔹 1. Ellipse (Dual Directional Zone)
This region shows indecision. Price is coiling inside, creating higher lows and lower highs — a volatility squeeze. A breakout from this ellipse is likely, but the first breakout move may be fake, followed by a quick reversal.
🔹 2. Major BOS (Break of Structure)
Price broke out of a long-term descending structure and pushed strongly upward, which marked a significant bullish shift. The pullback after that BOS was shallow — a sign of continued strength — but now we’re at a decision point.
🔹 3. Resistance Zone (Previous Target Area)
The price is now retesting a strong historical resistance around $37.00–$38.00, where we’ve seen rejections before. This is the liquidity zone where breakout traders enter long, but institutions may sweep them for liquidity before reversing.
🔹 4. Minor and Major CHoCH Levels
Minor CHoCH: Around $35.00–$35.50
Major CHoCH: Near $33.80–$34.00
These are reversal zones to watch if a fake move to the upside occurs and price rolls over.
📉 FMFR Setup Explained:
FMFR (First Move Fake Reversal) is a market behavior pattern where:
Price fakes a breakout in one direction (e.g., above resistance).
Attracts liquidity (traders’ orders).
Reverses rapidly in the opposite direction, trapping those who entered late.
In your chart, the blue notes say:
“In This Case, XAGUSD Have to Gave FMFR From Anyside”
“First Move Fake Then Reversal”
This highlights that no matter which direction the market initially breaks, it’s likely to reverse shortly afterward. This pattern is often seen before major moves when the market seeks to clear liquidity.
🔄 Scenarios to Watch:
🅰️ Bull Trap (Fake Breakout)
Price spikes above $37.80–$38.00.
Sweeps the highs and rejects sharply.
Reversal triggers below the ellipse, heading toward minor/major CHoCH.
🅱️ Bear Trap (Fake Breakdown)
Price dips below $35.00 (minor CHoCH).
Triggers panic sells.
Then rebounds quickly into the previous high zone or beyond.
⚙️ Trading Strategy Ideas:
Wait for Confirmation: Enter only after a confirmed breakout and retest OR a fakeout with reversal candles (e.g., engulfing, pin bar).
Use Tight Risk Management: Place stops outside sweep zones. This setup is volatile and can trap undisciplined trades.
Watch Volume & Wicks: Spikes with wicks and no close beyond the level usually confirm FMFR setups.
🔐 Key Levels to Watch:
Zone Price Level Action
Major Resistance $37.00–$38.00 Watch for fakeouts
Minor CHoCH ~$35.00–$35.50 Reversal entry zone
Major CHoCH ~$33.80 Last line of bullish defense
📝 Final Thoughts:
This is a textbook FMFR compression setup, where volatility is building inside a symmetrical price zone. The first aggressive move from this region is likely to be deceptive. Smart money traders look for trap setups, not the obvious direction. Silver is approaching a high-risk, high-reward decision zone, and staying patient will be key.
📊 Wait. Observe. React — don’t predict blindly.

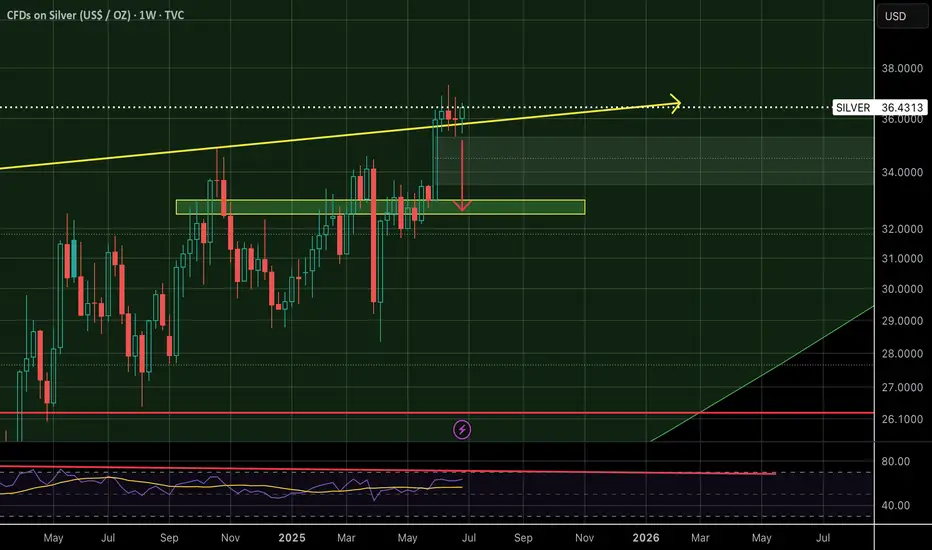
Resistance at $37.60. After that, look out above. This could be the next leg up to get to $40 and above. Some resistance around $37.60 to break first.
SILVER Short From Resistance! Sell!
Hello,Traders!
SILVER is trading in an
Uptrend but the price will
Soon hit a horizontal resistance
Area around 37,32$ from
Where we will be expecting
A local bearish correction
Sell!
Comment and subscribe to help us grow!
Check out other forecasts below too!
Disclosure: I am part of Trade Nation's Influencer program and receive a monthly fee for using their TradingView charts in my analysis.

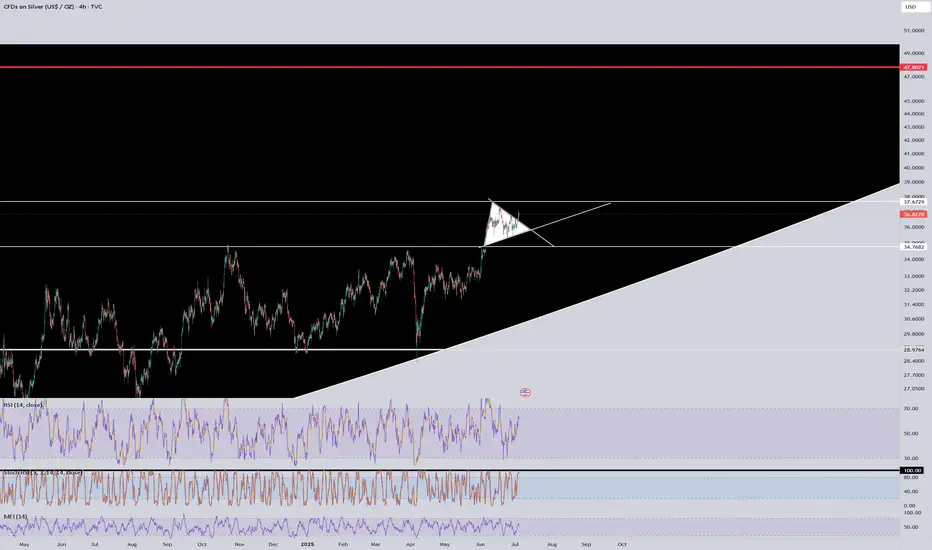
XAGUSD Strong accumulation waiting for a break-out. Silver (XAGUSD) has been trading within a 3-month Channel Up pattern and since the June 18 Higher High, it has entered a Descending Triangle.
This has previous been an Accumulation pattern, which after broken to the upside, it led to June's High. Similarly, we expect a bullish break-out once the 4H RSI breaks above its MA, and as long as the 4H MA200 (orange trend-line) holds, we expect a +15.50% minimum rise (like the first Bullish Leg of the Channel Up), with our Target se at 40.500.
-------------------------------------------------------------------------------
** Please LIKE 👍, FOLLOW ✅, SHARE 🙌 and COMMENT ✍ if you enjoy this idea! Also share your ideas and charts in the comments section below! This is best way to keep it relevant, support us, keep the content here free and allow the idea to reach as many people as possible. **
-------------------------------------------------------------------------------
💸💸💸💸💸💸
👇 👇 👇 👇 👇 👇

XAGUSDSpeculators remain net long on silver (bullish overall).
But the long positions decreased this week, showing some profit-taking or caution.
Silver Bias: Still bullish, but momentum is weakening.

Silver Dip Offers a Long OpportunityThis is a good opportunity to go long on silver.
Nothing has changed fundamentally — I still expect the asset to move higher.
The recent drop following the economic data release is giving me a chance to add to my silver position.

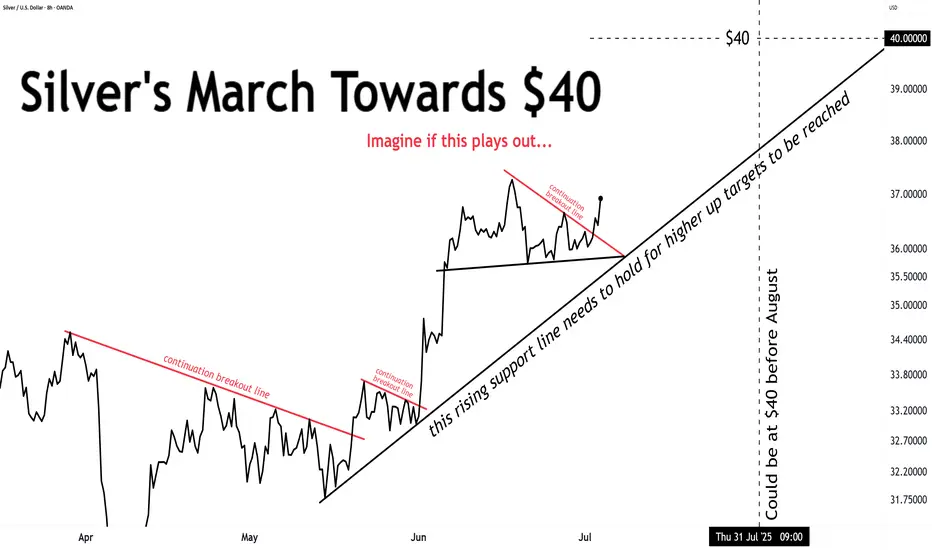
And silver's ride to $40 continues ...this rising support line needs to hold for higher up targets to be reached
SILVER: Local Bearish Bias! Short!
My dear friends,
Today we will analyse SILVER together☺️
The in-trend continuation seems likely as the current long-term trend appears to be strong, and price is holding below a key level of 36.897 So a bearish continuation seems plausible, targeting the next low. We should enter on confirmation, and place a stop-loss beyond the recent swing level.
❤️Sending you lots of Love and Hugs❤️

Nasdaq, BTCUSD, ETHUSD, EURUSD & XAGUSD Daily Trade SetupsIn this update we review the recent price action in the Nasdaq, Bitcoin, Ethereum, Euro & Silver and identify the next high probability trade setups and price objectives to target. To review today's video analysis click here!

SHORT ON SILVER XAG/USDSilver has built lots of sell side liquidity since June 10 and should now be ready to sweep it.
I will be selling silver to the next demand level.

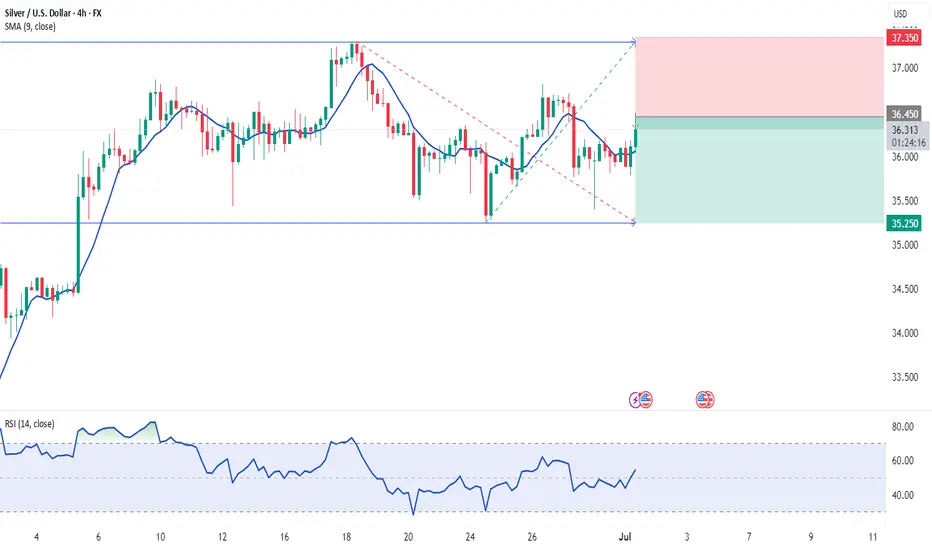
Silver eyeing 37. zone Silver popped through 36.40—if buyers keep that level intact on the retest, I’m looking for a run toward the 37.00 supply zone.

Silver Extends Gains to $36.70Silver hovered near $36.70 on Thursday after rising 1.4% in the previous session, supported by easing trade tensions and stronger expectations of Fed rate cuts.
Markets are now watching key US economic releases to see whether silver can sustain its upward momentum.
Resistance is at 37.50, while support holds at 35.40.

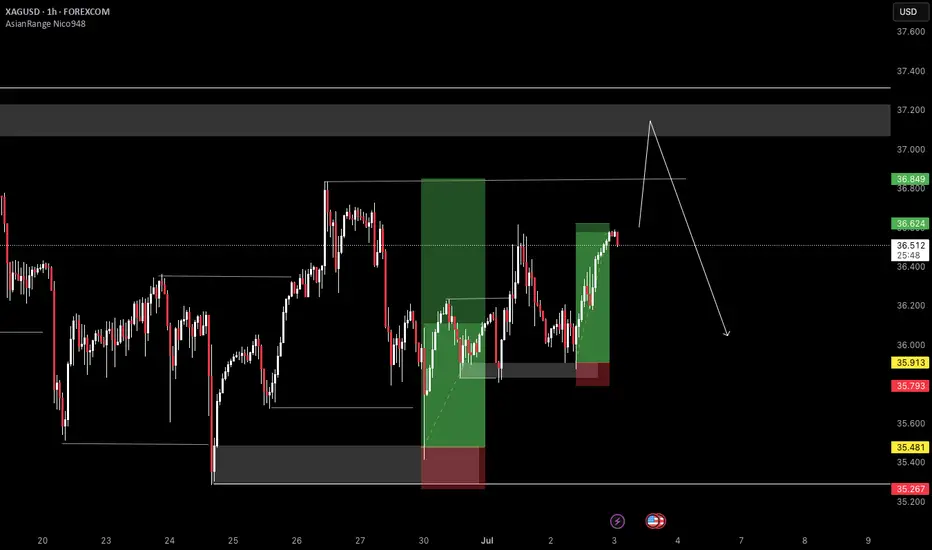
Short outlook on SilverLooking forward for the market to clear the liquidity on BSL , then sell " INTRADAY '
Silver Wave Analysis – 2 July 2025- Silver reversed from support level 35.50
- Likely to rise to resistance level 37.30
Silver recently reversed up with the daily Hammer from the support level 35.50 (which stopped the previous waves (iv) and 4, as can be seen from the daily Silver chart below).
The support level 35.50 was strengthened by the 38.2% Fibonacci correction of the upward impulse from May and the support trendline from April.
Given the clear daily uptrend, Silver can be expected to rise further to the next resistance level 36.80 – the breakout of which can lead to further gains toward 37.30.

SILVER: Will Go Up! Long!
My dear friends,
Today we will analyse SILVER together☺️
The price is near a wide key level
and the pair is approaching a significant decision level of 36.440 Therefore, a strong bullish reaction here could determine the next move up.We will watch for a confirmation candle, and then target the next key level of 36.607.Recommend Stop-loss is beyond the current level.
❤️Sending you lots of Love and Hugs❤️

Bull flag forming on silver at 14-year highsSilver has broken above a resistance level that goes all the way back to the fall of 2011. Its been forming this bull flag above, looking super bullish. I'm still waiting for it to come down into the top of the previous level of resistance and test it as support, which would be between $34.50 and $35. After testing as support, look for silver to go on to challenge the all-time highs. There is no guarantee that silver will come down into the support level.

Rotation from over valued equities in silver about to happen...I hear many people are selling their silver, thinking $36 is a high. But this is still the stealth accumulation phase. We will see a rotation of trillions into silver, that has a market cap of a few hundred billion, including miners.
In my book, "Silver is Money" we see stocks, bonds and government debt has kept a lid on inflation.
This coming rotation will bring about the biggest monetary change seen in generations.

Possible buy scenario for XAGUSD Price is bullish
On the H1 timeframe sellers pushed price lower to a H1 Demand price is currently reacting on the Demand zone if we get a BOS to the upside we're in for a buy.
Possible buy scenario
My idea 💡 DYOR

SILVER DAILY TIMEFRAME ANALYSISOn the daily timeframe, silver is currently exhibiting consolidation behavior, indicating indecision in the market.
However, a closer look at the recent price action — highlighted by the green circle — suggests a potential shift in market structure. Price appears to be testing the previous support level, and a confirmed break below this zone could signal a change in trend direction.
If this support level fails to hold, it would confirm a bearish shift, and I will be looking for short opportunities in the near term.
1. Current Trend: Sideways/Consolidation
The chart shows that XAGUSD (Silver) is currently in a consolidation phase after a strong bullish move earlier in May.
Price is ranging between approximately $36.80 and $35.50, forming lower highs and higher lows, indicating indecision or accumulation/distribution
2. Price Structure:
After the strong bullish impulse around mid-May, price has rejected multiple times around the $36.80 zone, showing strong resistance.
The current candles are showing lower closes, and the last candle is bearish, indicating weak bullish momentum and a potential shift to the downside.
There is a minor support zone around $35.85 – $35.80, which price is testing now.
3. Key Levels:
Type Price Area
Resistance 36.78 – 36.80
Resistance 36.45
Current Price 35.98
Support 35.85 – 35.80
Major Support 35.15 – 35.00
Conclusion:
The market is undecided right now but leaning bearish if support breaks.
Wait for a clear breakout of 35.80 for sell continuation.
Alternatively, look for bullish rejection around 35.80 to scalp back to 36.40–36.80 range.
Be patient and manage risk carefully in this range-bound condition.
