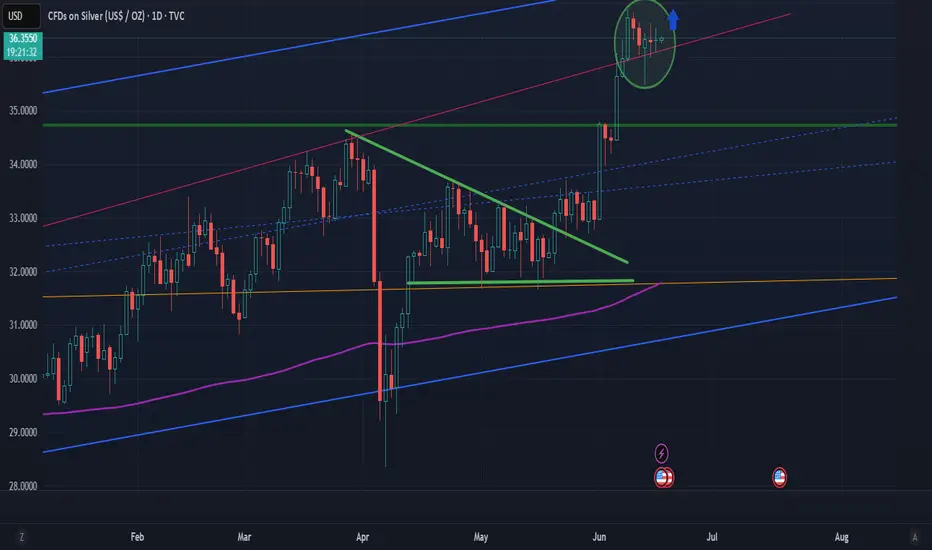
Silver Under Pressure with Dollar on the MoveSitting in a rising wedge and with momentum indicators rolling over, the ducks look to be lining up for a potential downside break for silver. Throw in signs the U.S. dollar may have bottomed—an adversary to commodity prices—and the unwind could be sizeable, especially if risk appetite were to evaporate.
If silver were to break beneath wedge support and hold there, it would allow for shorts to be established with a tight stop above the level for protection. $35.50—where the price bounced strongly from on June 12—screens as an initial target. If broken, it would bring uptrend support established in early April, along with the October 2024 highs at $34.87, into play.
Bullish momentum that helped power silver higher is also showing signs of waning—we’ve seen bearish divergence between RSI (14) and price, while MACD is also rolling over towards the signal line. The momentum picture isn’t outright bearish but just looks heavy.
Another important factor to consider beyond technicals is that silver and other commodity prices often struggle in an environment where the U.S. dollar is strengthening. That point is reinforced by the inverse correlation between silver and DXY over the past month, sitting with a score of -0.66—not strong by any stretch, but not something you can ignore either.
Good luck!
DS
SILVER trade ideas

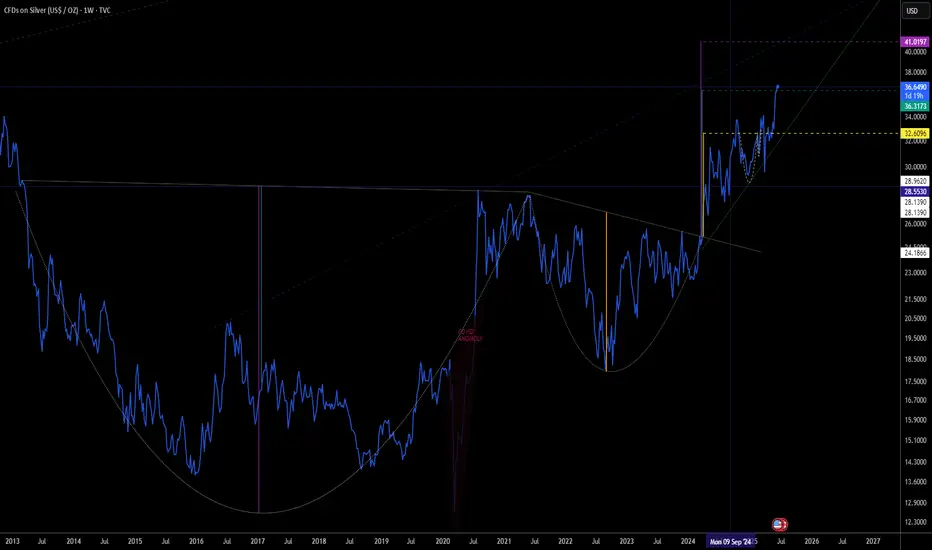
Silver Large Cup & Handle The image is a chart showing the price of silver (CFDs on Silver / USD per ounce) over time, from 2013 through 2025, with future projections. The chart suggests a bullish outlook for silver, possibly forecasting a rise to ~$41 based on historical patterns.
Silver H1 | Overlap resistance at 38.2% Fibonacci retracementSilver (XAG/USD) is rising towards an overlap resistance and could potentially reverse off this level to drop lower.
Sell entry is at 36.83 which is an overlap resistance that aligns with the 38.2% Fibonacci retracement.
Stop loss is at 37.10 which is a level that sits above the 61.8% Fibonacci retracement and a pullback resistance.
Take profit is at 36.21 which is a multi-swing-low support that aligns closely with the 61.8% Fibonacci retracement.
High Risk Investment Warning
Trading Forex/CFDs on margin carries a high level of risk and may not be suitable for all investors. Leverage can work against you.
Stratos Markets Limited (tradu.com ):
CFDs are complex instruments and come with a high risk of losing money rapidly due to leverage. 63% of retail investor accounts lose money when trading CFDs with this provider. You should consider whether you understand how CFDs work and whether you can afford to take the high risk of losing your money.
Stratos Europe Ltd (tradu.com ):
CFDs are complex instruments and come with a high risk of losing money rapidly due to leverage. 63% of retail investor accounts lose money when trading CFDs with this provider. You should consider whether you understand how CFDs work and whether you can afford to take the high risk of losing your money.
Stratos Global LLC (tradu.com ):
Losses can exceed deposits.
Please be advised that the information presented on TradingView is provided to Tradu (‘Company’, ‘we’) by a third-party provider (‘TFA Global Pte Ltd’). Please be reminded that you are solely responsible for the trading decisions on your account. There is a very high degree of risk involved in trading. Any information and/or content is intended entirely for research, educational and informational purposes only and does not constitute investment or consultation advice or investment strategy. The information is not tailored to the investment needs of any specific person and therefore does not involve a consideration of any of the investment objectives, financial situation or needs of any viewer that may receive it. Kindly also note that past performance is not a reliable indicator of future results. Actual results may differ materially from those anticipated in forward-looking or past performance statements. We assume no liability as to the accuracy or completeness of any of the information and/or content provided herein and the Company cannot be held responsible for any omission, mistake nor for any loss or damage including without limitation to any loss of profit which may arise from reliance on any information supplied by TFA Global Pte Ltd.
The speaker(s) is neither an employee, agent nor representative of Tradu and is therefore acting independently. The opinions given are their own, constitute general market commentary, and do not constitute the opinion or advice of Tradu or any form of personal or investment advice. Tradu neither endorses nor guarantees offerings of third-party speakers, nor is Tradu responsible for the content, veracity or opinions of third-party speakers, presenters or participants.

SILVER: Target Is Down! Short!
My dear friends,
Today we will analyse SILVER together☺️
The market is at an inflection zone and price has now reached an area around 36.878 where previous reversals or breakouts have occurred.And a price reaction that we are seeing on multiple timeframes here could signal the next move down so we can enter on confirmation, and target the next key level of 36.687..Stop-loss is recommended beyond the inflection zone.
❤️Sending you lots of Love and Hugs❤️

where we go from hereVery likely taking a breather. However, as silver is very volatile, it could jump up to 38 or push through and back to 36 then even lower to 28 level. I would back up the truck if it goes back down to 28. Remember this is an industrial metal and everyone is talking about it on YouTube so this could be a bull trap right now as well. be careful. I know I said it was on fire yesterday but the situation has changed

Multi Year Silver BreakOut to USD 42.11We're looking at XAGUSD breaking out to USD 42.11 after several years of being in consolidation and storing a lot of suppressed energy/ momentum which has broken out a few weeks back. This is also supported by a Gold Silver ratio exceeding 100 and as of now cooling down below 95.

Silver Up Slightly as Markets Await PowellXAG/USD rose 0.3% to $37.23 on Wednesday, though gains were capped by a stronger U.S. dollar as investors turned to safe assets amid escalating geopolitical tensions and caution ahead of the Federal Reserve’s decision. Silver’s safe-haven appeal remained, but the firmer dollar made it less attractive for non-dollar buyers. Markets are now watching Fed Chair Jerome Powell’s remarks for clues on future policy and near-term direction for silver.
Resistance is set at 37.50, while support stands at 35.40.

When You Are Lost Follow This 3 Step StrategyYesterday i took a long walk on
in a neighborhood.
Let me tell you what i saw..
I saw man jumping over the wall fence.
He did not look normal.
The clothes he wore represented that of a poor man.
He looked frustrated.He looked lost.
He turned to me as a leader.I got scared because
I could feel him following me.
The truth is i was lost.But
i had a landmark in my mind.
Once i see that land mark then
i know am no longer lost.
At this time i couldn't see my landmark
and so i moved in random patterns
I lost him "Thank goodness"
I said to myself with a sigh...
Later on i found a landmark and
i was no longer lost.
Learning how to trade the
markets is similar to the situation
i am just from describing to you.
Because its hard to communicate these
concepts.You need a landmark
strategy something to fall back on
As you go into this trading journey.
I studied your profile.I noticed that
you don't journal your trades.
This is not good..beyond
learning about trading strategies.
Which is very important.
The most impactful thing you
can do is journal your trades...
to journal your trades is
part of the trading strategy.So thats the goal
for this article journal your trades.
That is your landmark.
Look at silver $TVC:SILVER.It is outperforming gold.
when you see the buy signal in gold.
Then buy silver first to get a good bang for your
bucks..I learnt this strategy from
Mike Maloney richdad advisor.
As you can see on this chart.
This is following the Rocket booster strategy
to learn more about this 3 step this strategy
Check out the resource around this article
with links.
Trade safe.
Rocket boost this content to learn more.
Disclaimer:Trading is risky please use a
simulation trading account
before you trade with real money also
learn risk management and profit taking
strategies.
And do not use margin.

Would you like some more SILVER?I've been talking about it to my community for weeks!! This is the first time I've talked about it here. I hope this will resonate with some of you!

SILVERWith wars intensifying Israel vs Iran, Ukraine vs Russia global tension is rising fast. 🌍⚠️
In times like this, high-quality defense equipment becomes a top priority for nations.
And guess what?
Silver is a key component in military tech from drones and missiles to satellites and radar systems.
That’s why silver might be one of the smartest assets to diversify into right now.
Not just for protection against inflation,
but also as a strategic metal in a global defense race.

XAG USD LONG RESULT Silver price has been consolidating inside a symmetrical triangle and has been holding the support Trendline also creating consistent Higher Lows and increase in Demand Volume, all bullish indications for the asset, which was why I took the long position from the breakout point, and it moved better than I anticipated🔥
_THE_KLASSIC_TRADER_.

SILVER- LONG( positional and investments)TVC:SILVER 25 years of consolidation with cup handle formation on quarterly chart setup will predict that next 5 to 10 years may be good upward movements for silver.


SILVER (XAGUSD): One More Buying Opportunity📈SILVER is currently experiencing a strong bullish trend on the daily chart.
Since the end of last week, it has been consolidating within a horizontal range on a 4-hour time frame.
Today's bullish movement has successfully broken above the resistance of this range, confirming buyer strength and suggesting a likely continuation of the upward trend.
The next target is 38.00.

SILVER: The Market Is Looking Up! Long!
My dear friends,
Today we will analyse SILVER together☺️
The price is near a wide key level
and the pair is approaching a significant decision level of 36.903 Therefore, a strong bullish reaction here could determine the next move up.We will watch for a confirmation candle, and then target the next key level of 37.240 .Recommend Stop-loss is beyond the current level.
❤️Sending you lots of Love and Hugs❤️

SILVER BEARISH BIAS RIGHT NOW| SHORT
SILVER SIGNAL
Trade Direction: short
Entry Level: 3,714.4
Target Level: 3,384.5
Stop Loss: 3,933.3
RISK PROFILE
Risk level: medium
Suggested risk: 1%
Timeframe: 1D
Disclosure: I am part of Trade Nation's Influencer program and receive a monthly fee for using their TradingView charts in my analysis.
✅LIKE AND COMMENT MY IDEAS✅

Still we are valid on SILVER to push price upside Explained.In lower time frame we are seeing messy impulsive move both side due to geopolitical tension. Over all my bias on Silver is Bullish.
We are leaving potential weekly FVG which shows impulsive bullish momentum currently we are rejecting from Daily FVG based on my strategy i am still valid, invalidation point is daily low created on Daily FVG but i follow conservative Stop loss rule. so i stopped out earlier. But my over all bias is still Bullish reason explained on chart you can see.

Silver's march towards $40 resumes...this rising support line needs to hold for higher up targets to be reached
Could be at $40 before August

XAGUSD - BullishSilver is in a bullish trend and has formed a bullish rectangle continuation pattern. Buy above rectangle with SL below the rectangle.

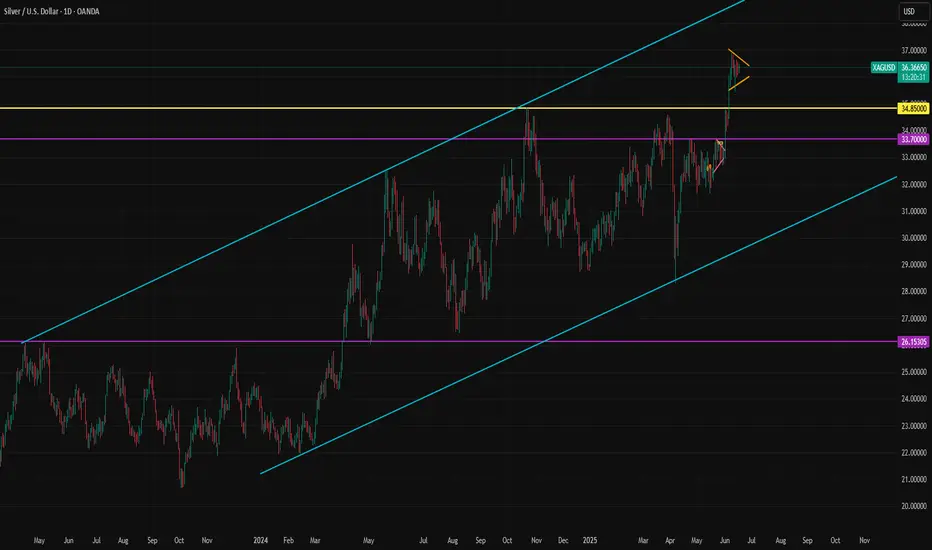
Why Silver Could Outperform Gold in the Coming Months? Silver recently broke out above the key 34.85 resistance level, and this could be a game changer for the medium-term outlook. With rising concerns over government debt, trade uncertainty, and escalating geopolitical risks, gold rallied strongly from 2000 to 3500. Gold and silver typically have a high correlation, and silver tends to follow gold. However, during the latest tariff-driven rally, gold pushed toward 3500 while silver failed to keep up. So, why did gold outperform silver this time?
The answer lies in the demand dynamics. Gold demand primarily comes from the investment side, while silver demand has traditionally been balanced around 50% investment and 50% industrial use. That balance has now shifted significantly. According to the Silver Institute, only 17.8% of 2025 silver demand is expected to come from investments. If we group jewelry and silverware with investment as a “store of value” category, the mix becomes 61% industrial and 39% investment.
This shift has been driven by a surge in silver demand from the electrical and electronics sector. The growth of clean energy and AI technologies has accelerated silver usage. In fact, the electrical and electronics sector is projected to account for 40.5% of total silver demand in 2025. This explains why slowing global trade and economic activity have had a more negative effect on silver compared to gold, pushing the gold/silver ratio to historically high levels.
That said, this same dynamic could fuel silver’s rise in the coming years, supported by long-term trends in clean energy and advanced technology.
The breakout of 34.85 is a significant technical development . Silver has been in an active uptrend channel since 2024, but the 34.85 level repeatedly capped upward moves since October. With this breakout, silver now has room to rise gradually toward the upper boundary of the channel, potentially reaching near 40. Key support levels to watch are 34.85 and 34.45. As long as they hold, the primary direction remains upward. The moves may be gradual but could include sharp surges and continuation patterns like flags.
Silver (XAGUSD) Analysis - Market looking strong!Why?
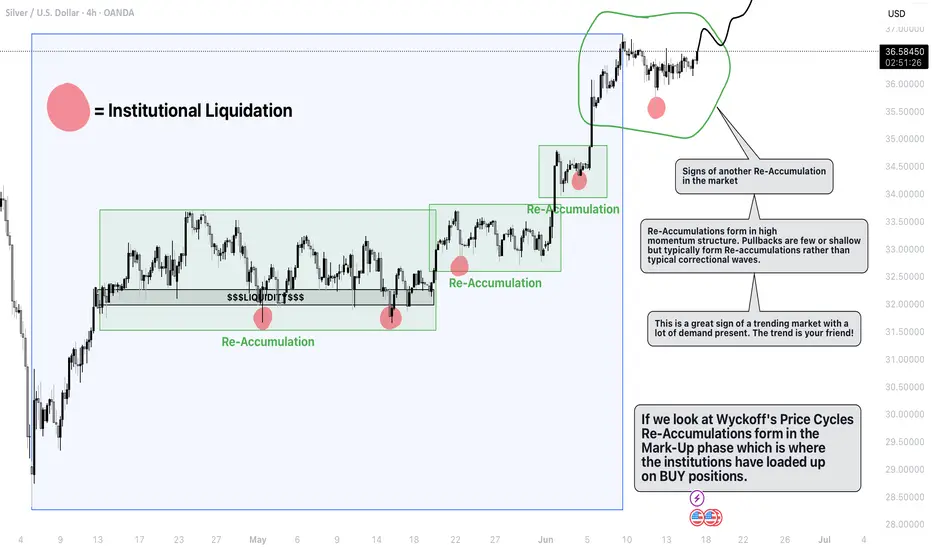
I have been pro-actively trading this market over the last few weeks and months due to its strong bullish nature that it is showcasing. This market is trending very nicely and has delivered the perfect market conditions for me to go LONG. I know this because the impulsive waves are strong and are created with high volume. Rather than seeing typical corrections, we are seeing the formation of Re-Accumulations (stepping stones) to take price higher.
My Predictions
Price is showing no signs of wanting to slow down or stop. Therefore my bias remains Bullish. As of currently, we can see price has began to consolidate and enter the creation of another Re-Accumulation. Clearly with the red highlight, we can see price has liquidated the recent lows which is a sign that the institutions are getting involved. I am expecting price to continue bullish from here, to break the current market high and continue its next leg higher.
I will be looking to get involved once price reaches and breaks the 36.900 level
CONFLUENCES
- Sentiment is above 80% Bullish ( MentFX Sentiment Source )
- Swing lows are being protected
- The effect being created by the cause is strong (Wyckoff Theory)
- Demand is clearly in control
- We are in a mark-up phase of the Wyckoff price cycles (The best phase to go long)
- Given the political uncertainty around the dollar right now, more investors are looking to pump money into alternative assets e.g Gold and Silver.
Sliver OTW to $40, $50 & blue skySliver OTW to $40, $50 & blue sky. Consolidation breakout imminent. You'll never see sub $40 in your lifetime ever gain.
Silver H1 | Rising into a swing-high resistanceSilver (XAG/USD) is rising towards a swing-high resistance and could potentially reverse off this level to drop lower.
Sell entry is at 36.50 which is a swing-high resistance.
Stop loss is at 36.70 which is a level that sits above the 78.6% Fibonacci retracement and a swing-high resistance.
Take profit is at 36.06 which is a multi-swing-low support that aligns closely with the 50% Fibonacci retracement.
High Risk Investment Warning
Trading Forex/CFDs on margin carries a high level of risk and may not be suitable for all investors. Leverage can work against you.
Stratos Markets Limited (tradu.com ):
CFDs are complex instruments and come with a high risk of losing money rapidly due to leverage. 63% of retail investor accounts lose money when trading CFDs with this provider. You should consider whether you understand how CFDs work and whether you can afford to take the high risk of losing your money.
Stratos Europe Ltd (tradu.com ):
CFDs are complex instruments and come with a high risk of losing money rapidly due to leverage. 63% of retail investor accounts lose money when trading CFDs with this provider. You should consider whether you understand how CFDs work and whether you can afford to take the high risk of losing your money.
Stratos Global LLC (tradu.com ):
Losses can exceed deposits.
Please be advised that the information presented on TradingView is provided to Tradu (‘Company’, ‘we’) by a third-party provider (‘TFA Global Pte Ltd’). Please be reminded that you are solely responsible for the trading decisions on your account. There is a very high degree of risk involved in trading. Any information and/or content is intended entirely for research, educational and informational purposes only and does not constitute investment or consultation advice or investment strategy. The information is not tailored to the investment needs of any specific person and therefore does not involve a consideration of any of the investment objectives, financial situation or needs of any viewer that may receive it. Kindly also note that past performance is not a reliable indicator of future results. Actual results may differ materially from those anticipated in forward-looking or past performance statements. We assume no liability as to the accuracy or completeness of any of the information and/or content provided herein and the Company cannot be held responsible for any omission, mistake nor for any loss or damage including without limitation to any loss of profit which may arise from reliance on any information supplied by TFA Global Pte Ltd.
The speaker(s) is neither an employee, agent nor representative of Tradu and is therefore acting independently. The opinions given are their own, constitute general market commentary, and do not constitute the opinion or advice of Tradu or any form of personal or investment advice. Tradu neither endorses nor guarantees offerings of third-party speakers, nor is Tradu responsible for the content, veracity or opinions of third-party speakers, presenters or participants.
