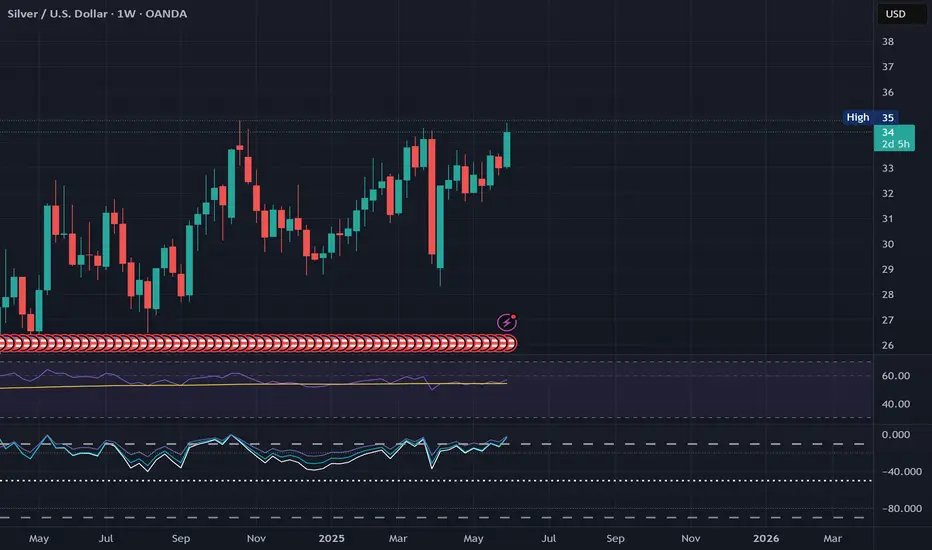
SILVER (XAGUSD): Where is the Next Resistance?!
What a rally on Silver this week.
The market easily violated a resistance cluster
based on the last year high.
Analyzing a historic price action, the next strong resistance
that I found is around 37.4
It is based on an important high of 2012.
That can be the next mid-term goal for the buyers.
❤️Please, support my work with like, thank you!❤️
SILVER trade ideas

Okay, let me make this crystal clear.Okay, let me make this crystal clear.
Whatever silver does right now, going up to $40 or even $50...
It will pale in comparison to what it will do once if breaks out versus the stock market.
The rocket ship moves aren't happening now, they happen later.

Silver Analysis 06-Jun-25 - June Breakout MomentumDiscussing the possible scenarios on Silver that just broke above the 34.5 - 35 level, reaching around the 36.2. This breakout is fundamentally supported by:
* Weak U.S Economic Data
* Industrial demand
* Tighter Silver Supply.
* Market optimism after US and China talks.
It's important to watch-out for any reactive headlines, price action, and off-course the US Labor data we have today.
Disclaimer: easyMarkets Account on TradingView allows you to combine easyMarkets industry leading conditions, regulated trading and tight fixed spreads with TradingView's powerful social network for traders, advanced charting and analytics. Access no slippage on limit orders, tight fixed spreads, negative balance protection, no hidden fees or commission, and seamless integration.
Any opinions, news, research, analyses, prices, other information, or links to third-party sites contained on this website are provided on an "as-is" basis, are intended only to be informative, is not an advice nor a recommendation, nor research, or a record of our trading prices, or an offer of, or solicitation for a transaction in any financial instrument and thus should not be treated as such. The information provided does not involve any specific investment objectives, financial situation and needs of any specific person who may receive it. Please be aware, that past performance is not a reliable indicator of future performance and/or results. Past Performance or Forward-looking scenarios based upon the reasonable beliefs of the third-party provider are not a guarantee of future performance. Actual results may differ materially from those anticipated in forward-looking or past performance statements. easyMarkets makes no representation or warranty and assumes no liability as to the accuracy or completeness of the information provided, nor any loss arising from any investment based on a recommendation, forecast or any information supplied by any third-party.

SILVER: Move Down Expected! Short!
My dear friends,
Today we will analyse SILVER together☺️
The recent price action suggests a shift in mid-term momentum. A break below the current local range around 36.190 will confirm the new direction downwards with the target being the next key level of 35.901.and a reconvened placement of a stop-loss beyond the range.
❤️Sending you lots of Love and Hugs❤️

Silver (XAGUSD) Breaks Out – What’s the Paths Forward?Silver has experienced a significant breakout, decisively surpassing its previous high from October 2024. This signals the start of the next upward leg in its price trajectory. From the last notable low on April 7, 2025, the rally has been unfolding as an impulsive wave with an extended structure, often referred to as a “nest.” Beginning from the April 7, 2025 low, wave (1) reached its peak at 33.684. It was then followed by a corrective pullback in wave (2), which concluded at 31.635. From this point, silver resumed its upward momentum in wave (3). The metal displays an internal subdivision characteristic of another impulsive wave.
Breaking down the progression from wave (2) low, the initial wave 1 advanced to 33.69. A subsequent dip in wave 2 found support at 32.58, as illustrated in the accompanying 1-hour chart. The metal then continued its ascent, nesting higher once again. From the wave 2 low, the sub-wave ((i)) peaked at 33.56. A pullback in wave ((ii)) then followed which bottomed out at 32.67. Silver then resumed its upward trend in wave ((iii)). Wave (i) of ((iii)) concluded at 33.49 and wave (ii) of ((iii)) ended at 32.75.
Looking ahead, silver is expected to achieve two additional highs to complete wave (iii) before encountering a corrective pullback in wave (iv). Afterwards, the upward trajectory should resume. In the near term, as long as the pivotal low at 32.58 remains intact, any dips are likely to attract buyers in 3, 7, or 11 swings, setting the stage for further upside potential. This technical analysis suggests a bullish outlook for silver, with the current structure supporting continued gains in the near future.


SILVER MASSIVE BULLISH BREAKOUT|LONG|
✅SILVER is trading in an uptrend
And the price made a massive
Bullish breakout of the key horizontal
Level of 34.80$ and the breakout
Is confirmed which reinforces
Our bullish bias and we will
Be expecting a further
Bullish move up
LONG🚀
✅Like and subscribe to never miss a new idea!✅
Disclosure: I am part of Trade Nation's Influencer program and receive a monthly fee for using their TradingView charts in my analysis.

Silver to 60-70, then 160? Analysts says yes.In this video, I share what analyst Michael Oliver believes will happen to silver over the next few years, now that momentum is taking silver higher and higher.

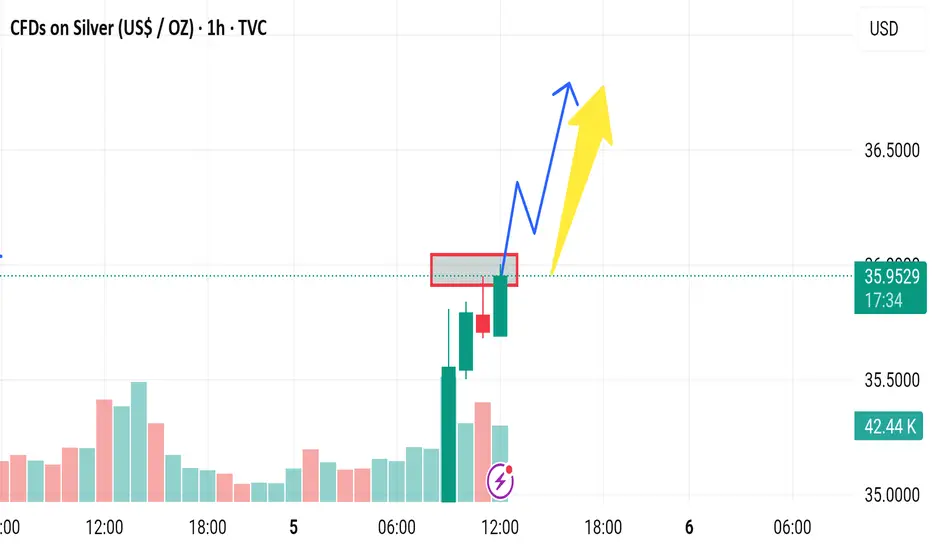
Market next move 🧨 Disruption Points:
1. Overbought Condition / RSI Divergence
Even though the price is surging (+3.30%), there could be an overbought condition forming.
If RSI or other momentum indicators (not shown here) diverge, it might signal weakness in bullish momentum.
> Disruptive idea: Price may fake the breakout (blue arrow) and then sharply reverse, trapping late buyers.
---
2. False Breakout Trap
The red-box area could be a liquidity zone where smart money might induce a fake breakout before dumping.
> Alternative path: Price breaks above temporarily (as in blue path), but then reverses violently back into the range, forming a “bull trap.”
---
3. Volume Anomaly
The volume appears to be decreasing on recent bullish candles after the initial spike.
This suggests that the uptrend may be losing strength, making the yellow arrow scenario less likely.
> Contrary outlook: Lack of volume confirmation could mean a sideways consolidation or reversal is more probable.

Silver at All Time High Looks Ripe for a Pullback! Hey Traders so today was taking a look at Silver Market. It just hit an all time high exciting times in these precious metals! Seems like Gold is normally the first train to leave the station but when silver catches up man can she move!
Anyway so now that there has been a break above resistance 34.63 the momentum might really get going so should you buy it now?
Absolutely not imo first rule of trading is Buy Low Sell High! 😁
I don't believe in chasing markets let it come to you!
So where is the best place to Buy?
Well if we look at the chart we can see a very strong 3 bar uptrend line in place since April. So the best way to trade the trend is buy when it pulls back to the trendline.
Simple Enough right and No Indicators Needed.
Well yes but actually we can even try to find a better entry point. See that huge rally candle on June 2?
If we can measure that candle with the Fibonacci tool then find the 50% retracement of that candle I think it's a great place to place a buy order.
X marks the spot at $33.84!
From what I have seen over the years is that when markets retrace 50% of candle like that there is a lot of buying pressure and support at that level so it may not stay there for long. Hopefully it hits that level and then continues the uptrend.
So place an entry order at that level $33.84 and you don't even have to watch the market🤔
Place a stop loss below support at around 32.49
If bearish be very careful because this is a strong bull market. Also Gold and Silver has a Seasonal Pattern to Rise in July and August.
Always use Risk Management!
(Just in case your wrong in your analysis most experts recommend never to risk more than 2% of your account equity on any given trade.)
Hope This Helps Your Trading 😃
Clifford

SILVER: The Market Is Looking Up! Long!
My dear friends,
Today we will analyse SILVER together☺️
The in-trend continuation seems likely as the current long-term trend appears to be strong, and price is holding above a key level of 35.467 So a bullish continuation seems plausible, targeting the next high. We should enter on confirmation, and place a stop-loss beyond the recent swing level.
❤️Sending you lots of Love and Hugs❤️

Market next move 🔍 Bearish Disruption Perspective
1. Supply Zone Rejection
The red box marks a strong resistance zone. Current price action shows rejection at that level (long upper wicks).
This signals that sellers are defending this zone, increasing the likelihood of a false breakout.
2. Exhaustion After Strong Rally
The massive green candle just before the resistance may have exhausted short-term buying power.
Without a clear consolidation or volume surge, the price could reverse or retrace to gather strength.
3. Volume Discrepancy
Volume spikes with price often suggest conviction. However, this chart shows moderate volume on the test of resistance—not enough to confirm breakout strength.
4. Bearish Candlestick Pattern
The small red candle following the green surge could be forming a bearish engulfing or rejection candle, depending on the close.
SILVERSILVER,i called on silver buy and break of daily supply roof and on demand floor silver could reclaim 50$ and accelerate on geopolitical tension.
#silver

Silver now above $35.A Point and Figure (P&F) chart is a type of technical analysis chart used by traders to predict financial market trends. Unlike candlestick or bar charts that plot price over time, P&F charts focus solely on price movements, ignoring the passage of time entirely. This makes them useful for identifying clear support and resistance levels, trend lines, and breakouts. --chatgpt

XAGUSD Trading Strategy UpdateIn this update we review the recent price action in Silver and update the trading strategy for the precious metal, updating price objectives to target and additional entry opportunities. To review today's video analysis, click here!

SILVER – The Technicals Are Clear, The Fundamentals Are LoudEntry: $32.978
Current Price: $34.52
Target: Still in play, short-term and long-term upside remain
Technical Outlook:
Silver has maintained bullish structure after a clean breakout from the $32.9 zone.
- Higher lows continue
- Bullish momentum intact
- Watching $35 as next key psychological level
- Break & retest = next leg up
Short-term resistance at $35.20, if price holds above this zone, I expect continuation toward $38–40.
Long-Term Price Forecasts:
- Investing Heaven: $48–50 by 2025, up to $75 by 2027
- JPMorgan / Citi: $38–40
- Fixed supply vs. growing demand = long-term bullish imbalance
Why Silver Could Outperform (Fundamentals):
AI Boom → High silver usage in electronics
Green Energy → Critical in solar panels & EVs
Industrial Demand ⬆ while supply remains capped
This is more than a chart pattern, it’s a macro thesis with technical validation.
Trading Psychology Insight:
Most traders get shaken out before the move completes.
The real challenge isn’t spotting the setup, it’s holding through the noise.
Patience is a position.
Discipline is your edge.
I’m still holding not from hope, but from trust in my process.
Levels I’m Watching:
Break of $35 with volume = bullish confirmation
Failure to hold = possible retest near $33.8–34 zone
Long-term: Gradual climb with dips to accumulate
Agree? Disagree? Let’s talk in the comments.
If you want me to post the next phase of this trade with updates + psychology notes, drop a "Comment"

Silver is on set for another surge
After silver prices surged significantly on Monday, the market followed by a consolidation phase, forming a symmetrical triangle pattern. Typically, this pattern signals a continuation of the prevailing trend, but confirmation is required on a breakout—ideally sustaining above the previous high at 34.80.
If the price hold above 35.00, it would confirm a 12-year high, which could attract more speculative flow and drive prices even higher.
Should the breakout align with the prevailing uptrend, the projected target based on the flagpole's height is around 36.50—marking the next key target zone.
Fundamentally, the upcoming Non-Farm Payroll (NFP) on Friday, June 6, could serve as a key catalyst. With broad market participation expected, the data has the potential to push silver prices to new highs.
Additionally, ongoing geopolitical tensions in Eastern Europe show no signs of resolution, which continues to support demand for safe-haven assets like precious metals. This provides further upward momentum for silver.
However, any signs of progress in geopolitical negotiations would pose a downside risk to this bullish outlook.
Analysis by: Krisada Yoonaisil, Financial Markets Strategist at Exness

SILVERThe correlation between Silver and the US Dollar Index (DXY) is generally strongly negative. This means that when the DXY rises (the dollar strengthens), silver prices tend to fall, and when the dollar weakens, silver prices usually rise.
Reasons for the Negative Correlation:
Silver is priced in US dollars: A stronger dollar makes silver more expensive in other currencies, reducing demand and lowering prices. Conversely, a weaker dollar makes silver cheaper internationally, boosting demand and prices.
Safe-haven and inflation hedge: Silver, like gold, is often sought during times of dollar weakness, inflation concerns, or geopolitical uncertainty.
Supporting Details from Recent Analysis:
Silver prices have a strong inverse relationship with the DXY,the Historical trends show silver outperforming during sustained dollar downtrends.
Silver’s smaller market size and greater volatility compared to gold mean silver can experience more pronounced price moves in response to dollar fluctuations.
Recent silver price rallies in 2025 have been supported by dollar weakness, safe-haven demand, and industrial use, with silver trading near $34.50 per ounce.
Summary Table
Factor Impact on Silver Price Explanation
DXY Strengthens Silver price tends to fall Silver becomes more expensive globally
DXY Weakens Silver price tends to rise Silver becomes cheaper internationally
Safe-haven Demand Supports silver during dollar weakness or uncertainty Investors seek precious metals as alternatives
Industrial Demand Supports silver price Silver’s use in electronics and renewable energy
Conclusion
Silver and the US Dollar Index exhibit a notable inverse correlation driven by silver’s dollar pricing and its role as a safe-haven and industrial metal. Monitoring key DXY technical levels can provide insights into potential silver price movements, with dollar weakness often heralding strong silver rallies.
#gold #silver

XAGUSD H4 I Bullish Bounce Off Based on the H4 chart analysis, the price is falling toward our buy entry level at 33.61, a pullback support.
Our take profit is set at 34.71, a pullback resistance.
The stop loss is placed at 32.60, a swing low support.
High Risk Investment Warning
Trading Forex/CFDs on margin carries a high level of risk and may not be suitable for all investors. Leverage can work against you.
Stratos Markets Limited (tradu.com ):
CFDs are complex instruments and come with a high risk of losing money rapidly due to leverage. 63% of retail investor accounts lose money when trading CFDs with this provider. You should consider whether you understand how CFDs work and whether you can afford to take the high risk of losing your money.
Stratos Europe Ltd (tradu.com ):
CFDs are complex instruments and come with a high risk of losing money rapidly due to leverage. 63% of retail investor accounts lose money when trading CFDs with this provider. You should consider whether you understand how CFDs work and whether you can afford to take the high risk of losing your money.
Stratos Global LLC (tradu.com ):
Losses can exceed deposits.
Please be advised that the information presented on TradingView is provided to Tradu (‘Company’, ‘we’) by a third-party provider (‘TFA Global Pte Ltd’). Please be reminded that you are solely responsible for the trading decisions on your account. There is a very high degree of risk involved in trading. Any information and/or content is intended entirely for research, educational and informational purposes only and does not constitute investment or consultation advice or investment strategy. The information is not tailored to the investment needs of any specific person and therefore does not involve a consideration of any of the investment objectives, financial situation or needs of any viewer that may receive it. Kindly also note that past performance is not a reliable indicator of future results. Actual results may differ materially from those anticipated in forward-looking or past performance statements. We assume no liability as to the accuracy or completeness of any of the information and/or content provided herein and the Company cannot be held responsible for any omission, mistake nor for any loss or damage including without limitation to any loss of profit which may arise from reliance on any information supplied by TFA Global Pte Ltd.
The speaker(s) is neither an employee, agent nor representative of Tradu and is therefore acting independently. The opinions given are their own, constitute general market commentary, and do not constitute the opinion or advice of Tradu or any form of personal or investment advice. Tradu neither endorses nor guarantees offerings of third-party speakers, nor is Tradu responsible for the content, veracity or opinions of third-party speakers, presenters or participants.

The What vs. The Where - A 2nd Breakout Pattern After A Nice WinA few days ago we looked at a bullish breakout opportunity on Silver and it played out perfectly. After a lovely move to the upside, price has started to consolidate again providing us with a very similar setup.
HOWEVER, just as in the case of the first, we need to be aware that once again the WHAT doesn't necessarily align with the WHERE stopping this from being a Grade A trading opportunity.
Please leave any questions or comments below and remember to hit that LIKE button before you go!
Akil

$40 target for silver possible in next couple of months...$40 target for silver possible in next couple of months...
Imagine if this plays out...
this rising support line needs to hold for higher up targets to be reached
Could be at $40 before August

Could the Silver reverse from here?The price is reacting off the resitance level which is a pullback resitance and could drop from this level to our take profit.
Entry: 34.51
Why we like it:
There is a pullback resistance level.
Stop loss: 35.520
Why we like wit:
There is a resistance level at the 100% Fibonacci projection.
Take profit: 33.56
Why we like it:
There is a pullback support level which lines up with the 61.8% Fibonacci retracement.
Enjoying your TradingView experience? Review us!
Please be advised that the information presented on TradingView is provided to Vantage (‘Vantage Global Limited’, ‘we’) by a third-party provider (‘Everest Fortune Group’). Please be reminded that you are solely responsible for the trading decisions on your account. There is a very high degree of risk involved in trading. Any information and/or content is intended entirely for research, educational and informational purposes only and does not constitute investment or consultation advice or investment strategy. The information is not tailored to the investment needs of any specific person and therefore does not involve a consideration of any of the investment objectives, financial situation or needs of any viewer that may receive it. Kindly also note that past performance is not a reliable indicator of future results. Actual results may differ materially from those anticipated in forward-looking or past performance statements. We assume no liability as to the accuracy or completeness of any of the information and/or content provided herein and the Company cannot be held responsible for any omission, mistake nor for any loss or damage including without limitation to any loss of profit which may arise from reliance on any information supplied by Everest Fortune Group.

Many Market Maker OpportunitiesSame as Nasdaq, no one realize the perfect condition in silver. Another beautiful road home to the take profit line in the selling direction for the month.