XAGUSD Holding Trendline With Support From Key Demand Zones📈 XAGUSD Holding Trendline Support, Eyes on Breakout
Silver continues to trade within a strong bullish structure, holding above a rising trendline and building pressure near recent highs. With support clearly defined and momentum intact, bulls are eyeing a potential breakout continuation. This update outlines the trend context, support zones, and fundamental backdrop.
🔍 Technical Analysis:
XAGUSD is respecting a steep ascending trendline from mid-June, holding structure despite multiple retests. Price recently bounced cleanly from trend support and is now pushing toward prior highs.
The bullish trend remains valid as long as this structure is defended. A close above recent resistance could unlock further upside potential.
🛡️ Support Zones (if pullback occurs):
🟢 Daily Support – Good Entry
Clearly respected zone labeled on your chart. Strong daily demand.
🟡 Weekly Support – Great Entry
Macro support area from prior consolidation. Viewed as a strong swing entry zone.
🔼 Resistance Zone:
🔴 Local High / Recent Resistance
No breakout yet — bulls must reclaim this zone to confirm continuation.
🧭 Outlook:
Bullish Case:
Holding the rising trendline + reclaiming highs would likely trigger further upside movement.
Bearish Case:
Break of the trendline + loss of daily support would open the door to deeper correction.
Bias:
Bullish while structure holds and daily/weekly support levels remain intact.
🌍 Fundamental Insight:
Silver is benefiting from firm industrial demand and a softening U.S. Dollar. Inflation hedging and ETF inflows also continue to support the bullish case. However, upcoming Fed commentary and CPI releases may trigger volatility, especially near resistance.
✅ Conclusion:
XAGUSD is maintaining its bullish trend, supported by well-defined daily and weekly demand zones. As long as the ascending trendline holds, the momentum favors further upside. Bears only take control if structure breaks and demand zones fail.
Not financial advice. Like & follow for more structured market updates.
SILVER trade ideas

XAGUSD SILVER ON 3OTH we are expecting a strong fundamental data .
ADP Non-Farm Employment Change forecast 82K previous -33K
Advance GDP q/q forecast 2.4% previous -0.5% Advance GDP Price Index q/q forecast 2.3% previous 3.8%
Pending Home Sales m/m0.3% 1.8%
7:00pm
USD
Federal Funds Rate
4.50% 4.50%
USD
FOMC Statement
7:30pm
USD
FOMC Press Conference.
we will be watching the data outlook for clear directional bias.

Head & Shoulders Pattern Confirmed bearish sign A clear Head and Shoulders pattern has formed on the 4H timeframe, and confirmation is in place after a decisive break below the neckline around $39.00.
🔍 Technical Breakdown:
Left Shoulder: Formed around July 11–15
Head: July 19–23 peak
Right Shoulder: Developing through July 24–25
Neckline: ~$39.00 zone (now broken)
Current Price: ~$38.30
Target: ~$38.00 – $37.80 (based on pattern projection)
The break below the 50 EMA adds bearish confirmation. Caution is advised unless price reclaims the neckline level.

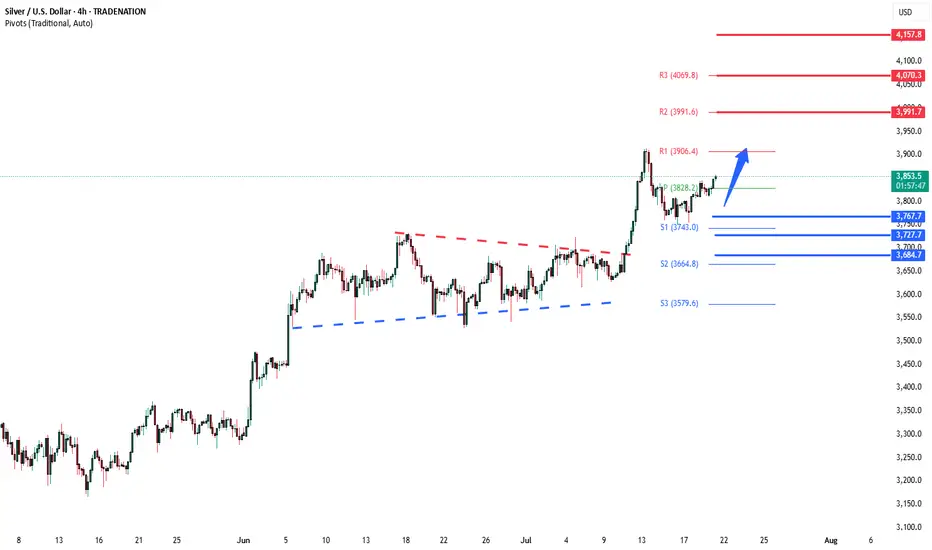
Silver Bullish continuation breakout supported at 3686The Silver remains in a bullish trend, with recent price action showing signs of a continuation breakout within the broader uptrend.
Support Zone: 3686 – a key level from previous consolidation. Price is currently testing or approaching this level.
A bullish rebound from 3686 would confirm ongoing upside momentum, with potential targets at:
3814 – initial resistance
3865 – psychological and structural level
3920 – extended resistance on the longer-term chart
Bearish Scenario:
A confirmed break and daily close below 3686 would weaken the bullish outlook and suggest deeper downside risk toward:
3645 – minor support
3590 – stronger support and potential demand zone
Outlook:
Bullish bias remains intact while the Silver holds above 3686. A sustained break below this level could shift momentum to the downside in the short term.
This communication is for informational purposes only and should not be viewed as any form of recommendation as to a particular course of action or as investment advice. It is not intended as an offer or solicitation for the purchase or sale of any financial instrument or as an official confirmation of any transaction. Opinions, estimates and assumptions expressed herein are made as of the date of this communication and are subject to change without notice. This communication has been prepared based upon information, including market prices, data and other information, believed to be reliable; however, Trade Nation does not warrant its completeness or accuracy. All market prices and market data contained in or attached to this communication are indicative and subject to change without notice.
XAGUSD--SHORT--strong rejection from upper side of green channel
--for second wave of downward movement, expecting first pullback upward to 38.42 level
--entry point is cross-section of,orange channel, black channel!s upper side.
--movement will be down to lower side of green channel.

Chart Analysis on the SilverYou can follow us for more Analysis(Images and Videos) with Precise definition of the Financial Market.ENJOY!!!

#6472025 | XAGUSD Selling opportunity 1:4XAGUSD Selling opportunity Appears in H4 Time Frame Looking Price Action for Long Term Sell
Risk and Reward Ratio is 1:4
After 50 pips Profit Set SL Entry Level
"DISCLAIMER" Trading & investing business is "Very Profitable" as well as risky, so any trading or investment decision should be made after Consultation with Certified & Regulated Investment Advisors, by Carefully Considering your Financial Situation.

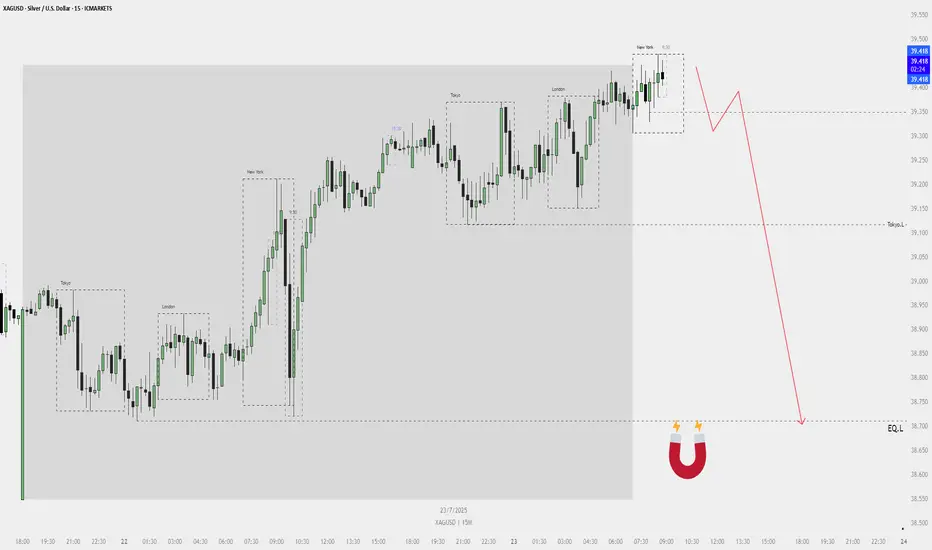
XAGUSD Sell Plan – 15M📉 XAGUSD Sell Plan – 15M
Bias: Bearish
Timeframe: 15-Minute
Date: July 23, 2025
🧠 Reasoning
Liquidity Grab: Price is sweeping short-term highs during New York open.
No More FVGs Above: Price seems to be exhausting upward momentum.
Magnet Below:
Equal lows (EQ_L) acting as a liquidity pool.
Tokyo low also lies below current price — another liquidity target.
High Probability Setup: Clean structure with a likely rejection from current premium zone.
🔴 Sell Strategy (Conceptual)
Wait for a minor liquidity grab or rejection wick to trap buyers.
Confirm a market structure shift or bearish order block.
Sell from that zone aiming for:
🎯 Target 1: Tokyo Low
🎯 Target 2: Equal Lows (Magnet zone)
⚠️ No SL/TP levels shown — trade based on structure and confirmation using your entry system (e.g., 5M DR, bearish FVG, etc.).
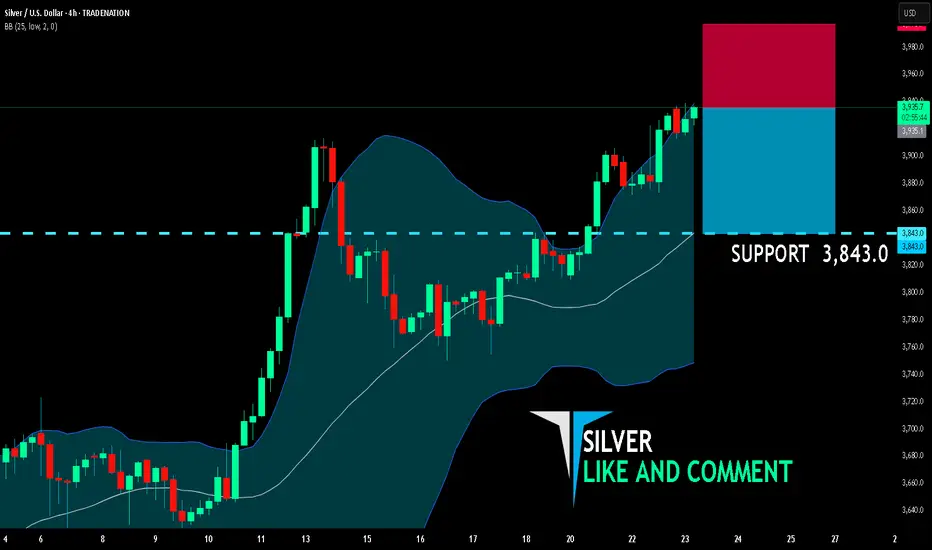
SILVER BEARS ARE GAINING STRENGTH|SHORT
SILVER SIGNAL
Trade Direction: short
Entry Level: 3,935.1
Target Level: 3,843.0
Stop Loss: 3,996.7
RISK PROFILE
Risk level: medium
Suggested risk: 1%
Timeframe: 4h
Disclosure: I am part of Trade Nation's Influencer program and receive a monthly fee for using their TradingView charts in my analysis.
✅LIKE AND COMMENT MY IDEAS✅
SILVER Bullish Breakout! Buy!
Hello,Traders!
SILVER is trading in a strong
Uptrend and the price made a
Bullish breakout of the key
Horizontal level of 39.10$
So we are bullish biased
And we will be expecting a
Further bullish move up
Buy!
Comment and subscribe to help us grow!
Check out other forecasts below too!
Disclosure: I am part of Trade Nation's Influencer program and receive a monthly fee for using their TradingView charts in my analysis.

XAG longXAG prices may rise from $37.9, located at the FVG Zone and Leg of BAT Pattern , towards the targets .

SILVER Retest of Cup and Handle Neckline📈 XAGUSD Trade Idea – July 25, 2025
Timeframe: 4H
Instrument: Silver / USD (XAGUSD)
Direction: Bullish continuation
Entry Zone: $39.00 - $39.10
Current Price: $39.103
🔍 Technical Analysis:
Cup & Handle Pattern: A clean cup formation is visible from July 15–21, followed by a bullish breakout and minor handle-like retracement.
Retest in Progress: Price is retesting the breakout zone around $39.00, showing consolidation above a strong support structure.
Dynamic Support Confluence: Multiple EMAs (green/orange/red cloud) are acting as support, with recent bullish candles bouncing off the mid-band area.
TD Sequential: A new "7" count signals potential continuation of the trend if support holds.
Volume Gap Below: Clean inefficiency (thin volume) below $38.40–$38.00 which may act as a magnet in case of invalidation, but is also untested demand.
📌 Trade Setup:
Entry: Around $39.00–$39.10 on confirmed support hold
Stop Loss: Below $38.50 (beneath EMA and recent higher low)
Take Profit Zones:
TP1: $39.80 (recent swing high)
TP2: $40.60 (measured move from cup breakout)
TP3: $41.00 psychological round number

XAGUSD in Uptrend ContinuationBuy Limit
Entry Price 38.10
Stop Loss 37.86
Risk 1%
Lot Size 0.21
TP (1RR) 38.34
TP (4RR) 39.06

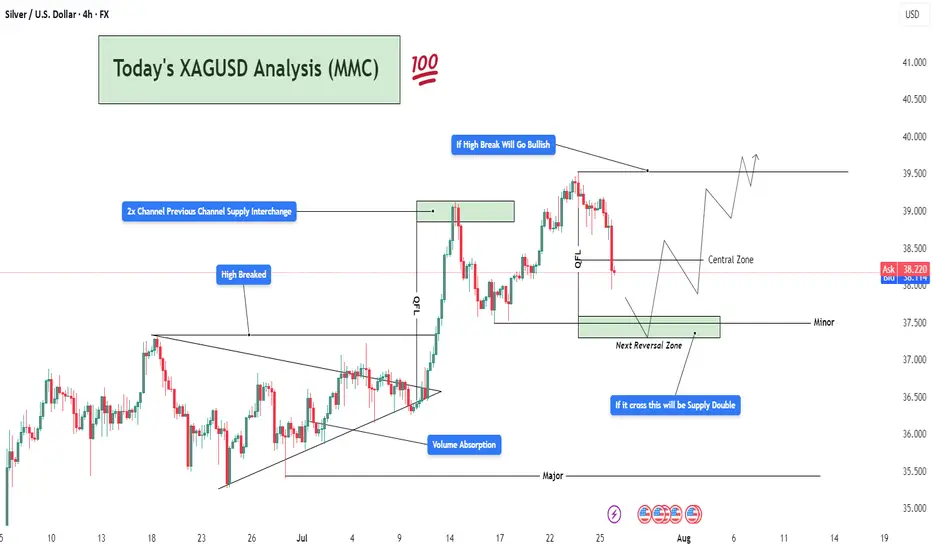
(XAGUSD) Volume Absorption to Bullish Continuation To Target🧱 1. Market Structure Breakdown:
The 4H chart of Silver (XAGUSD) reveals a well-structured price action sequence, beginning with a compression breakout, a strong bullish impulse, and a current retracement phase into a key reversal zone.
🔺 Symmetrical Triangle & Volume Absorption (Early July):
The market was forming higher lows and lower highs, indicative of consolidation inside a symmetrical triangle.
During this phase, a volume absorption event occurred—indicating smart money was accumulating before a breakout.
This was followed by a strong bullish breakout, confirming upside strength and clearing previous highs.
📈 2x Channel Supply Zone — Now Demand:
After breaking above the triangle, the price surged into a key supply zone, created from a prior channel top.
This zone was tested, absorbed, and flipped into a new demand zone, as buyers overwhelmed sellers.
This supply-demand interchange confirmed a structural change in market sentiment.
🚀 2. Momentum Confirmation — High Breakout:
The "High Breaked" level, marked clearly on the chart, acted as a bullish breakout trigger.
This breakout not only breached the prior resistance but established a new bullish leg—providing strong confirmation of trend continuation.
🔁 3. QFL Zone & Controlled Pullback:
After the surge, the price began to correct from the QFL (Quick Flip Level).
This level usually represents an area where short-term distribution or profit-taking occurs.
The pullback from this zone was controlled but sharp, which is natural after such a strong move up.
🟩 4. Next Reversal Zone — The Critical Demand Block:
Price is now entering a high-probability reversal zone, marked around $37.5–$36.8.
This area is critical due to:
Confluence with previous structure and minor support.
Potential bullish absorption area.
Last base before the impulse up.
If bullish price action (like bullish engulfing, pin bar, or volume spike) is seen here, it could signal the start of the next leg up.
🧨 5. Key Warning: "If it crosses, this will be Supply Double"
If this zone fails to hold, the demand will flip into double supply, likely accelerating bearish momentum.
In such case, Silver may revisit Major Support near the $36.0–$35.5 zone.
🧭 Potential Trading Scenarios:
✅ Bullish Path (Primary Expectation):
Price reacts from the reversal zone with bullish momentum.
Breaks back into the Central Zone (~$38.5).
Forms a higher low → continuation toward $39.5–$41.0.
Breakout above the recent swing high confirms the continuation pattern.
Trade Idea:
Long entries near $37.2–$37.5 with SL below $36.8.
Target zones: $38.8 (short-term), $39.8–$41.0 (swing).
❌ Bearish Continuation (Alternative Plan):
Reversal zone fails to hold.
Price breaks and closes below $36.8.
Previous support becomes resistance — bearish retest.
Continuation toward $36.0–$35.5 zone.
Trade Idea:
Short on break and retest of $36.8.
SL above the reversal zone.
TP near $35.5 or based on volume exhaustion.
🧠 Market Psychology Insight:
This setup shows a clear institutional playbook:
Accumulation → Breakout → Profit-taking → Retest → Continuation.
If smart money is active, expect defense of the reversal zone followed by a strong bounce.

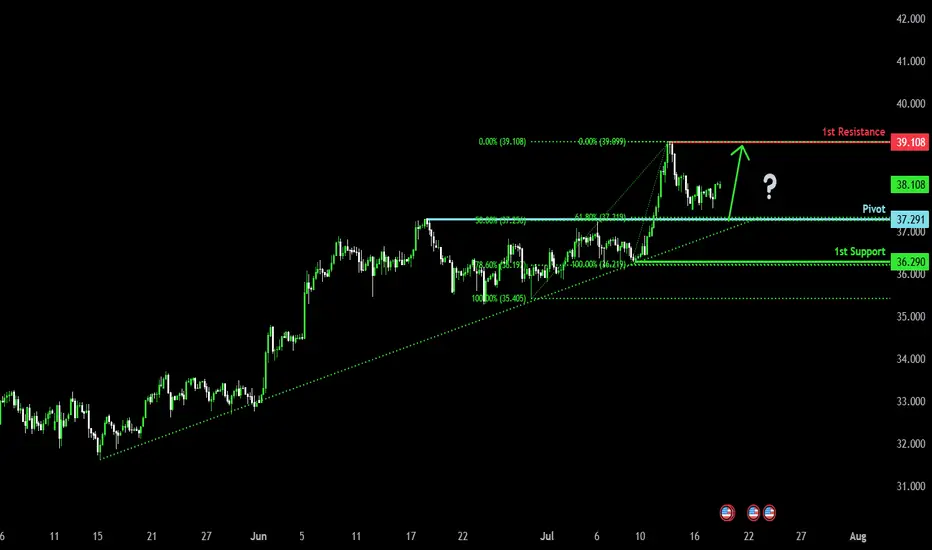
Bullish continuation?The Silver (XAG/USD) is falling towards the pivot and could bounce to the 1st resistance which has been identified as a pullback resistance.
pivot: 37.29
1st Support: 36.29
1st Resistance: 39.10
Risk Warning:
Trading Forex and CFDs carries a high level of risk to your capital and you should only trade with money you can afford to lose. Trading Forex and CFDs may not be suitable for all investors, so please ensure that you fully understand the risks involved and seek independent advice if necessary.
Disclaimer:
The above opinions given constitute general market commentary, and do not constitute the opinion or advice of IC Markets or any form of personal or investment advice.
Any opinions, news, research, analyses, prices, other information, or links to third-party sites contained on this website are provided on an "as-is" basis, are intended only to be informative, is not an advice nor a recommendation, nor research, or a record of our trading prices, or an offer of, or solicitation for a transaction in any financial instrument and thus should not be treated as such. The information provided does not involve any specific investment objectives, financial situation and needs of any specific person who may receive it. Please be aware, that past performance is not a reliable indicator of future performance and/or results. Past Performance or Forward-looking scenarios based upon the reasonable beliefs of the third-party provider are not a guarantee of future performance. Actual results may differ materially from those anticipated in forward-looking or past performance statements. IC Markets makes no representation or warranty and assumes no liability as to the accuracy or completeness of the information provided, nor any loss arising from any investment based on a recommendation, forecast or any information supplied by any third-party.
XAGUSD - Silver - Important levels for the next few years!!These are important levels for the next few years.
I expect a new ATH for Silver. Better know where you buy and where you should sell.
Several CUP & Handle show how much silver is bullish.
After Gold, it's Silver's turn..

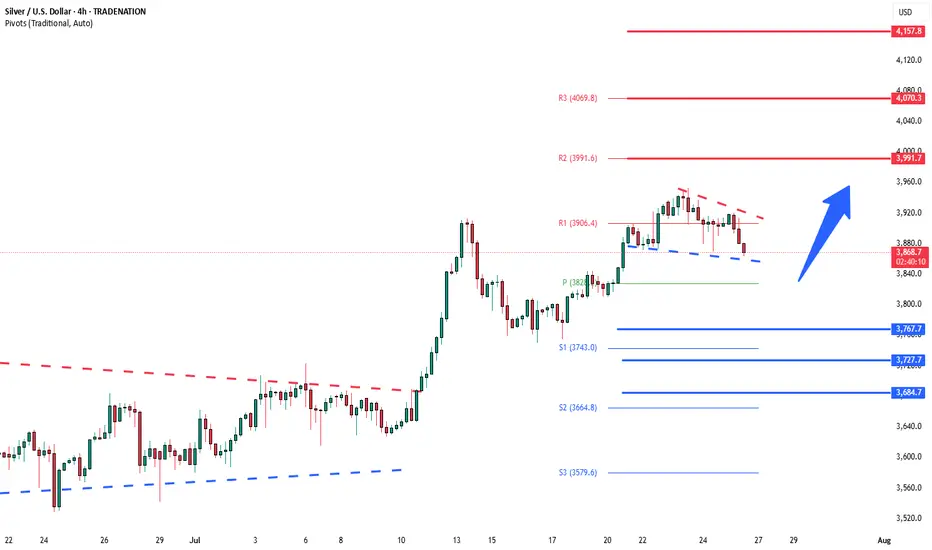
Silver bullish sideways consolidation The Silver remains in a bullish trend, with recent price action showing signs of a continuation breakout within the broader uptrend.
Support Zone: 3686 – a key level from previous consolidation. Price is currently testing or approaching this level.
A bullish rebound from 3686 would confirm ongoing upside momentum, with potential targets at:
3814 – initial resistance
3865 – psychological and structural level
3920 – extended resistance on the longer-term chart
Bearish Scenario:
A confirmed break and daily close below 3686 would weaken the bullish outlook and suggest deeper downside risk toward:
3645 – minor support
3590 – stronger support and potential demand zone
Outlook:
Bullish bias remains intact while the Silver holds above 3686. A sustained break below this level could shift momentum to the downside in the short term.
This communication is for informational purposes only and should not be viewed as any form of recommendation as to a particular course of action or as investment advice. It is not intended as an offer or solicitation for the purchase or sale of any financial instrument or as an official confirmation of any transaction. Opinions, estimates and assumptions expressed herein are made as of the date of this communication and are subject to change without notice. This communication has been prepared based upon information, including market prices, data and other information, believed to be reliable; however, Trade Nation does not warrant its completeness or accuracy. All market prices and market data contained in or attached to this communication are indicative and subject to change without notice.
Silver Wave Analysis – 22 July 2025
- Silver broke resistance level 39.00
- Likely to rise to resistance level 40.00
Silver recently broke the resistance level 39.00, which stopped the previous impulse wave i earlier this month, as can be seen from the daily Silver chart below.
The breakout of the resistance level 39.00 should accelerate the active impulse waves 5 and (C).
Given the clear daily uptrend, Silver can be expected to rise to the next resistance level 40.00, target price for the completion of the active impulse wave iii.

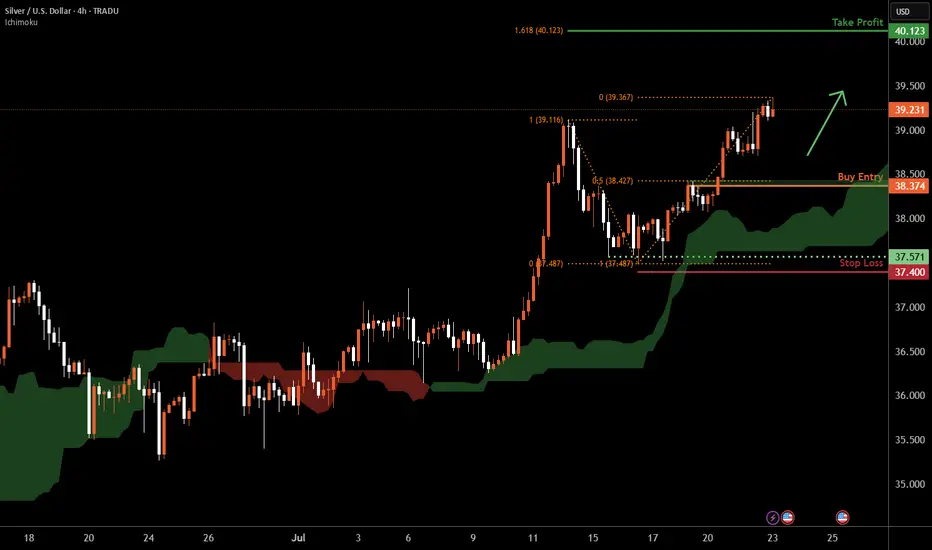
Silver H4 | Falling toward a pullback supportSilver (XAG/USD) is falling towards a pullback support and could potentially bounce off this level to climb higher.
Buy entry is at 38.37 which is a pullback support that aligns with the 50% Fibonacci retracement.
Stop loss is at 37.40 which is a level that lies underneath a multi-swing-low support.
Take profit is at 40.12 which is a resistance that aligns with the 161.8% Fibonacci extension.
High Risk Investment Warning
Trading Forex/CFDs on margin carries a high level of risk and may not be suitable for all investors. Leverage can work against you.
Stratos Markets Limited (tradu.com ):
CFDs are complex instruments and come with a high risk of losing money rapidly due to leverage. 66% of retail investor accounts lose money when trading CFDs with this provider. You should consider whether you understand how CFDs work and whether you can afford to take the high risk of losing your money.
Stratos Europe Ltd (tradu.com ):
CFDs are complex instruments and come with a high risk of losing money rapidly due to leverage. 66% of retail investor accounts lose money when trading CFDs with this provider. You should consider whether you understand how CFDs work and whether you can afford to take the high risk of losing your money.
Stratos Global LLC (tradu.com ):
Losses can exceed deposits.
Please be advised that the information presented on TradingView is provided to Tradu (‘Company’, ‘we’) by a third-party provider (‘TFA Global Pte Ltd’). Please be reminded that you are solely responsible for the trading decisions on your account. There is a very high degree of risk involved in trading. Any information and/or content is intended entirely for research, educational and informational purposes only and does not constitute investment or consultation advice or investment strategy. The information is not tailored to the investment needs of any specific person and therefore does not involve a consideration of any of the investment objectives, financial situation or needs of any viewer that may receive it. Kindly also note that past performance is not a reliable indicator of future results. Actual results may differ materially from those anticipated in forward-looking or past performance statements. We assume no liability as to the accuracy or completeness of any of the information and/or content provided herein and the Company cannot be held responsible for any omission, mistake nor for any loss or damage including without limitation to any loss of profit which may arise from reliance on any information supplied by TFA Global Pte Ltd.
The speaker(s) is neither an employee, agent nor representative of Tradu and is therefore acting independently. The opinions given are their own, constitute general market commentary, and do not constitute the opinion or advice of Tradu or any form of personal or investment advice. Tradu neither endorses nor guarantees offerings of third-party speakers, nor is Tradu responsible for the content, veracity or opinions of third-party speakers, presenters or participants.
demand and supply strategiesprice has failed to hold demand, turning demand to supply
now, i plan to sell from supply to major demand, and hoping to goes to plan so for now we wait for confirmation.
if you have an ulterior analysis please drop...

Silver lets buy the dipB:$37.862
Set up: Buy on the pullback at 0.50 or 0.618 Fib level.
SL:$37.310
TP:$40

XAGUSD 23.07.25~+ Pressure on Powell, Waller is dovish
~+ Anticipation of the Trade deals deadline
~+ XAG didn't sell off immediately after the JP trade deal + XAUXAG downward breakout
+ Risk-on general sentiment after Japan trade deal
