SILVER Massive Long! BUY!
My dear friends,
My technical analysis for SILVER is below:
The market is trading on 32.985 pivot level.
Bias - Bullish
Technical Indicators: Both Super Trend & Pivot HL indicate a highly probable Bullish continuation.
Target - 33.258
About Used Indicators:
A pivot point is a technical analysis indicator, or calculations, used to determine the overall trend of the market over different time frames.
Disclosure: I am part of Trade Nation's Influencer program and receive a monthly fee for using their TradingView charts in my analysis.
———————————
WISH YOU ALL LUCK
SILVER trade ideas

#336025 | XAGUSD Supply Zone 1:4XAGUSD Supply Zone Appears in H4 Time Frame Looking Price Action for Long Term Sell Risk and Reward Ratio is 1:4
After 50 pips Profit Set SL Entry Level
"DISCLAIMER" Trading & investing business is "Very Profitable" as well as risky, so any trading or investment decision should be made after Consultation with Certified & Regulated Investment Advisors, by Carefully Considering your Financial Situation.

Market next target 🔍 Original Analysis Summary:
Bullish Continuation is expected.
Price is projected to rise with a series of higher highs (yellow arrows).
Target area is marked above 34.000 USD.
---
⚠️ Disruption (Bearish/Neutral Counter-View):
1. Flat Consolidation Zone = Distribution Risk
Price has been moving sideways in a tight range (approx. 32.90–33.15), indicating indecision.
This could be a distribution phase, where smart money sells into retail bullishness.
---
2. Weak Volume Profile
Volume is relatively low and not increasing with attempted bullish moves.
A strong breakout should be backed by volume, but current price action lacks conviction.
---
3. False Breakout Trap Risk
Price is testing the upper boundary of a range.
A small push higher could be a bull trap, especially if it reverses back inside the range — a common fake-out setup.

XAG/USD H4 AnalysisWith 3 previous rejections of $32.80 over the back end of May, we saw a glimpse of a 4th at the close of play last Friday.
There is a potential for buys if you agree with this analysis and it meets your strategy rules.

Silver is in the Bearish trend after testing ResistanceHello Traders
In This Chart XAGUSD HOURLY Forex Forecast By FOREX PLANET
today XAGUSD analysis 👆
🟢This Chart includes_ (XAGUSD market update)
🟢What is The Next Opportunity on XAGUSD Market
🟢how to Enter to the Valid Entry With Assurance Profit
This CHART is For Trader's that Want to Improve Their Technical Analysis Skills and Their Trading By Understanding How To Analyze The Market Using Multiple Timeframes and Understanding The Bigger Picture on the Charts

Small Clues In A Big Breakout PatternSilver has been consolidating as of late and if there's one thing we no about contraction is that it eventually leads to expansion aka a breakout.
The issue with this particular setup is that based on location of the pattern, there's no predetermined directional bias for the breakout.
Therefor, what we're doing today is looking for small clues that the market has provided to give us any type of edge in predicting a breakout one way or another and guess what. WE FOUND SOME!
If you have any questions or comments, please leave them below!
Akil

SILVER (XAGUSD): Bullish Momentum Continues Silver (XAGUSD) has been showing strong resilience and upward momentum, reinforcing a generally bullish outlook for the near to medium term. Despite recent minor fluctuations, the underlying fundamentals and technical indicators suggest continued potential for price appreciation.
Technical Observations:
Consolidation & Breakout Potential: Silver has been consolidating, forming a base that could lead to a significant breakout.
Support Levels : Monthly Key support around the $28.00 - $29.00 zone has proven robust, suggesting strong buying interest on dips.
One-Month Chart Perspective: On a one-month chart, you would typically observe the broader trend and significant long-term support/resistance zones. Given the bullish outlook, the one-month chart would likely show a series of higher lows and potentially higher highs, indicating sustained upward momentum. Look for strong monthly closing candles above key psychological levels, which would reinforce the bullish sentiment and suggest continued strength into the next month. Any pullbacks on this timeframe would ideally find support at previous resistance levels, which then act as new support.
Key Price Targets and Predictions (as of late May/early June 2025):
Based on various analyst forecasts and market models, here are some notable price targets for silver:
Short-Term (Q2 2025): Expectation around $33.79 - $34.00 per troy ounce.
Mid-Term (Next 12 months / End of 2025):
Analysts generally forecast targets ranging from $36.00 to $40.00 per ounce.
Some more optimistic predictions reach towards $48.00 - $50.00 per ounce.
Longer-Term (2026-2030): Some projections see silver potentially reaching $75.00 - $80.00 per ounce.
Driving Factors:
Industrial Demand: The increasing adoption of green technologies (solar panels, EVs) continues to drive significant industrial demand for silver.
Safe-Haven Appeal: Ongoing global economic uncertainties and geopolitical tensions enhance silver's role as a safe-haven asset.
Supply Deficits: Persistent supply shortfalls in the silver market are expected to provide upward price pressure.
Monetary Policy: Potential interest rate cuts could make non-yielding assets like silver more attractive.
Strategy:
Maintain a bullish bias while closely monitoring key support and resistance levels. A decisive break above current resistance could confirm further upside.
Disclaimer: This is not financial advice. Trading involves risk, and past performance is not indicative of future results. Always do your own research and consult with a financial professional before making any investment decisions.

XAGUSD Weekly Technical Analysis Breakdown (MMC Style) + Target📈 Chart Summary:
The chart shows the price action of Silver (XAG/USD) on the daily timeframe, capturing a significant shift in market sentiment. This analysis is based on the MMC (Market Maker Cycle) concept and a combination of Smart Money Concepts, Pennant Structure, and Volume Contraction patterns.
Over the past weeks, XAGUSD has transitioned from accumulation and markup to distribution and markdown, suggesting that smart money has exited long positions and is now pushing price toward discount zones for future reaccumulation.
🔍 Detailed Breakdown:
🔹 1. Major Resistance Area – The Selling Origin
At the top of the chart, we see a major resistance zone near $35–$36, which acted as a structural ceiling for months. Each time price approached this area, sellers stepped in aggressively, rejecting price and creating long wicks.
This level represents institutional supply—where big players offload positions, often leaving a liquidity trail behind for later use.
🔹 2. Pennant Formation + Volume Contraction – Classic Distribution
From late April to mid-May, Silver formed a pennant structure, a well-known consolidation pattern. What's special here is the volume contraction—a subtle clue that buyers are drying up while sellers prepare for a large move.
This is a classic Wyckoff distribution behavior:
Buyers are lured in as price moves in a tight range.
Breakout traders enter early expecting a bullish continuation.
Institutions trap liquidity before dumping price into inefficiency.
The mini Break of Structure (BOS) to the upside acted as a false breakout, perfectly engineered to trap liquidity above the pennant.
🔹 3. Structural Breakdown – Momentum Shifts Bearish
Once the trap was complete, price reversed with strong momentum, breaking past key supports and violating internal structure. The label "Structural Analysis" marks the beginning of this break in market structure, confirming the change in character.
This shift aligns with Smart Money’s "Manipulation → Distribution → Expansion" logic.
We also note how price broke below the SR-interchange zone, where support became resistance—a powerful reversal confirmation.
🔹 4. Target + Next Reversal Zone – The Magnet
Currently, Silver is headed toward the $29–$28 zone, highlighted in red as the "Target + Next Reversal" area.
This level has high confluence:
Acts as a previous QFL (Quasimodo Failure Level).
Has unmitigated demand.
Matches with earlier lows where smart money likely accumulated positions.
Here, we can expect either a strong bounce or short-term consolidation before the next directional move.
📌 Confluence Zones:
Key Zone Significance
$35–$36 Major Resistance (Supply / Exit zone)
$33.5 Mini BOS & Liquidity Trap Area
$31.8 – $32.5 Structural Break Zone (Old Demand Broken)
$29 – $28 Target + Reversal (High Confluence Zone)
🧠 Smart Money Perspective:
This entire sequence is not random—it’s engineered.
Institutions:
Collected orders at the bottom.
Pushed price up to resistance.
Consolidated in a pennant to build liquidity.
Triggered a false breakout to trap late buyers.
Dumped aggressively, targeting previous lows for re-entry.
This is the Market Maker Cycle in action — and we’re in the Distribution to Markdown phase right now.
🎯 Trading Plan:
Short-Term Bias: Bearish until $29–$28 is reached.
Swing Traders: Look for signs of reversal in the $28–$29 zone (bullish engulfing, FVG fill, or demand reactivation).
Day Traders: Watch for pullbacks to the $32.5–$33 resistance zone to enter continuation shorts.
🧵 Final Thoughts:
This is a textbook example of how Smart Money manipulates structure, traps liquidity, and moves price in phases. Patterns like pennants, BOS, and SR flips, when combined with volume and context, give us clear directional bias.
If you're still chasing the breakout without understanding the setup behind it, you're trading against those who engineered the move. Understand the structure — or get trapped by it.

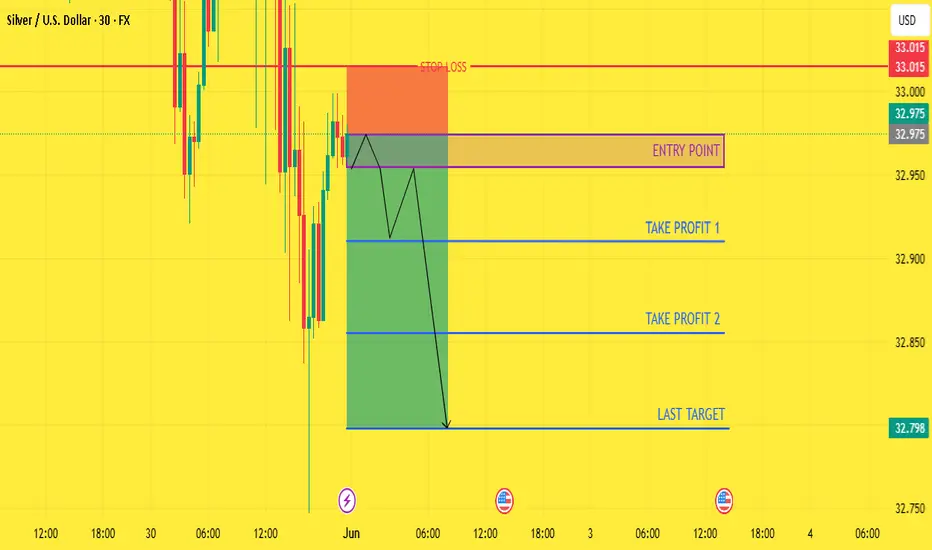
NEXT WEEK XAGUSD BUY NOW READ CAPTAIN( XAGUSD ) SELL zone
( TRADE SATUP)
entry point (32.974) to (32.954) 📊
FIRST TP (32.910)📊
2ND TARGET (32.855) 📊
LAST TARGET (32.798) 📊
STOP LOOS (33.015)❌
Review and Estimation of the 3rd 3 Elite pairsYou can follow us for more Analysis(Images and Videos) with Precise definition of the Financial Market.ENJOY!!!

SILVER: Will Start Growing! Here is Why:
Our strategy, polished by years of trial and error has helped us identify what seems to be a great trading opportunity and we are here to share it with you as the time is ripe for us to buy SILVER.
Disclosure: I am part of Trade Nation's Influencer program and receive a monthly fee for using their TradingView charts in my analysis.
❤️ Please, support our work with like & comment! ❤️

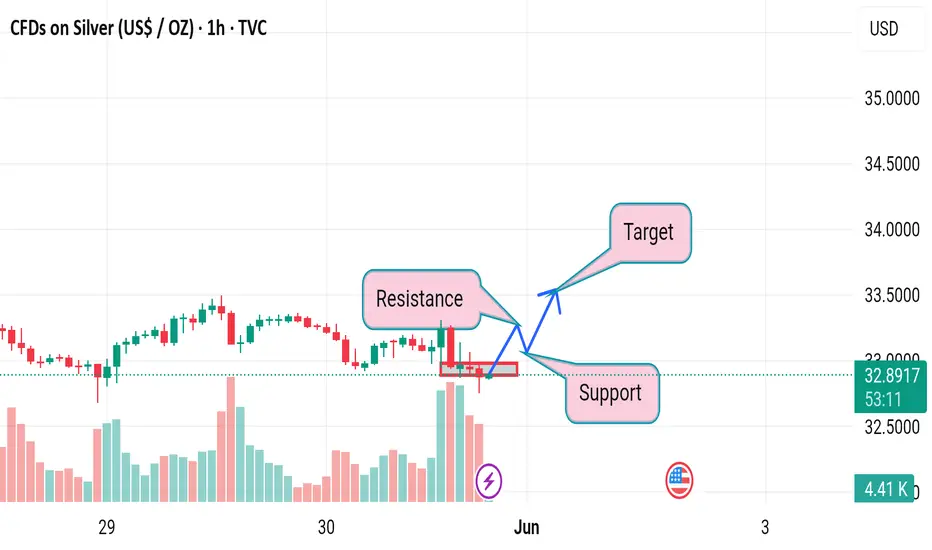
Market next move ⚠️ Disruption of the Bullish Silver Setup:
---
1. Misleading Support-Resistance Interpretation
The resistance zone highlighted is flat and overlapping with multiple wicks.
The support zone is not well-established; it's only tested once or twice with weak bounce reaction, which is not enough to consider it strong support.
---
2. Lack of Bullish Confirmation
The price is currently hovering around the support with no breakout candle or strong bullish engulfing pattern.
The recent candlesticks near resistance are small-bodied with long wicks, suggesting indecision or weakening buying power, not strength.
---
3. Volume Disagreement
There's no surge in bullish volume that would confirm buyers stepping in.
The large red volume bars toward the right indicate selling pressure dominating, which contradicts the bullish target.
SILVER: The Market Is Looking Up! Long!
My dear friends,
Today we will analyse SILVER together☺️
The market is at an inflection zone and price has now reached an area around 32.984 where previous reversals or breakouts have occurred.And a price reaction that we are seeing on multiple timeframes here could signal the next move up so we can enter on confirmation, and target the next key level of 33.109.Stop-loss is recommended beyond the inflection zone.
❤️Sending you lots of Love and Hugs❤️

Strong Fundamental and Sentiment Bias - Bulls Incoming!Bounce on the lower trend, expecting a continuation to the upside, price has been in a range zone for while- low risk setup

LONG SLVER Back to take the Swing low of 4H
Start creating SMT with GOLD in 1H
And after the close 1H as a bullish respected candle, I entered
stop loss belowthe swing low of 1H
DOL is PWH and PDH

Silver expectation 1H (For next week)Watch for the breakout zone, it will show where its going to go, although, looks bearish, when you look at the mini trend, however, price is trying to remain bullish, we have to wait for buyers to step in. Looks keep watching to see...

CHECK XAGUSD SIGNAL READ CAPTAIN( XAGUSD ) SELL zone
( TRADE SATUP)
entry point (33.108) to (33.088) 📊
FIRST TP (33.046)📊
2ND TARGET (33.003) 📊
LAST TARGET (32.934) 📊
STOP LOOS (33.148)❌

Silver INTRADAY Bullish energy build-up Silver continues to exhibit a bullish overall sentiment, supported by a well-established rising trend on the higher timeframes. However, recent intraday price action has transitioned into a consolidation phase, signalling temporary indecision following the latest bullish move.
Key Technical Levels:
Support:
3250 – Critical near-term support; also the previous consolidation zone. A successful retest here would reinforce bullish structure.
3210 – Secondary support; a break below 3250 may prompt a move towards this level.
3170 – Major downside support; a breach would suggest a broader corrective phase.
Resistance:
3375 – Initial upside target if bullish momentum resumes.
3410 – Intermediate resistance; a break here would strengthen the bullish breakout.
3470 – Longer-term resistance; a target for sustained bullish extension.
Technical Outlook:
A corrective pullback toward 3250, followed by a bullish reversal, would confirm a continuation pattern and open the way toward 3375/3410/3470 over a medium to longer-term horizon. Conversely, a daily close below 3250 would invalidate the bullish bias and expose the metal to further downside toward 3210 and 3170.
Conclusion:
Silver remains bullish overall, but near-term direction hinges on the 3250 level. A bounce from this support reaffirms the uptrend, while a break below it warns of deeper correction. Traders should monitor price action closely around 3250 for confirmation of the next directional move.
This communication is for informational purposes only and should not be viewed as any form of recommendation as to a particular course of action or as investment advice. It is not intended as an offer or solicitation for the purchase or sale of any financial instrument or as an official confirmation of any transaction. Opinions, estimates and assumptions expressed herein are made as of the date of this communication and are subject to change without notice. This communication has been prepared based upon information, including market prices, data and other information, believed to be reliable; however, Trade Nation does not warrant its completeness or accuracy. All market prices and market data contained in or attached to this communication are indicative and subject to change without notice.

Analysis on Gold $ SilverYou can follow us for more Analysis(Images and Videos) with Precise definition of the Financial Market.ENJOY!!!

Silver Trade - SwingSilver \ USD upward momentum.
Still in trade from the 22nd and 29th May.
awaiting for Silver to break out towards the $33.70 into the higher liquidity pool.
further with the Trump economics further upwards movement.

XAGUSD Analysis Using MMC | Breakout & Reversal + Target🧠 What the Chart is Telling Us:
Today’s Silver (XAGUSD) price action presents a powerful combination of structural breakout, pattern continuation, and mirror market behavior. Let’s break it down step-by-step so you understand the full picture.
🔸 1. Black Mind Curve Resistance Breakout
At the top-left of the chart, we see a curved descending resistance line (referred to as “Black Mind Curve”). This line has acted as a long-term dynamic resistance, consistently rejecting price action across multiple sessions.
However, after several failed attempts, the price finally broke above this resistance curve—a highly bullish signal. This breakout marks the beginning of a structural shift, where the bearish control starts to weaken and buyers gain momentum.
🔸 2. Support Level and Accumulation
Near mid-May, the price formed a solid horizontal support level. This level was tested multiple times but held firm, suggesting strong accumulation by smart money. According to MMC principles, these accumulation zones are mirrored later as breakout points—which is what we see play out in the chart.
🔸 3. Pennant Pattern Emergence
After the initial curve breakout, the market entered a tight consolidation, forming a Pennant Pattern. This is a continuation pattern formed when the market briefly pauses after a big move.
This pennant acts as a resting phase before another strong impulse—buyers are catching their breath, preparing for a second attack.
🔸 4. Breakout and Candle After Effect (AE)
Once price broke the pennant pattern, we saw an aggressive breakout candle (marked as AE – After Effect). This large candle is a classic liquidity candle that confirms buyer dominance.
In MMC terms, this AE candle reflects momentum that mirrors the impulse leading into the pennant, indicating that the second move will often match the first one in structure or magnitude.
🔸 5. Major Resistance + Break of Structure (BOS)
Above the breakout zone lies a key resistance area, which has now been broken. This is a Break of Structure (BOS) confirming that the market has flipped from a bearish to bullish structure.
This zone, once resistance, may now act as support in future pullbacks—a concept central to Mirror Market Theory, where historical resistance becomes future support (and vice versa).
🔸 6. Reversal Zone Target
The chart shows a projected move toward the Reversal Zone between $34.00–$34.50. This zone aligns with:
Previous highs from historical market structure.
Mirror levels when flipped across the midrange of the price action.
Possible liquidity zones where large institutions may look to reverse or take profits.
This Reversal Zone is where we can expect potential exhaustion in the bullish run, signaling a pause or a minor correction.
📌 Summary of Analysis:
✅ Bullish Confirmation Points:
✅ Breakout above long-term resistance curve
✅ Bullish Pennant Pattern followed by AE breakout
✅ Break of major horizontal resistance (BOS confirmed)
✅ Target toward reversal zone in line with MMC reflection logic
⚠️ What to Watch:
Price action behavior near $34.00–$34.50
Potential bearish engulfing or liquidity sweep in the reversal zone
RSI/Volume divergence signals near top zones
🎯 Final Thoughts:
The Silver market is showing clear bullish momentum supported by strong technical confluence and MMC-based mapping. The current structure favors continuation to the upside, but traders should manage risk as we approach reversal zones where large players may start offloading positions.
🧠 Mirror Market Concept Reminder:
MMC is a strategy based on the mirroring of market behavior—where price levels, patterns, and reactions tend to reflect past structures either directly or inversely. It’s highly effective in spotting key reaction zones, target extensions, and reversals.
💬 What’s Your Take?
Do you agree with this bullish projection, or do you see weakness ahead? Let me know in the comments! And don’t forget to like & share this idea if you found value in it. 🚀

Market next target ⚠️ 1. Bearish Momentum Remains Intact
The last few candles are strongly bearish, with steep declines and high red candle volume.
Attempting to project an upside target amid this current bearish drive lacks alignment with actual market sentiment.
---
📉 2. Lack of Reversal Candlestick Patterns
There is no clear bullish reversal pattern visible at the point of target placement:
No hammer, bullish engulfing, or morning star pattern.
The price may just be pausing before continuing its downward trend.
---
🔊 3. Volume Discrepancy
The rising volume on red candles vs. low volume on recent green candles shows selling pressure outweighs buying interest.
A reliable bullish setup would typically come with higher buying volume after a selloff, which is not yet seen.
---
🧭 4. Misleading “Target” Location
The marked target is at a higher high, near 33.75–34.00 area, which:
Is not supported by immediate technical breakout
Seems to ignore the last failed attempt to break above that level
Appears overly optimistic given the current trend direction

Silver long So befor was in HTF BIAS WAS bullish
And was waiting for the liquidity to sick after that Price create FVG on 4H in discount price back to it and started going higher and i take my entry in 5min FVG stop loss was below fvg
Let see how will take the DOL
