SILVER: Next Move Is Up! Long!
My dear friends,
Today we will analyse SILVER together☺️
The price is near a wide key level
and the pair is approaching a significant decision level of 38.823 Therefore, a strong bullish reaction here could determine the next move up.We will watch for a confirmation candle, and then target the next key level of 38.872.Recommend Stop-loss is beyond the current level.
❤️Sending you lots of Love and Hugs❤️
SILVER trade ideas

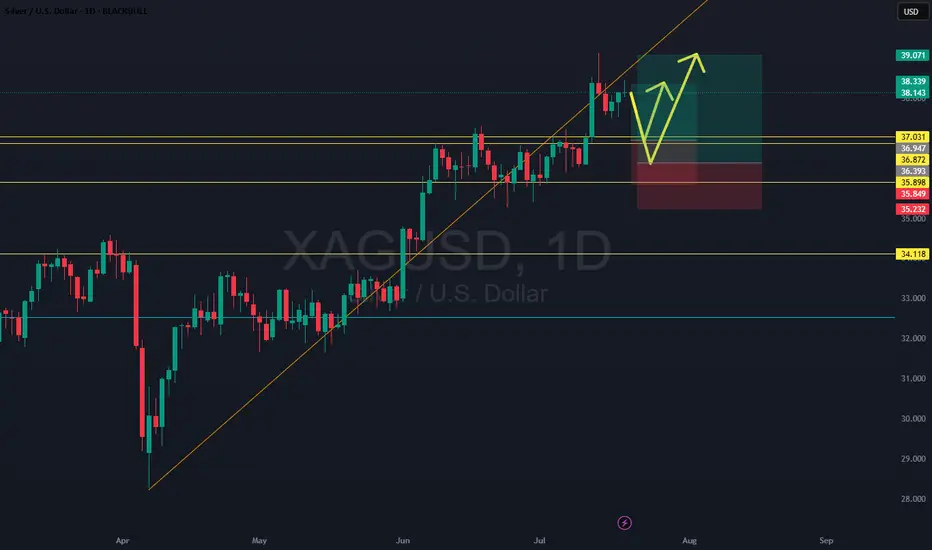
Silver Breakout: Retest & Launch? Two Entries, One Bullish BiasSilver’s uptrend is alive and kicking—with the daily breakout confirming bullish momentum. Price looks primed for a retest before a potential aggressive push toward new highs. We’re eyeing two entry scenarios: a conservative play with higher fill probability and a more aggressive setup with better structural protection but less chance of triggering. Both setups align with the same core thesis—momentum is strong, and this breakout could accelerate.
Silver Trades Above $38.3 Amid Safe-Haven Demand and Industrial NYSE:TVC : SILVER Silver is trading above $38.3, supported by safe-haven flows and resilience in industrial demand. The metal outpaces gold on the back of stronger relative momentum and inflation expectations.

Silver Holds Near $38.40 with Bullish MomentumAs of July 21, 2025, silver (XAG/USD) trades between $38.20 and $38.40, maintaining its upward trend. Key resistance is at $38.50; a break above could lead to $39.10–$40.00. Strong support is at $37.00 and $36.80. The RSI is nearing overbought, suggesting a possible short-term correction.
Upcoming U.S. CPI and PPI data may raise Fed rate cut expectations, supporting silver. Geopolitical risks and U.S. trade policies are supporting safe-haven demand, while strong industrial use in renewable energy and electronics also supports prices. The medium-term outlook remains positive.
Silver faces resistance at 38.50, with higher levels at 39.50 and 40.10. Support is found at 37.20, followed by 36.85 and 35.50.
Silver Stays Strong on China Growth HopesSilver remained firm around $38.90 per ounce, holding near its highest levels since 2010. A weaker dollar and lower U.S. yields underpinned the metal, while traders await Fed Chair Powell’s comments and trade updates ahead of the August 1 deadline. China’s pledge to boost industrial growth also added to silver’s positive outlook.
Resistance is at $39.50, with support at $37.40.

SILVER - NEW BREAKOUT !Hello Traders !
The Silver price formed a bullish descending triangle!
Currently, the resistance level (37.50 - 36.50) is broken!
This key level becomes new support level!
So, I expect a new bullish move🚀
______________
TARGET: 41.50🎯

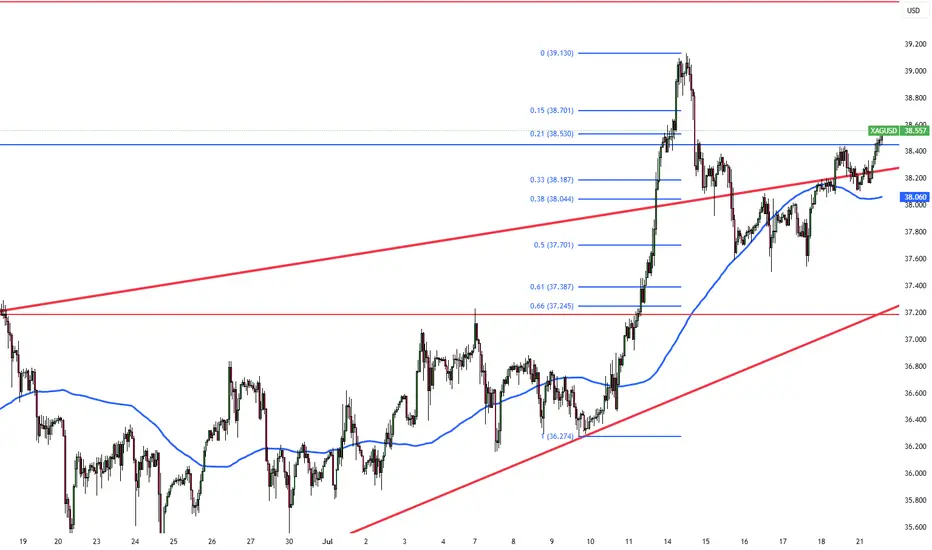
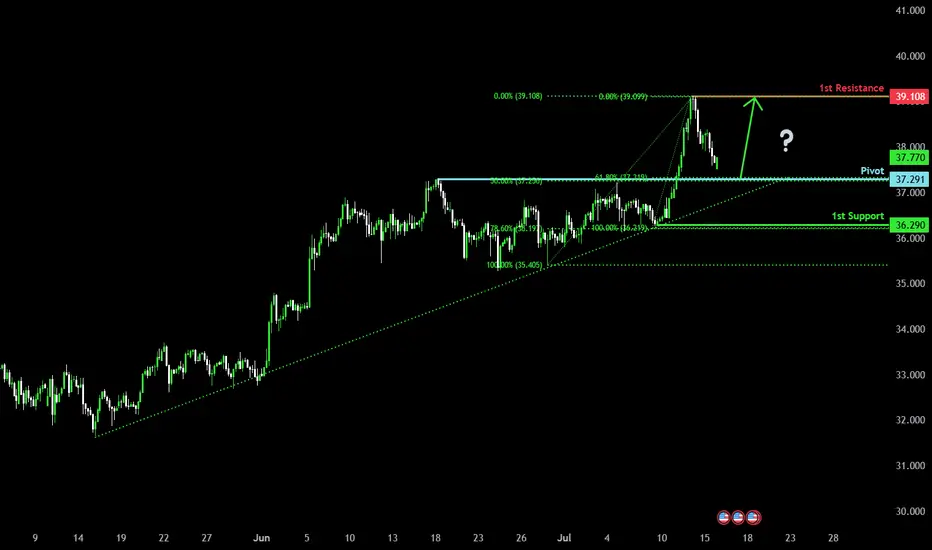
Falling towards the pullback support?The Silver (XAG/USD) is falling towards the pivot which acts as a pullback support and could bounce to the 1st resistance which is a pullback resistance.
Pivot: 37.29
1st Support: 36.29
1st Resistance: 39.10
Risk Warning:
Trading Forex and CFDs carries a high level of risk to your capital and you should only trade with money you can afford to lose. Trading Forex and CFDs may not be suitable for all investors, so please ensure that you fully understand the risks involved and seek independent advice if necessary.
Disclaimer:
The above opinions given constitute general market commentary, and do not constitute the opinion or advice of IC Markets or any form of personal or investment advice.
Any opinions, news, research, analyses, prices, other information, or links to third-party sites contained on this website are provided on an "as-is" basis, are intended only to be informative, is not an advice nor a recommendation, nor research, or a record of our trading prices, or an offer of, or solicitation for a transaction in any financial instrument and thus should not be treated as such. The information provided does not involve any specific investment objectives, financial situation and needs of any specific person who may receive it. Please be aware, that past performance is not a reliable indicator of future performance and/or results. Past Performance or Forward-looking scenarios based upon the reasonable beliefs of the third-party provider are not a guarantee of future performance. Actual results may differ materially from those anticipated in forward-looking or past performance statements. IC Markets makes no representation or warranty and assumes no liability as to the accuracy or completeness of the information provided, nor any loss arising from any investment based on a recommendation, forecast or any information supplied by any third-party.
One Shot, Clear Strategy – Silver Buy Zone in SightHey everyone 👋
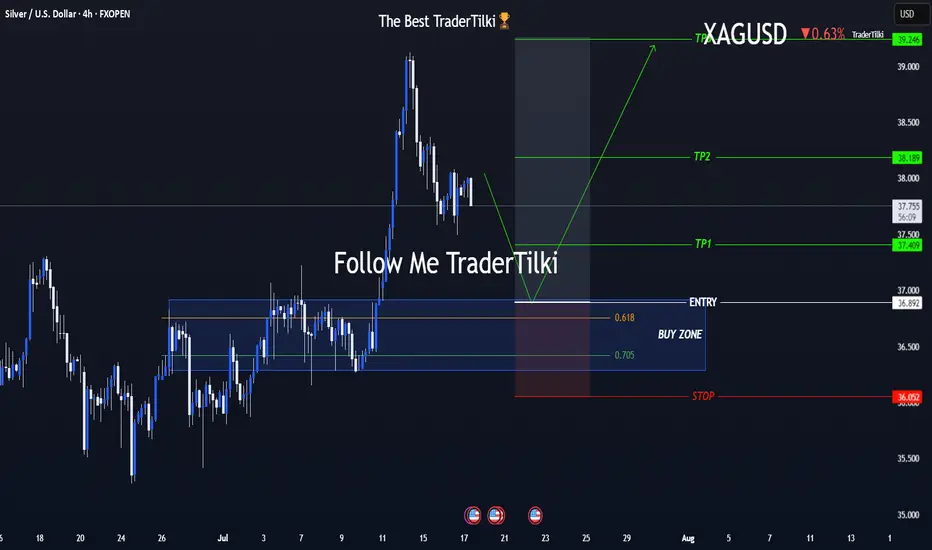
📌 BUY LIMIT ORDER / XAGUSD-SILVER Key Levels
🟢 Entry: 36,892
🎯 Target 1: 37,409
🎯 Target 2: 38,189
🎯 Target 3: 39,246
🔴 Stop: 36,052
📈 Risk/Reward Ratio: 2,79
I double-checked the levels and put together a clean, focused analysis just for you. Every single like seriously boosts my motivation to keep sharing 📈 Your support means the world to me! Huge thanks to everyone who likes and backs this work 💙 Our goals are crystal clear, our strategy is solid. Let’s keep moving forward with confidence and smart execution!
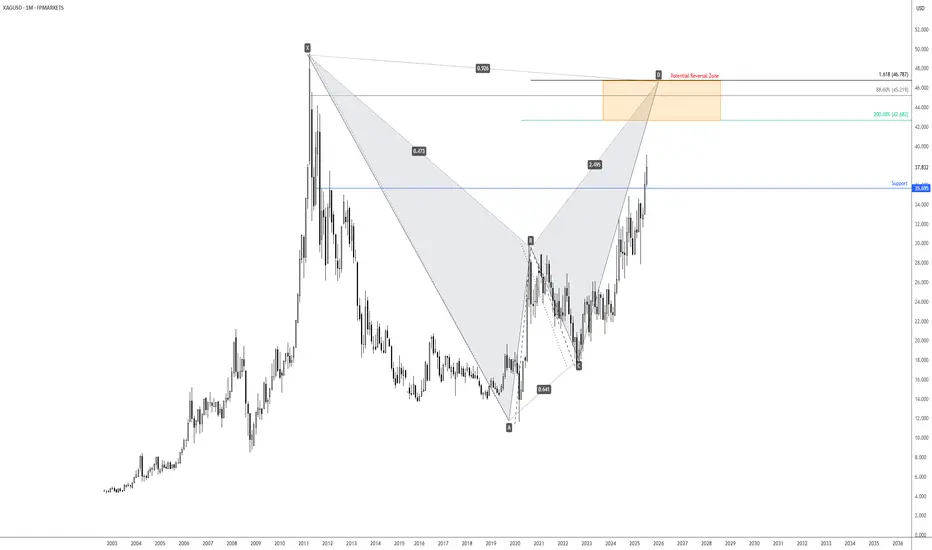
Long-term bearish bat pattern on SilverLonger-term price action on the price of Spot Silver (XAG/USD) is on track to shake hands with a Potential Reversal Zone (PRZ) of a monthly bat pattern between US$46.79 and US$42.68. What this also tells Silver traders is that according to this pattern’s structure, there is scope for additional outperformance. As a result, I am closely monitoring monthly support from US$35.70 in the event of a pullback unfolding.
Written by FP Markets Chief Market Analyst Aaron Hill
Silver Update (XAGUSD): Eyeing the Next Move After the $39 SurgeAs mentioned in my Friday analysis, Silver ( TRADENATION:EURUSD XAGUSD) was preparing for an important breakout — and indeed, the market delivered. The clean break through resistance triggered a strong acceleration, pushing the metal up to $39, pretty close to the psychological $40 level.
Now, we’re seeing a healthy correction after this steep rise, and this could turn into a buying opportunity for the bulls.
📌 Key support zone:
The ideal area to watch is between $37.20 and $37.50 — this is the sweet spot where bulls might step back in.
But be aware:
👉 After strong breakouts, the broken resistance doesn’t always get retested — sometimes the price rebounds from higher levels.
🎯 Plan of Action:
• Monitor price action under $38
• Watch for reaction patterns and structure shifts
• Don’t force entries — let the market confirm
Silver remains strong as long as the structure holds, and this pullback might just be the market catching its breath before another leg up. 🚀
Disclosure: I am part of TradeNation's Influencer program and receive a monthly fee for using their TradingView charts in my analyses and educational articles.

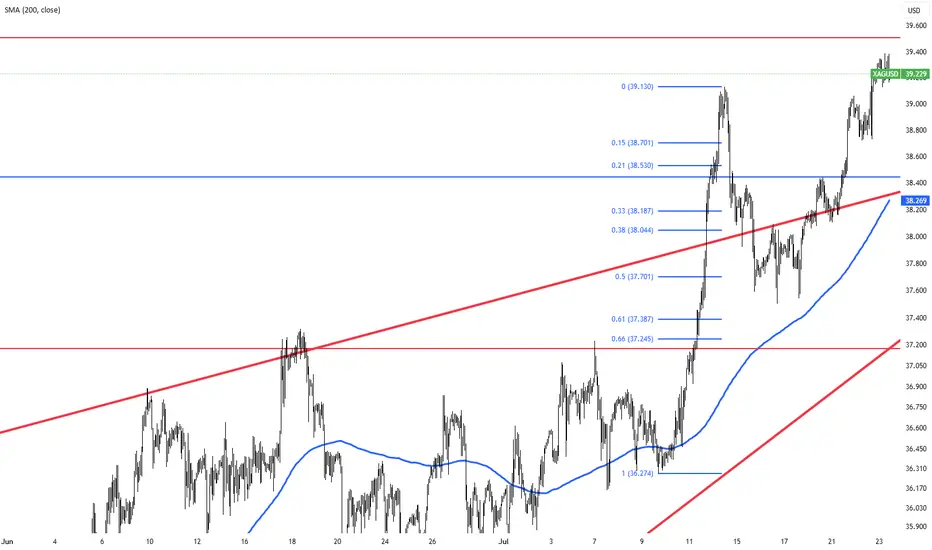
Bullish continuation off pullback support?The Silver (XAG/USD) is falling towards the support which is a pullback support that aligns with the 50% Fibonacci retracement and could bounce from this level too ur take profit.
Entry: 37.24
Why we like it:
There is a pullback support that aligns with the 50% Fibonacci retracement.
Stop loss: 36.49
Why we like it:
There is an overlap support that lines up with the 71% Fibonacci retracement.
Take profit: 39.12
Why we like it:
There is a swing high resistance.
Enjoying your TradingView experience? Review us!
Please be advised that the information presented on TradingView is provided to Vantage (‘Vantage Global Limited’, ‘we’) by a third-party provider (‘Everest Fortune Group’). Please be reminded that you are solely responsible for the trading decisions on your account. There is a very high degree of risk involved in trading. Any information and/or content is intended entirely for research, educational and informational purposes only and does not constitute investment or consultation advice or investment strategy. The information is not tailored to the investment needs of any specific person and therefore does not involve a consideration of any of the investment objectives, financial situation or needs of any viewer that may receive it. Kindly also note that past performance is not a reliable indicator of future results. Actual results may differ materially from those anticipated in forward-looking or past performance statements. We assume no liability as to the accuracy or completeness of any of the information and/or content provided herein and the Company cannot be held responsible for any omission, mistake nor for any loss or damage including without limitation to any loss of profit which may arise from reliance on any information supplied by Everest Fortune Group.

"XAG/USD: Pirate’s Treasure Trade! Bullish & Loaded"🚨 SILVER HEIST ALERT! 🚨 XAG/USD Bullish Raid Plan (Thief Trading Style) 💰🎯
🌟 Attention Market Pirates & Profit Raiders! 🌟
🔥 Thief Trading Strategy Activated! 🔥
📌 Mission Brief:
Based on our elite Thief Trading analysis (technical + fundamental heist intel), we’re plotting a bullish robbery on XAG/USD ("The Silver Market"). Our goal? Loot profits near the high-risk resistance zone before the "Police Barricade" (bear traps & reversals) kicks in!
🚨 Trade Setup (Day/Swing Heist Plan):
Entry (📈): "The vault is open! Swipe bullish loot at any price!"
Pro Tip: Use buy limits near 15M/30M swing lows for safer pullback entries.
Advanced Thief Move: Layer multiple DCA limit orders for maximum stealth.
Stop Loss (🛑): 36.900 (Nearest 1H candle body swing low). Adjust based on your risk tolerance & lot size!
Target (🎯): 39.500 (or escape early if the market turns risky!).
⚡ Scalper’s Quick Loot Guide:
Only scalp LONG!
Rich thieves? Go all-in! Broke thieves? Join swing traders & execute the plan slowly.
Use trailing SL to lock profits & escape safely!
💎 Why Silver? (Fundamental Heist Intel)
✅ Bullish momentum in play!
✅ Macro trends, COT data, & intermarket signals favor upside!
✅ News-driven volatility? Expect big moves!
⚠️ WARNING: Market Cops (News Events) Ahead!
Avoid new trades during high-impact news!
Trailing stops = Your best escape tool!
💥 BOOST THIS HEIST!
👉 Hit LIKE & FOLLOW to strengthen our robbery squad! More lucrative heists coming soon! 🚀💰
🎯 Final Note: This is NOT financial advice—just a thief’s masterplan! Adjust based on your risk & strategy!
🔥 Ready to Raid? Let’s STEAL Some Profits! 🏴☠️💸
👇 Drop a comment & boost the plan! 👇
#XAGUSD #SilverHeist #ThiefTrading #ProfitPirates #TradingViewAlerts
(🔔 Stay tuned for the next heist!) 🚀🤫

XAGUSD(SILVER):To $60 the silver is new gold, most undervaluedSilver has shown remarkable bullish behaviour and momentum, in contrast to gold’s recent decline. Despite recent news, silver remains bullish and unaffected by these developments. We anticipate that silver will reach a record high by the end of the year, potentially reaching $60.
There are compelling reasons why we believe silver will be more valuable in the coming years, if not months. Firstly, the current price of silver at 36.04 makes it the most cost-effective investment option compared to gold. This presents an attractive opportunity for retail traders, as gold may not be suitable for everyone due to its nature and price.
Silver’s price has increased from 28.47 to 36.25, indicating its potential to reach $60 in the near future. We strongly recommend conducting your own analysis before making any trading or investment decisions. Please note that this analysis is solely our opinion and does not guarantee the price or future prospects of silver.
We appreciate your positive feedback and comments, which encourage us to provide further analysis. Your continuous support over the years means a lot to us.
We wish you a pleasant weekend.
Best regards,
Team Setupsfx
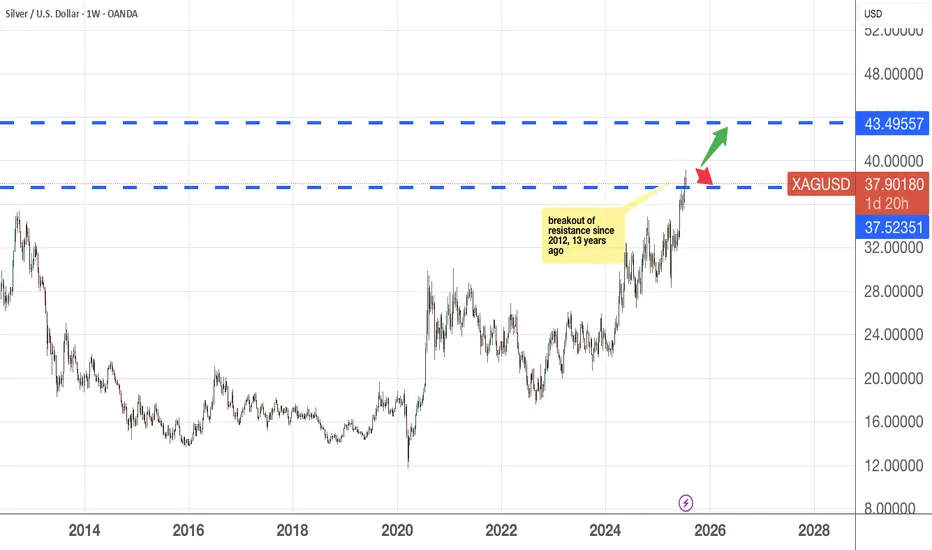
Silver lining in Silver If you bought silver 13 years ago, you would probably break even minus the inflation costs that you have to bear. Now, if this trend continues, that is it stays above the 37.52 mark and remains bullish, then the next resistance it will revisit will be 43.49.
Do set aside 5-10% of your capital into Gold and/or Silver , this would be a good hedge in the coming months/years.
As usual, please DYODD
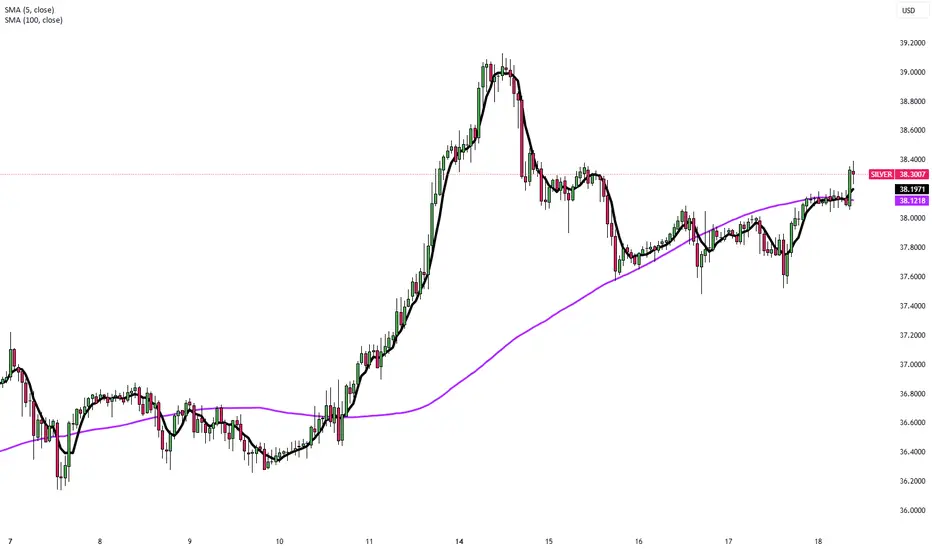
Silver: Bullish Setup from Accumulation ZoneSilver touched its support level at $37.50 and quickly bounced back into the accumulation zone.
From the current levels, I expect an upward breakout. The setup looks very bullish.
I'm going long from the current price of $38. Stop-loss is placed just below the local low at $37.50. A break below $37.50 would signal further downside toward the next strong support around $36.75–$37, where I’d reassess the long opportunity. But honestly, I see this scenario as unlikely.
Targets are all the round numbers: $40, $41, and so on (classic—markets are psychological, and people tend to focus on clean, round numbers). Additional targets include $43.50 and $48.25, which align with levels from 2011–2012.
And look at how harmonious the chart looks.
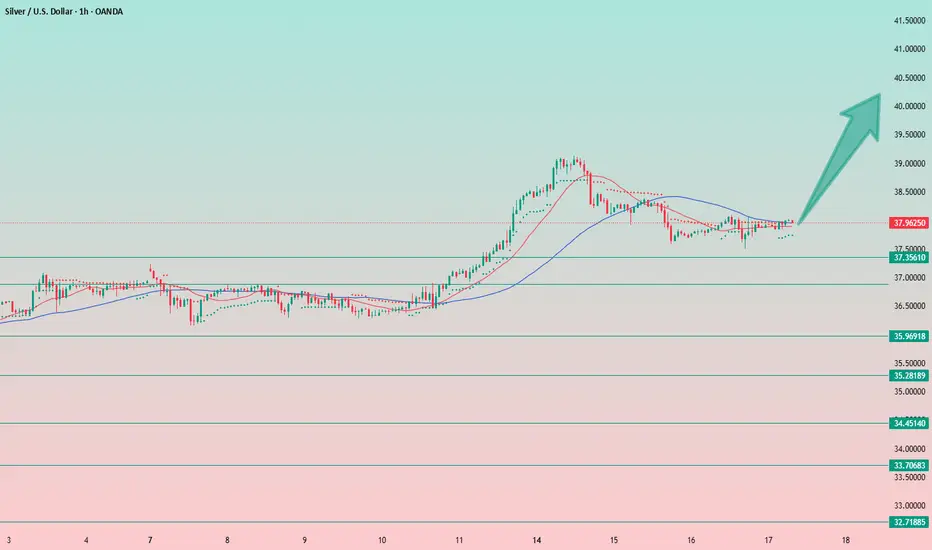
Volatility is decreasing, the entire structure is stretching out on the hourly timeframe.
We're seeing accumulation followed by an expected breakout, and based on all external factors, an upward move seems likely.
📝Trading Plan
Entry: Entry at current prices and in the 37.75–38.25 range — the long position remains valid.
In fact, the long setup remains valid even at slightly higher levels (but not below), although the stop-loss starts to widen and exceeds 2%. If you're okay with that, then it's still a viable long opportunity.
Stop Loss: Below yesterday's low at $37.50
Target: The first target is $40, and the global target is $ 48.25.
However, it's unlikely we'll reach that level in one move — there will likely be re-entries along the way.

SILVER: Strong Bullish Sentiment! Long!
My dear friends,
Today we will analyse SILVER together☺️
The in-trend continuation seems likely as the current long-term trend appears to be strong, and price is holding above a key level of 38.281 So a bullish continuation seems plausible, targeting the next high. We should enter on confirmation, and place a stop-loss beyond the recent swing level.
❤️Sending you lots of Love and Hugs❤️

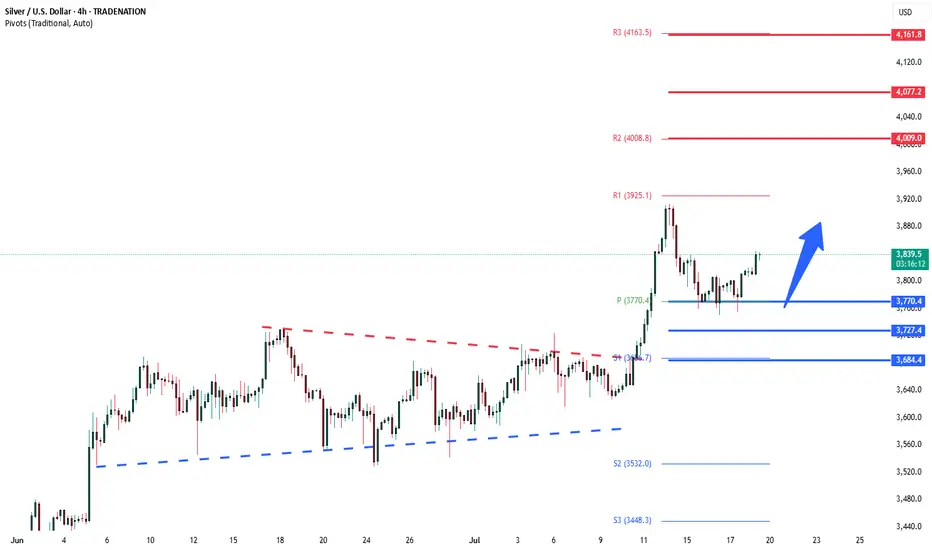
Silver bullish above 3770The Silver remains in a bullish trend, with recent price action showing signs of a continuation breakout within the broader uptrend.
Support Zone: 3770 – a key level from previous consolidation. Price is currently testing or approaching this level.
A bullish rebound from 3770 would confirm ongoing upside momentum, with potential targets at:
4000 – initial resistance
4077 – psychological and structural level
4160 – extended resistance on the longer-term chart
Bearish Scenario:
A confirmed break and daily close below 3770 would weaken the bullish outlook and suggest deeper downside risk toward:
3727 – minor support
3685 – stronger support and potential demand zone
Outlook:
Bullish bias remains intact while the Silver holds above 3770. A sustained break below this level could shift momentum to the downside in the short term.
This communication is for informational purposes only and should not be viewed as any form of recommendation as to a particular course of action or as investment advice. It is not intended as an offer or solicitation for the purchase or sale of any financial instrument or as an official confirmation of any transaction. Opinions, estimates and assumptions expressed herein are made as of the date of this communication and are subject to change without notice. This communication has been prepared based upon information, including market prices, data and other information, believed to be reliable; however, Trade Nation does not warrant its completeness or accuracy. All market prices and market data contained in or attached to this communication are indicative and subject to change without notice.
Silver Rebounds Toward $38 as Dollar EasesSilver rebounded toward $38 per ounce on Friday, recovering from a two-day decline as the U.S. dollar and Treasury yields eased. The move reflected shifting sentiment on Fed policy and trade conditions after earlier losses sparked by inflation data that reduced hopes for near-term rate cuts.
U.S. stock futures edged higher following record closes for the S&P 500 and Nasdaq, driven by strong retail sales, lower jobless claims, and optimism in AI-related tech stocks after Taiwan Semiconductor’s positive forecast. On monetary policy, Fed officials remain divided: Mary Daly expects two rate cuts this year, while Adriana Kugler urges caution due to tariff-driven inflation. President Trump reinforced trade tensions by sending letters to over 20 partners setting new tariffs between 20% and 40%.
In corporate updates, United Airlines expects stronger earnings in the second half of 2025, and Chevron signaled higher future cash flow as production in its top U.S. oil field nears a plateau.
Resistance is at 38.50, while support holds at 37.20.
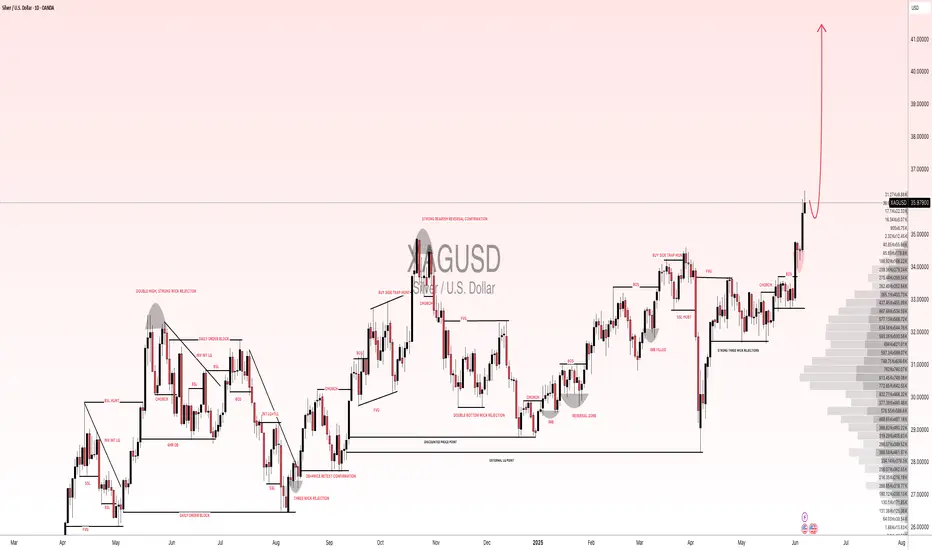
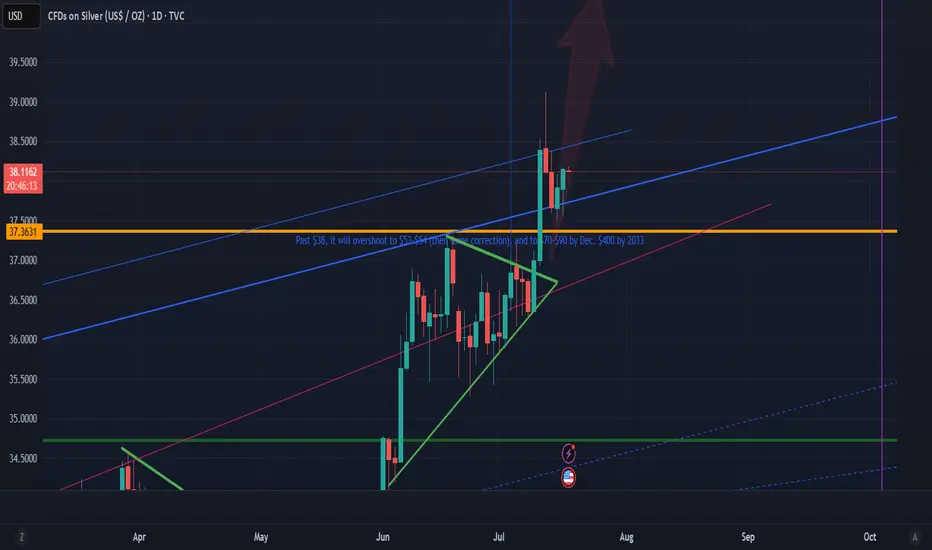
Vertical spike to blow past 50 is imminent Vertical spike to blow past 50 is imminent. It may not stop maybe until $70. Banks is running out of SLV stocks to short silver. Get ready.... This moment will never happen again. Position position NOW.
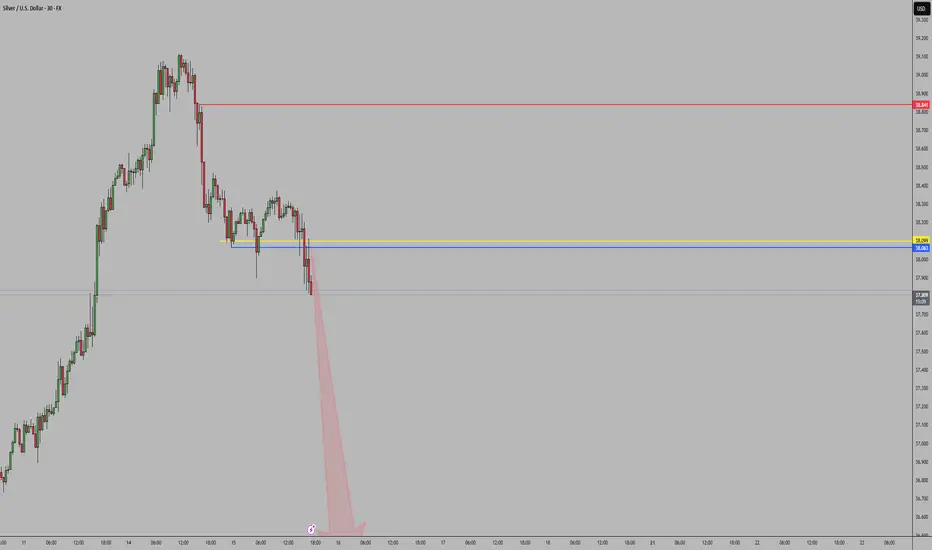
Silver (XAGUSD) – Watch for Bullish Reaction at Key Liquidity ZoDescription:
Silver is now approaching a key liquidity and structural support zone between 37.2805 and 36.8841 (marked by the bottom two blue lines on the chart). This area is likely to attract significant attention, with the potential for stop-losses of buyers below the prior structure to be triggered—a classic liquidity grab scenario.
Trading Idea:
Do NOT enter blindly at these levels.
Wait for price to dip into the 37.28–36.88 range, ideally triggering a liquidity sweep and a spike in volume.
Only consider a long entry after a clear bullish reaction in this zone—such as a strong reversal candle, a bullish engulfing, or a pronounced uptick in net volume.
For extra confirmation, look for a retest of the zone after the first reaction, to confirm that the level is holding as support.
Risk Management:
Stop-loss below the lower end of the entry zone (under 36.88) or the liquidity sweep low.
Target the next resistance levels: 37.88, 38.40, and 38.99–39.00.
Key Points:
The 37.28–36.88 area is a liquidity zone—expect increased volatility and potential for fake-outs.
Wait for confirmation and ideally a retest before considering entry.
Ignore the entry zone if price simply breaks through without a bullish reaction.
Summary:
Let price sweep liquidity and show its hand in the 37.28–36.88 zone. Only enter on clear bullish confirmation and a solid retest. Trade what you see, not what you hope for!

XAGUSDXAG/USD is currently exhibiting an increasingly bearish net position from major institutional players. Given this positioning, a continued bearish outlook is anticipated for the upcoming week.