SILVER (XAGUSD): Great Opportunity to BuyThe price of SILVER formed an important bullish pattern after testing a key daily support level.
I spotted an inverted head and shoulders pattern on hourly chart, with a clear breakout above the horizontal neckline.
It is possible that the price will continue to rise, with the next resistance level at 34.37.
SILVER trade ideas

SILVER UP IN THE DAY BY +0.84% DESPITE A RELATIVE STRONG DOLLAROn Monday April 28, 2025, President Donald Trump announced plans to ease the impact of his automotive tariffs, aiming to alleviate concerns from automakers and consumers. In response to this, the dollar index started making recovery from previous week losses, however the dollar index is somewhat steady around 99.29 as markets awaits the key events this week.
From technical standpoint, Sliver prices was supported at 32.66 which aligns with EMA 50 and is seen approaching a resistance zone, where 33.66 per ounce stands to be the peak of the zone. Having tested this supply zone in retrospect, this level could halt price movements. But a brake above this level could open room for further bullish rally with potential target around 34.00 and 34.40. On the other hand, a bearish momentum would likely drive prices towards 32.78. A break below this price level opens up room for further decline with potential target around 32.10 acting as two weeks low. Further break out of the levels are not ruled out according to technical analysts.
UPCOMING CATALYST.
On the radar this week: Markets await the JOLTs report today, April 29, at 6:00 PM GMT+4, followed by U.S. GDP Q/Q, Employment Cost Index, and Core Price Index tomorrow, April 30, at 4:30 PM GMT+4.
Focus would be shifted to The Bank of Japan’s monetary policy statement and economic outlook on Thursday, while the U.S. jobs report will wrap up the week on Friday.
These key events could trigger some market volatility.

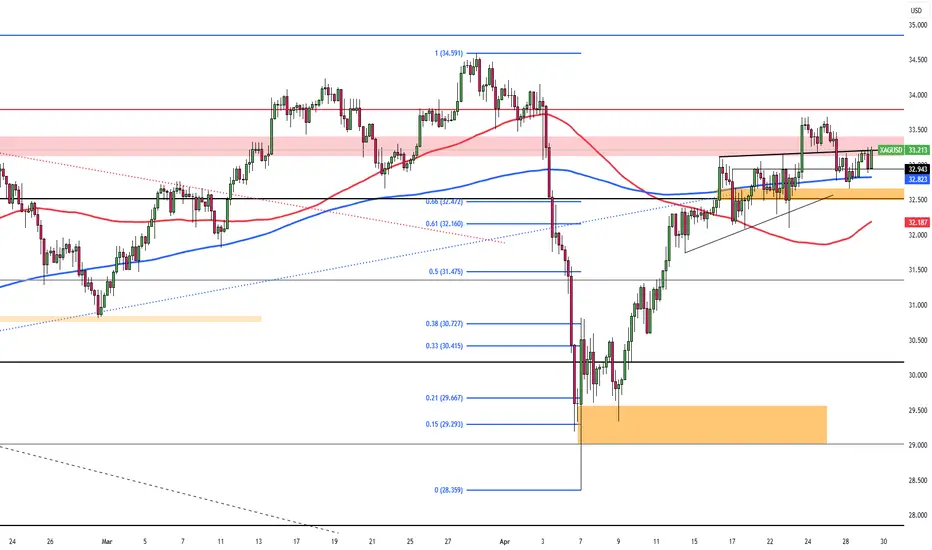
Silver INTRADAY breakout retest supported at 3247Silver INTRADAY uptrend continuation supported at 3247
Key Support and Resistance Levels
Resistance Level 1: 3383
Resistance Level 2: 3414
Resistance Level 3: 3457
Support Level 1: 3247
Support Level 2: 3184
Support Level 3: 3112
This communication is for informational purposes only and should not be viewed as any form of recommendation as to a particular course of action or as investment advice. It is not intended as an offer or solicitation for the purchase or sale of any financial instrument or as an official confirmation of any transaction. Opinions, estimates and assumptions expressed herein are made as of the date of this communication and are subject to change without notice. This communication has been prepared based upon information, including market prices, data and other information, believed to be reliable; however, Trade Nation does not warrant its completeness or accuracy. All market prices and market data contained in or attached to this communication are indicative and subject to change without notice.

Silver Falls to $33.00 on Trade OptimismSilver (XAG/USD) slipped to around $33.00 on Tuesday as safe-haven demand eased amid improving U.S.-China trade sentiment and a stronger U.S. dollar. Optimism grew after Trump suggested tariff rollbacks and China granted exemptions. Treasury Secretary Bessent confirmed ongoing talks and positive proposals. Markets now await key US data, Q1 GDP, PCE inflation, and Nonfarm Payrolls for clues on Fed policy.
Technically, the first resistance level is located at 33.80. In case of its breach 34.20 and 34.85 could be monitored respectively. On the downside, first support is at 32.50. 31.40 and 30.20 would become the next support levels if this level is passed.

Potential bearish drop?The Silver (XAG/USD) has rejected off the pivot and could drop to the 1st support which acts as a pullback support.
Pivot: 33.12
1st Support: 32.16
1st Resistance: 33.67
Risk Warning:
Trading Forex and CFDs carries a high level of risk to your capital and you should only trade with money you can afford to lose. Trading Forex and CFDs may not be suitable for all investors, so please ensure that you fully understand the risks involved and seek independent advice if necessary.
Disclaimer:
The above opinions given constitute general market commentary, and do not constitute the opinion or advice of IC Markets or any form of personal or investment advice.
Any opinions, news, research, analyses, prices, other information, or links to third-party sites contained on this website are provided on an "as-is" basis, are intended only to be informative, is not an advice nor a recommendation, nor research, or a record of our trading prices, or an offer of, or solicitation for a transaction in any financial instrument and thus should not be treated as such. The information provided does not involve any specific investment objectives, financial situation and needs of any specific person who may receive it. Please be aware, that past performance is not a reliable indicator of future performance and/or results. Past Performance or Forward-looking scenarios based upon the reasonable beliefs of the third-party provider are not a guarantee of future performance. Actual results may differ materially from those anticipated in forward-looking or past performance statements. IC Markets makes no representation or warranty and assumes no liability as to the accuracy or completeness of the information provided, nor any loss arising from any investment based on a recommendation, forecast or any information supplied by any third-party.

SILVER HIGHER.What I see on XAGUSD. I have been quite bullish on this and am interested in engaging in a long position around here.
Easiest trade for you guys.

SILVER WILL GROW|LONG|
✅SILVER made a retest of
The horizontal support area
Around 32.75$ while trading
In an uptrend and we are now
Seeing a bullish rebound
Which reinforces our bullish
Biased and we will be expecting
A further bullish move up
LONG🚀
✅Like and subscribe to never miss a new idea!✅
Disclosure: I am part of Trade Nation's Influencer program and receive a monthly fee for using their TradingView charts in my analysis.

Weekly Silver Analysis - Issue 208 (Free)The analyst believes that the price of XAGUSD will decrease within the time specified on the countdown timer. This prediction is based on a quantitative analysis of the price trend.
___Please note that the specified take-profit level does not imply a prediction that the price will reach that point. In this framework of analysis and trading, unlike the stop-loss, which is mandatory, setting a take-profit level is optional. Whether the price reaches the take-profit level or not is of no significance, as the results are calculated based on the start and end times. The take-profit level merely indicates the potential maximum price fluctuation within that time frame.

SILVER: Move Down Expected! Short!
My dear friends,
Today we will analyse GOLD together☺️
The recent price action suggests a shift in mid-term momentum. A break below the current local range around 33.0203 will confirm the new direction downwards with the target being the next key level of 32.8151.and a reconvened placement of a stop-loss beyond the range.
❤️Sending you lots of Love and Hugs❤️

Silver has lost 96% of its value...Over 125 years, silver has lost 96% of its value against the stock market.
However, there are some impressive bull markets along the way where this can reverse.
You can spot this using technical analysis.

#XAGUSD 1HXAGUSD (1H Timeframe) Analysis
Market Structure:
The price is approaching a key resistance zone on the 1-hour timeframe. Previous reactions at this level suggest that sellers have been active, making it an important area to monitor for potential price rejection.
Forecast:
A sell opportunity may be considered if the price gets rejected from the resistance area with bearish confirmation signals. A failure to break above the resistance could lead to downward movement.
Key Levels to Watch:
- Entry Zone: Consider selling near the resistance zone after clear confirmation of rejection.
- Risk Management:
- Stop Loss: Positioned above the resistance area to protect against unexpected breakouts.
- Take Profit: Aim for nearby support levels or previous lows.
Market Sentiment:
As long as the price respects the resistance level and bearish confirmations appear, selling pressure could increase. A clear breakout above resistance would invalidate the current bearish setup.

XAG/USD LONG XAG/USD LONG " break of a resistance area and retest it + 50% fib retracement +50 ema dynamic support "

A new entry point in the ongoing rallyIt's time to go long on silver again.
The trend is upward, and the growth continues. We've seen a pullback after the price reached the 33.50 level — a good opportunity to re-enter. Nothing has changed fundamentally; my view on the metal remains the same. The uptrend is intact, and I believe we're just at the beginning of the move. Higher targets are ahead.
I plan to continue following the trend carefully — exiting positions when risks arise and re-entering if there are confirmations of further growth.
Stop is set at the 32.95 level.

SILVER 4H New Week OutlookSo we had a market structure shift on TVC:SILVER : Order block + Strong Move + Imbalance. I am looking a continuation to the downside, my eyes are on the Sellside Liquidity zone. I will make an entry based on how price reacts to the Balanced Price Range zone (The zone with overlapping Fair Value Gaps). Patience is our best friend now. Happy Trading Week.

Aggressive Buyers and Their Financial Adventures.In our previous idea, despite the fear and stress in the stock market, we predicted that the mighty crab buyers would charge in with full force.
Toward the end of the idea, we anticipated these energetic crabs would get tired around the $31 mark, needing a deep dive and a price drop to catch their breath.
However, their dive wasn’t as deep as expected, and fresh buyers, inspired by the Cypher pattern, jumped into the market at $31.
Now, we expect these crabby buyers to hit their next exhaustion point around $33.2, where they’ll likely need a long and deep rest—because even crabs can’t keep snapping forever!
SEYED.

XAGUSD....Silver may buy till the daily resistance level..price has been very bullish formed a range and broke out to the upside....looking for more bullish signals to buy the metal

Potential bullish rise?XAG/USD is reacting off the support level which is an overlap support and could rise from this level to our take profit.
Entry: 33.02
Why we like it:
There is an overlap support level.
Stop loss: 32.21
Why we like it:
There is a pullback support level that is slightly below the 23.6% Fibonacci retracement.
Take profit: 34.51
Why we like it:
There is a swing high resistance.
Enjoying your TradingView experience? Review us!
Please be advised that the information presented on TradingView is provided to Vantage (‘Vantage Global Limited’, ‘we’) by a third-party provider (‘Everest Fortune Group’). Please be reminded that you are solely responsible for the trading decisions on your account. There is a very high degree of risk involved in trading. Any information and/or content is intended entirely for research, educational and informational purposes only and does not constitute investment or consultation advice or investment strategy. The information is not tailored to the investment needs of any specific person and therefore does not involve a consideration of any of the investment objectives, financial situation or needs of any viewer that may receive it. Kindly also note that past performance is not a reliable indicator of future results. Actual results may differ materially from those anticipated in forward-looking or past performance statements. We assume no liability as to the accuracy or completeness of any of the information and/or content provided herein and the Company cannot be held responsible for any omission, mistake nor for any loss or damage including without limitation to any loss of profit which may arise from reliance on any information supplied by Everest Fortune Group.

SILVER Local Long! Buy!
Hello,Traders!
SILVER is trading in a local
Uptrend and the price made
A retest of the horizontal
Support level around 32.83$
From where we will be
Expecting a rebound and
A move up on Monday
Buy!
Comment and subscribe to help us grow!
Check out other forecasts below too!
Disclosure: I am part of Trade Nation's Influencer program and receive a monthly fee for using their TradingView charts in my analysis.

SILVER: Short Trading Opportunity
SILVER
- Classic bearish formation
- Our team expects fall
SUGGESTED TRADE:
Swing Trade
Sell SILVER
Entry Level - 33.096
Sl - 33.729
Tp - 31.949
Our Risk - 1%
Start protection of your profits from lower levels
Disclosure: I am part of Trade Nation's Influencer program and receive a monthly fee for using their TradingView charts in my analysis.
❤️ Please, support our work with like & comment! ❤️

XAGUSDT I GETTING YOUR GOAL XAGUSDT WILL COLLECT THE MARKET
THINKIG ABOUT FXOPEN:XAGUSD
getting your goal

SILVER My Opinion! BUY!
My dear friends,
Please, find my technical outlook for NATGAS below:
The price is coiling around a solid key level - 33.100
Bias - Bullish
Technical Indicators: Pivot Points Low anticipates a potential price reversal.
Super trend shows a clear buy, giving a perfect indicators' convergence.
Goal - 33.330
About Used Indicators:
The pivot point itself is simply the average of the high, low and closing prices from the previous trading day.
Disclosure: I am part of Trade Nation's Influencer program and receive a monthly fee for using their TradingView charts in my analysis.
———————————
WISH YOU ALL LUCK

SILVER Will Go Up! Long!
Here is our detailed technical review for SILVER.
Time Frame: 9h
Current Trend: Bullish
Sentiment: Oversold (based on 7-period RSI)
Forecast: Bullish
The market is trading around a solid horizontal structure 3,308.7.
The above observations make me that the market will inevitably achieve 3,462.2 level.
P.S
Please, note that an oversold/overbought condition can last for a long time, and therefore being oversold/overbought doesn't mean a price rally will come soon, or at all.
Disclosure: I am part of Trade Nation's Influencer program and receive a monthly fee for using their TradingView charts in my analysis.
Like and subscribe and comment my ideas if you enjoy them!
