XAG/USD elliot wave countFXOPEN:XAGUSD
📊 Silver – Elliott Wave Analysis (Overview)
🔹 Macro Structure:
We’ve already completed the larger Wave 3 and are now transitioning into Wave 4.
🔹 Corrective Structure – Wave 4:
The A wave of the correction is already completed.
The B wave has also been completed.
We are now in the process of building the C wave, which will complete Wave 4.
🔹 Internal Structure of Wave C:
From the end of Wave B, we’ve already formed a (1) and (2) (in brackets).
Within this move, another smaller (1) and (2) have now unfolded, and we are currently on the way to the (3) of C.
🔹 Market Context:
Target zones and entry zones are already marked on the chart.
These zones can still be adjusted, depending on how price action develops in the coming days.
SILVER trade ideas

Silver Holds Near $36.80 on Tariff FearsSilver remains steady just below $37.00, hovering around $36.80 in Tuesday’s Asian session after a sharp rebound from the $36.15 level seen late Monday. The metal continues to trade in a tight range as conflicting market signals keep traders cautious.
Global trade tensions and geopolitical uncertainties, fueled by the U.S.’s upcoming tariffs on multiple countries and its hardline stance against BRICS-aligned nations, have elevated market risk perception. This has sparked a modest uptick in safe-haven demand, offering limited support to silver.
The strength of the U.S. Dollar and uncertainty surrounding future interest rate decisions are capping silver’s upside potential. Market participants remain focused on incoming economic data and central bank signals for clearer direction.
In the near term, silver is expected to stay volatile and highly reactive to geopolitical and economic headlines.
Resistance is at 37.50, while support holds at 35.40.
Silver Rectangle Price Target $40Silver H & S continuation target met.
Trend has resumed in an up channel with a rectangle price target of 40.6.

Silver (XAGUSD) Structural Analysis : Curve break & TargetSilver is exhibiting a textbook bullish continuation pattern, guided by a parabolic curve structure that reflects intensifying buyer momentum. This unique setup provides a high-probability trading roadmap as we approach a major reversal zone—one where smart money may look to offload long positions or enter fresh shorts.
This analysis aims to help traders anticipate the likely path of XAGUSD based on structure, liquidity behavior, and trend psychology.
🔍 Key Structural Observations:
1. Black Mind Curve Support (Dynamic Bullish Structure)
This parabolic arc acts as dynamic support. Every bounce from the curve shows growing strength in buyer conviction.
The price is riding the curve upward with higher lows, signaling accumulation with momentum.
This is not a standard trendline but rather a curve reflecting the accelerated nature of this uptrend.
2. Aggressive Bullish Momentum
The recent price behavior has shown strong impulsive candles to the upside followed by shallow corrections, confirming bullish dominance.
Volume and candle size increase near the curve, suggesting institutional interest.
3. Reversal Zone: 37.20 – 37.45
Marked as the Next Reversal Zone, this green box represents a key supply area where previous swing highs exist.
Historically, price struggled to break this region cleanly, making it a high-probability reaction zone.
Expect either:
a bearish rejection (short-term correction), or
a consolidation before a breakout continuation.
4. Liquidity Pool & Needed Volume Zone (~35.20 – 35.50)
The market often revisits zones of untapped liquidity. This area likely holds:
Buy-side stop losses
Unfilled institutional orders
If the market needs a deeper retracement, this is the zone to watch for re-accumulation.
🧠 Market Psychology Behind This Setup:
This structure suggests a classic case of smart money accumulation, with price moving upward in a controlled yet aggressive fashion. The parabolic nature of the move points to:
Increasing retail buy-ins
FOMO-driven entries
Possible engineered sweep before the next impulse
The reversal zone could become a profit-taking area for institutions. If large players want to continue higher, they may first induce a pullback to absorb more volume at lower prices (near the curve or liquidity zone).
🔧 Tactical Playbook for Traders:
For Bulls (Long Bias):
Watch for pullbacks toward the curve or liquidity zone.
Enter long positions on bullish confirmation (e.g., engulfing candles, pin bars) off those zones.
Targets: 37.20 – 37.45, possibly higher if broken with strength.
For Bears (Countertrend Traders):
Wait for clear rejection patterns in the reversal zone.
Use confirmation like RSI divergence, momentum slowdown, or distribution volume.
Target: Curve support or deeper liquidity zone for reentry.
📌 Key Technical Levels:
Zone Price Range Description
Reversal Zone 37.20 – 37.45 Resistance / Take-Profit Area
Curve Support Dynamic (rising) Support based on parabolic arc
Liquidity Pool 35.20 – 35.50 High-volume demand zone
🧭 Conclusion
Silver is currently in a momentum-driven phase supported by smart money activity. The parabolic structure and clean liquidity map give traders a clear plan to engage both long and short setups with timing and precision. Patience around the reversal zone will be key, as the next major move may depend on how price behaves in this critical area.

SILVER SENDS CLEAR BEARISH SIGNALS|SHORT
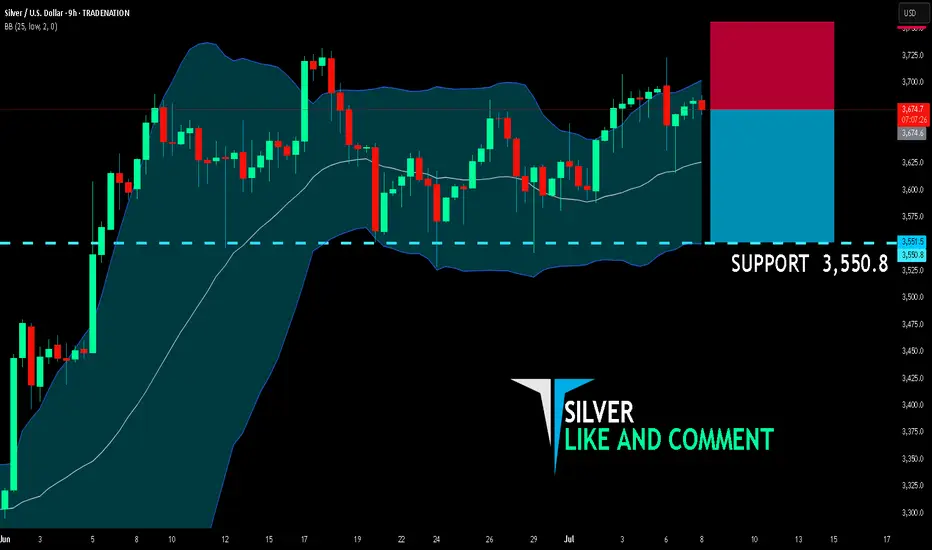
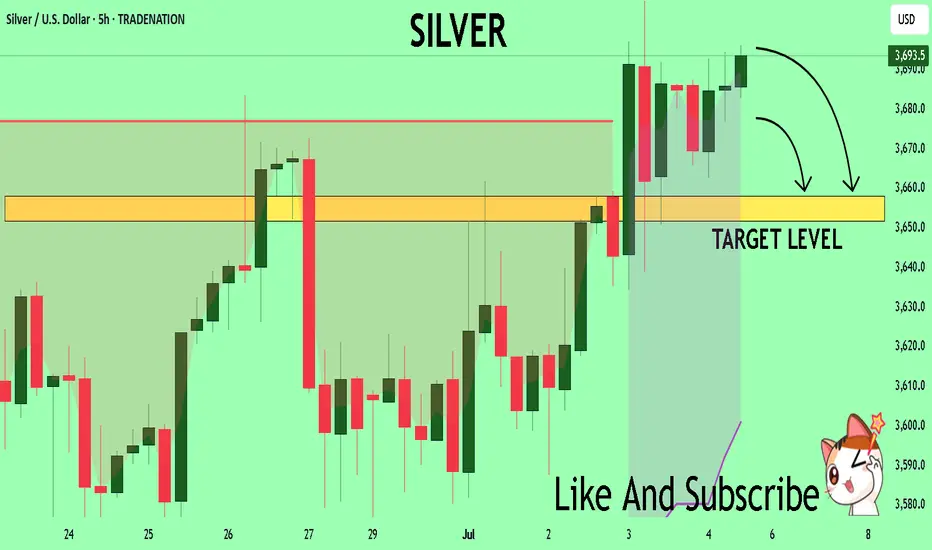
SILVER SIGNAL
Trade Direction: short
Entry Level: 3,674.6
Target Level: 3,550.8
Stop Loss: 3,756.2
RISK PROFILE
Risk level: medium
Suggested risk: 1%
Timeframe: 9h
Disclosure: I am part of Trade Nation's Influencer program and receive a monthly fee for using their TradingView charts in my analysis.
✅LIKE AND COMMENT MY IDEAS✅
A SUPER XAGUSD BUYYesterday XAGUSD reached its demand bottom, and now it is rising to the supply ceiling,
In the meantime I found an order block in the 1 min time frame, and immediately I placed a Buy order, and I will travel with it until the price reaches the supply ceiling with 1.2 win rate.

#1 Breaking News: Silver The Bullet Price Am listening to a podcast online this podcast mainly focusses on :
1-Gold
2-Silver
3-Mining Stocks
I always wondered what is it about these sectors that makes them "special"
Well I have recently mastered how to trade the double or triple tops.
And I can see why the experts in this commodity industry love double tops and triple tops.
Silver is hitting a top and has bounced from the neckline.
This is very important for you to understand.Also am using the 🚀 Rocket Booster strategy.
This strategy helps me pick the strength of the price trending.
It can also be used as a stop loss.This means you can use the moving averages for risk management.
Now I dont want you to worry too much about the technicals in this article but I just want us to have a conversation.
Sometimes technical analysis ca be boring but you will learn from conversations such as podcasts as well.
Rocket Boost This Content To Learn More.
Disclaimer ⚠️ Trading is risky please learn more about risk management and profit taking strategies and feel free to use a simulation trading account before you use real money.
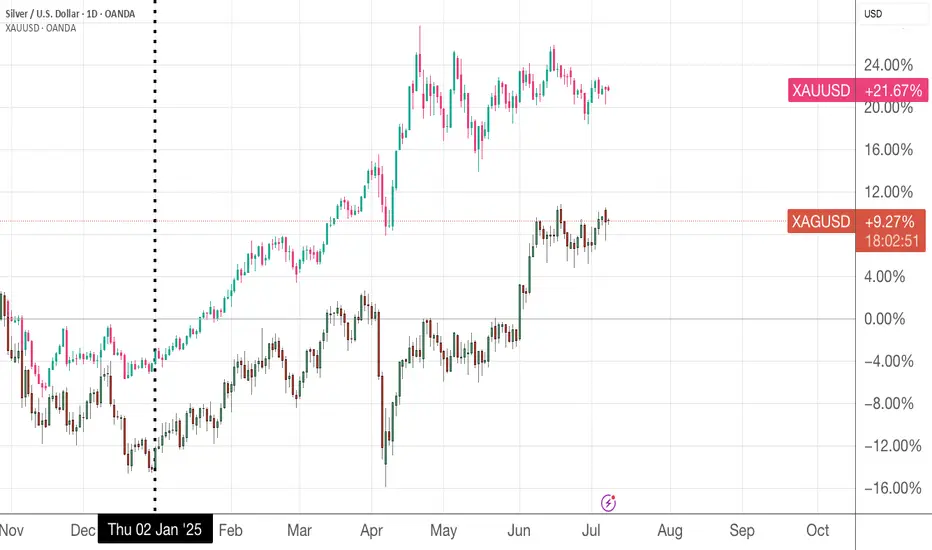
Silver is playing catch upI just nibble some silver on XAGUSD yesterday and believe it will closer the gap nearer with XAUUSD
Short term pullback is overFrom my last analysis on silver, we had a sell on silver, but it happened that the short term sell was liquidity the market used to buy dip.
Looking at the red rectangle we can see that silver has finished accumulating at that zone and is heading north ⬆️,so we are bullish going forward.
Target profit:38.00 , 39.00

SILVER: Will Go Up! Long!
My dear friends,
Today we will analyse SILVER together☺️
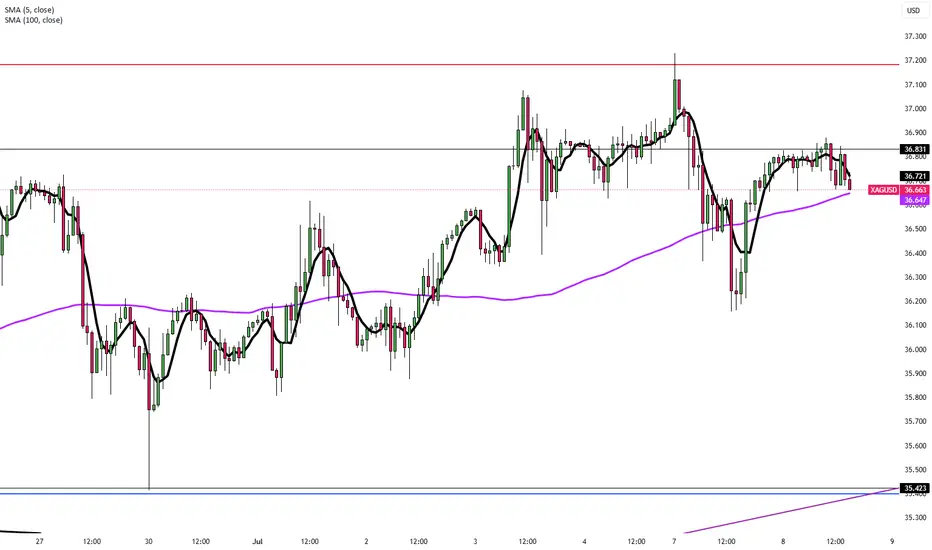
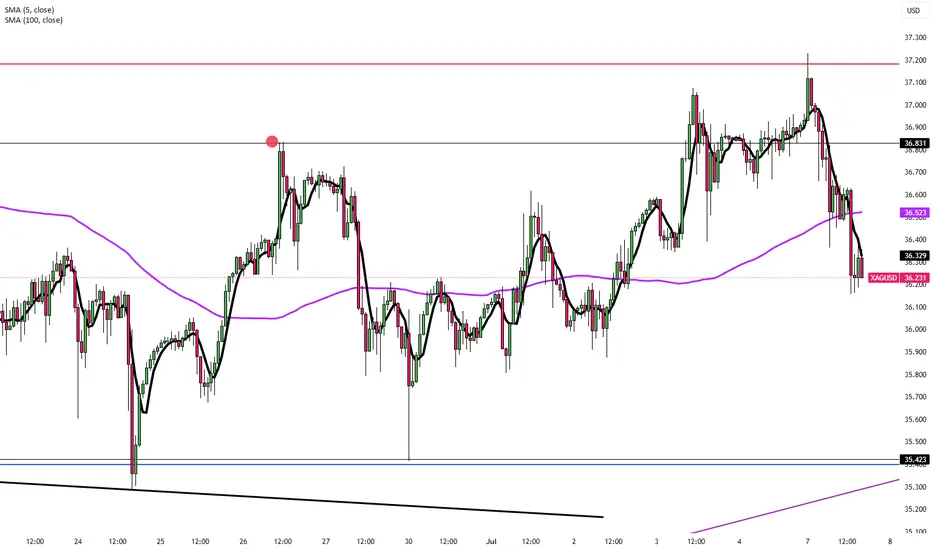
The in-trend continuation seems likely as the current long-term trend appears to be strong, and price is holding above a key level of 36.696 So a bullish continuation seems plausible, targeting the next high. We should enter on confirmation, and place a stop-loss beyond the recent swing level.
❤️Sending you lots of Love and Hugs❤️

Silver Holds Near 13-Year High Amid Tariff UncertaintySilver held above $36.80 Friday, near 13-year highs, as renewed trade tensions supported safe-haven demand. Markets grew cautious after Trump announced plans to send tariff letters, and as the House passed his tax and spending bill, expected to widen the deficit by over $3 trillion. Silver’s gains were capped by a surprisingly stronger June US jobs report, which eased recession fears and reduced near-term Fed rate cut pressure.
Resistance is at 37.50, while support holds at 35.40.
Silver sideways consolidation support at 3500The Silver price action continues to exhibit a bullish sentiment, underpinned by a prevailing rising trend. However, recent intraday moves indicate a corrective pullback, reflecting short-term consolidation within the broader uptrend.
Key Technical Levels:
Support:
3,500 – Primary support and previous consolidation zone; critical for maintaining bullish structure.
3,450 – Secondary support; potential downside target if 3,500 fails.
3,390 – Key lower support; aligns with a broader demand area.
Resistance:
3,720 – Immediate upside resistance; first target on a bullish bounce.
3,790 – Intermediate resistance; aligns with recent swing highs.
3,850 – Long-term resistance target; marks the upper boundary of the current bullish channel.
Scenario Analysis:
Bullish Continuation (Base Case):
A bounce from the 3,500 level would affirm the corrective pullback as temporary, with potential for a bullish continuation targeting 3,720, followed by 3,790 and 3,850 over a longer timeframe.
Bearish Reversal (Alternative Scenario):
A daily close below 3,500 would undermine the current bullish outlook and signal a deeper retracement, with downside risk toward 3,450 and potentially 3,390, where structural support may stabilize price.
Conclusion:
Silver remains structurally bullish, with the current pullback offering a potential entry point within the trend. The 3,500 level is the key pivot—holding above it supports further upside continuation, while a breakdown below would raise the risk of a deeper correction. Traders should watch for price action confirmation at this level to validate the next directional move.
This communication is for informational purposes only and should not be viewed as any form of recommendation as to a particular course of action or as investment advice. It is not intended as an offer or solicitation for the purchase or sale of any financial instrument or as an official confirmation of any transaction. Opinions, estimates and assumptions expressed herein are made as of the date of this communication and are subject to change without notice. This communication has been prepared based upon information, including market prices, data and other information, believed to be reliable; however, Trade Nation does not warrant its completeness or accuracy. All market prices and market data contained in or attached to this communication are indicative and subject to change without notice.

Cheap jewellery (Silver XAG/USD)Setup
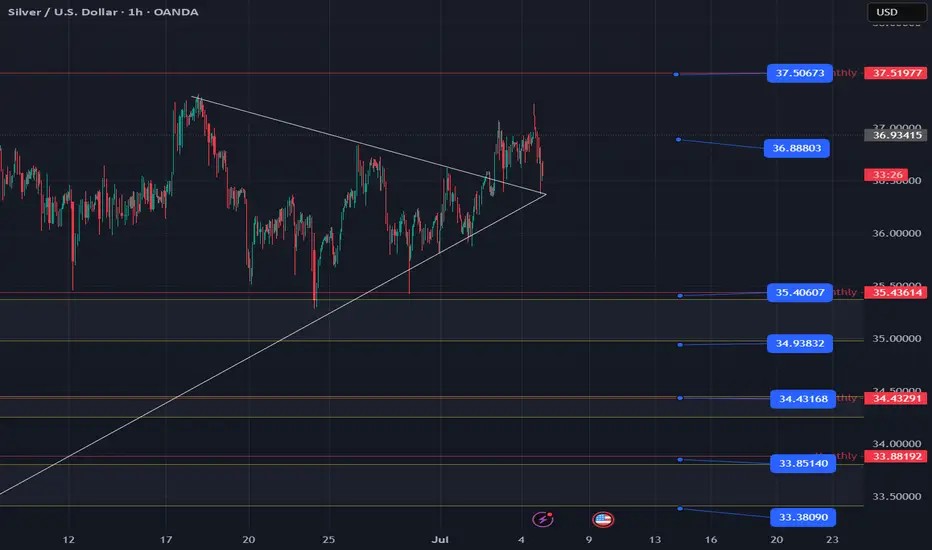
Silver is sitting just under multi-decade highs having broken above $34 resistance last month. The long term cup and handle pattern is still in place.
Signal
The price has been consolidating in what could be a bull flag pattern between 35 and 37. A breakout could trigger the next leg of the uptrend, whereas a drop below the bottom of the flag would imply a retest of 34.

SILVER Will Go Lower From Resistance! Short!
Here is our detailed technical review for SILVER.
Time Frame: 12h
Current Trend: Bearish
Sentiment: Overbought (based on 7-period RSI)
Forecast: Bearish
The market is approaching a significant resistance area 3,654.7.
Due to the fact that we see a positive bearish reaction from the underlined area, I strongly believe that sellers will manage to push the price all the way down to 3,536.0 level.
P.S
Please, note that an oversold/overbought condition can last for a long time, and therefore being oversold/overbought doesn't mean a price rally will come soon, or at all.
Disclosure: I am part of Trade Nation's Influencer program and receive a monthly fee for using their TradingView charts in my analysis.
Like and subscribe and comment my ideas if you enjoy them!

Long XAGUSDXAGUSD has been holding the breakout of this wedge as well as the 8MA and 21MA. I like longs here using a break/hold below the 21MA as a stop. I would target 37, 37.5 initially and if we can see a break/hold of 37.5 I would target 39, 40.
Final Stretch for SilverSilver OANDA:XAGUSD COMEX:SI1! AMEX:SLV continues to follow the plan
At this stage, price has either:
already completed wave ④ and is now entering wave ⑤,
or wave ④ is still in progress, currently in its final stages.
In either case, the wave structure suggests a final impulsive move upward into the $38–40 range — the climactic fifth wave of the sequence.
Volume Profile Analysis:
Price is currently trading between σ1 and σ2, with room to expand toward σ3 (~$40) if momentum continues.
The accumulation phase is behind us — we are now in the distribution zone.
Price action also supports the bullish outlook:
Last month closed with a strong bullish candle, showing no signs of reversal.
Keeping an eye on the move — the $38–40 zone remains the key target for the completion of this impulse.
#Silver #XAGUSD #ElliottWave #VolumeProfile #PriceAction #WaveAnalysis

SILVER: Short Signal with Entry/SL/TP
SILVER
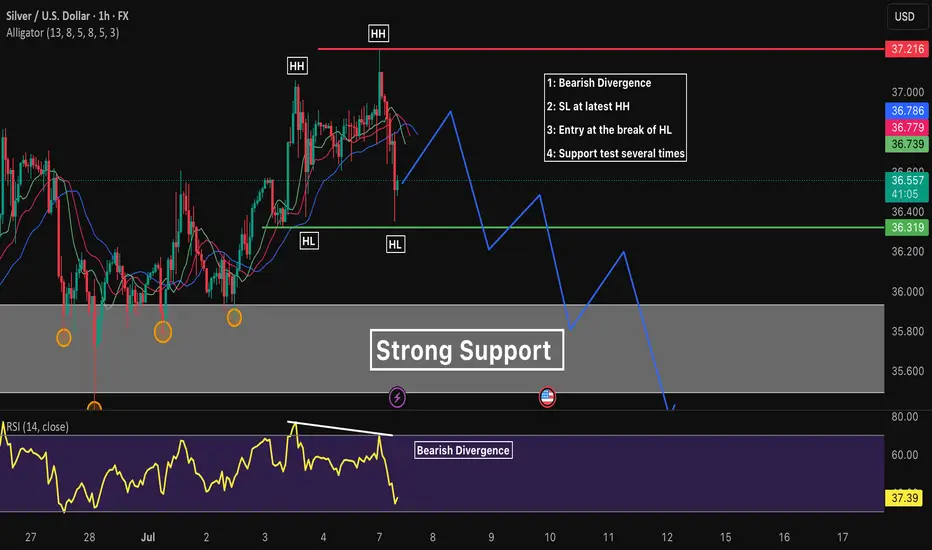
- Classic bearish setup
- Our team expects bearish continuation
SUGGESTED TRADE:
Swing Trade
Short SILVER
Entry Point - 36.935
Stop Loss - 37.204
Take Profit - 36.369
Our Risk - 1%
Start protection of your profits from lower levels
Disclosure: I am part of Trade Nation's Influencer program and receive a monthly fee for using their TradingView charts in my analysis.
❤️ Please, support our work with like & comment! ❤️

XAG/USD Daily AnalysisPrice is moving within a bullish channel, which is itself situated inside a bigger bullish structure.
The most recent price action appears to be a consolidation within the uptrend.
Price may possibly be setting up for another impulsive move towards the top of structure for a 3rd test.
If you agree with this analysis, look for a trade that meets your strategy rules.

SILVER RESISTANCE AHEAD|SHORT|
✅SILVER has been growing recently
And the pair seems locally overbought
So as the pair is approaching a
Horizontal resistance of 3730$
Price decline is to be expected
SHORT🔥
✅Like and subscribe to never miss a new idea!✅
Disclosure: I am part of Trade Nation's Influencer program and receive a monthly fee for using their TradingView charts in my analysis.

SILVER Technical Analysis! SELL!
My dear followers,
I analysed this chart on SILVER and concluded the following:
The market is trading on 36.935 pivot level.
Bias - Bearish
Technical Indicators: Both Super Trend & Pivot HL indicate a highly probable Bearish continuation.
Target - 36.582
About Used Indicators:
A super-trend indicator is plotted on either above or below the closing price to signal a buy or sell. The indicator changes color, based on whether or not you should be buying. If the super-trend indicator moves below the closing price, the indicator turns green, and it signals an entry point or points to buy.
Disclosure: I am part of Trade Nation's Influencer program and receive a monthly fee for using their TradingView charts in my analysis.
———————————
WISH YOU ALL LUCK
SILVERSilver lake and Palmer AK mag pouch and I can do the best you could get me some time and Palmer ma to Worcester county jail roster for a few minutes then we will head to bed early and I will head to bed now so we will be home tomorrow and Palmer AK pistol grip stock market open on

SLIVER Weekly patternJust another view from the weekly chart. To give confirmation of the daily bias
