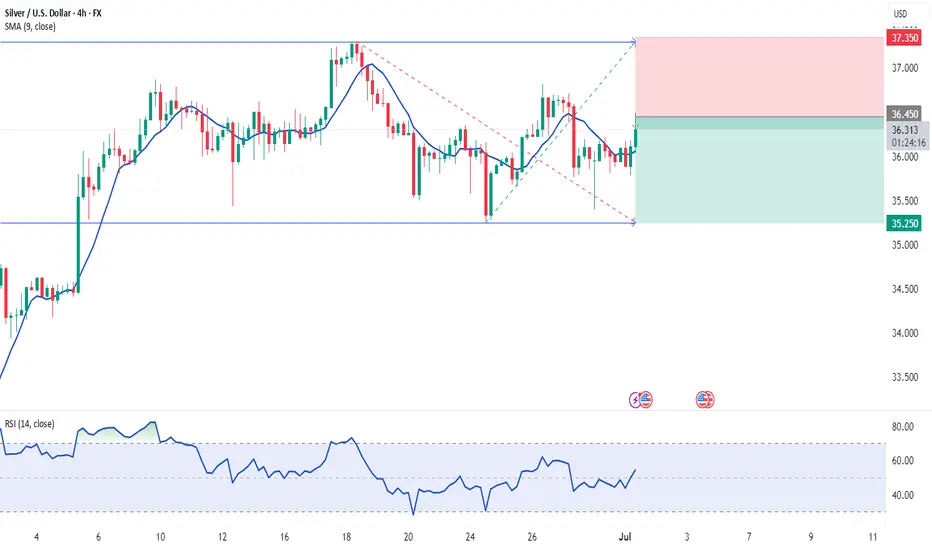
XAGUSD Strong accumulation waiting for a break-out. Silver (XAGUSD) has been trading within a 3-month Channel Up pattern and since the June 18 Higher High, it has entered a Descending Triangle.
This has previous been an Accumulation pattern, which after broken to the upside, it led to June's High. Similarly, we expect a bullish break-out once the 4H RSI breaks above its MA, and as long as the 4H MA200 (orange trend-line) holds, we expect a +15.50% minimum rise (like the first Bullish Leg of the Channel Up), with our Target se at 40.500.
-------------------------------------------------------------------------------
** Please LIKE 👍, FOLLOW ✅, SHARE 🙌 and COMMENT ✍ if you enjoy this idea! Also share your ideas and charts in the comments section below! This is best way to keep it relevant, support us, keep the content here free and allow the idea to reach as many people as possible. **
-------------------------------------------------------------------------------
💸💸💸💸💸💸
👇 👇 👇 👇 👇 👇
SILVERCFD trade ideas

XAGUSDSpeculators remain net long on silver (bullish overall).
But the long positions decreased this week, showing some profit-taking or caution.
Silver Bias: Still bullish, but momentum is weakening.

Silver Dip Offers a Long OpportunityThis is a good opportunity to go long on silver.
Nothing has changed fundamentally — I still expect the asset to move higher.
The recent drop following the economic data release is giving me a chance to add to my silver position.

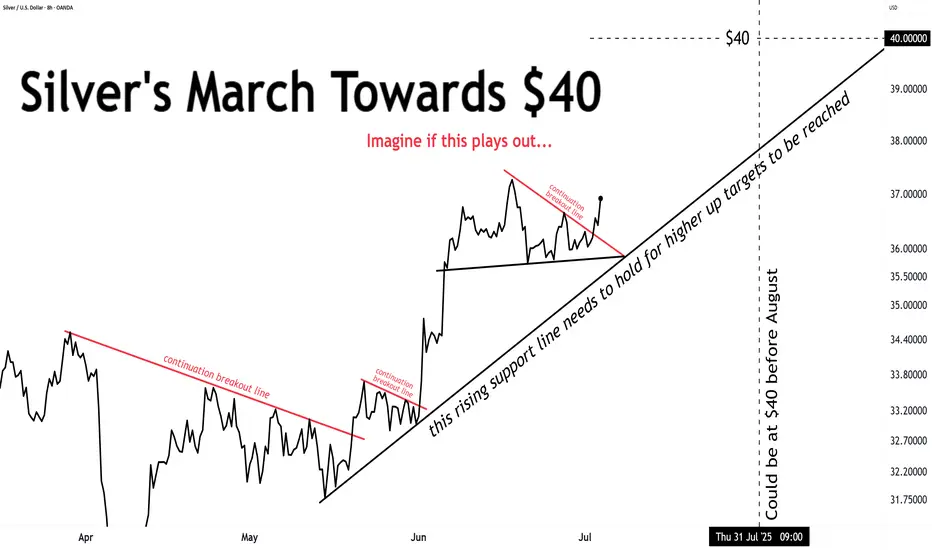
And silver's ride to $40 continues ...this rising support line needs to hold for higher up targets to be reached
SILVER: Local Bearish Bias! Short!
My dear friends,
Today we will analyse SILVER together☺️
The in-trend continuation seems likely as the current long-term trend appears to be strong, and price is holding below a key level of 36.897 So a bearish continuation seems plausible, targeting the next low. We should enter on confirmation, and place a stop-loss beyond the recent swing level.
❤️Sending you lots of Love and Hugs❤️

Nasdaq, BTCUSD, ETHUSD, EURUSD & XAGUSD Daily Trade SetupsIn this update we review the recent price action in the Nasdaq, Bitcoin, Ethereum, Euro & Silver and identify the next high probability trade setups and price objectives to target. To review today's video analysis click here!

SHORT ON SILVER XAG/USDSilver has built lots of sell side liquidity since June 10 and should now be ready to sweep it.
I will be selling silver to the next demand level.

Silver eyeing 37. zone Silver popped through 36.40—if buyers keep that level intact on the retest, I’m looking for a run toward the 37.00 supply zone.

Silver Extends Gains to $36.70Silver hovered near $36.70 on Thursday after rising 1.4% in the previous session, supported by easing trade tensions and stronger expectations of Fed rate cuts.
Markets are now watching key US economic releases to see whether silver can sustain its upward momentum.
Resistance is at 37.50, while support holds at 35.40.

Short outlook on SilverLooking forward for the market to clear the liquidity on BSL , then sell " INTRADAY '
Silver Wave Analysis – 2 July 2025- Silver reversed from support level 35.50
- Likely to rise to resistance level 37.30
Silver recently reversed up with the daily Hammer from the support level 35.50 (which stopped the previous waves (iv) and 4, as can be seen from the daily Silver chart below).
The support level 35.50 was strengthened by the 38.2% Fibonacci correction of the upward impulse from May and the support trendline from April.
Given the clear daily uptrend, Silver can be expected to rise further to the next resistance level 36.80 – the breakout of which can lead to further gains toward 37.30.

SILVER: Will Go Up! Long!
My dear friends,
Today we will analyse SILVER together☺️
The price is near a wide key level
and the pair is approaching a significant decision level of 36.440 Therefore, a strong bullish reaction here could determine the next move up.We will watch for a confirmation candle, and then target the next key level of 36.607.Recommend Stop-loss is beyond the current level.
❤️Sending you lots of Love and Hugs❤️

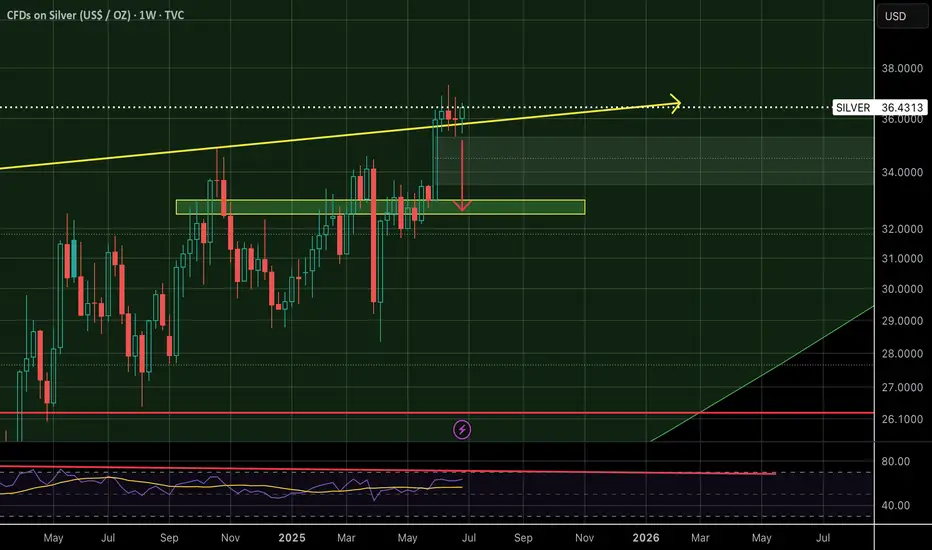
Bull flag forming on silver at 14-year highsSilver has broken above a resistance level that goes all the way back to the fall of 2011. Its been forming this bull flag above, looking super bullish. I'm still waiting for it to come down into the top of the previous level of resistance and test it as support, which would be between $34.50 and $35. After testing as support, look for silver to go on to challenge the all-time highs. There is no guarantee that silver will come down into the support level.

Rotation from over valued equities in silver about to happen...I hear many people are selling their silver, thinking $36 is a high. But this is still the stealth accumulation phase. We will see a rotation of trillions into silver, that has a market cap of a few hundred billion, including miners.
In my book, "Silver is Money" we see stocks, bonds and government debt has kept a lid on inflation.
This coming rotation will bring about the biggest monetary change seen in generations.

Possible buy scenario for XAGUSD Price is bullish
On the H1 timeframe sellers pushed price lower to a H1 Demand price is currently reacting on the Demand zone if we get a BOS to the upside we're in for a buy.
Possible buy scenario
My idea 💡 DYOR

SILVER DAILY TIMEFRAME ANALYSISOn the daily timeframe, silver is currently exhibiting consolidation behavior, indicating indecision in the market.
However, a closer look at the recent price action — highlighted by the green circle — suggests a potential shift in market structure. Price appears to be testing the previous support level, and a confirmed break below this zone could signal a change in trend direction.
If this support level fails to hold, it would confirm a bearish shift, and I will be looking for short opportunities in the near term.
1. Current Trend: Sideways/Consolidation
The chart shows that XAGUSD (Silver) is currently in a consolidation phase after a strong bullish move earlier in May.
Price is ranging between approximately $36.80 and $35.50, forming lower highs and higher lows, indicating indecision or accumulation/distribution
2. Price Structure:
After the strong bullish impulse around mid-May, price has rejected multiple times around the $36.80 zone, showing strong resistance.
The current candles are showing lower closes, and the last candle is bearish, indicating weak bullish momentum and a potential shift to the downside.
There is a minor support zone around $35.85 – $35.80, which price is testing now.
3. Key Levels:
Type Price Area
Resistance 36.78 – 36.80
Resistance 36.45
Current Price 35.98
Support 35.85 – 35.80
Major Support 35.15 – 35.00
Conclusion:
The market is undecided right now but leaning bearish if support breaks.
Wait for a clear breakout of 35.80 for sell continuation.
Alternatively, look for bullish rejection around 35.80 to scalp back to 36.40–36.80 range.
Be patient and manage risk carefully in this range-bound condition.

XAGUSD H1 I Bearish Reversal Based on the H1 chart analysis, we can see that the price is rising toward our sell entry at 36.24, an overlap resistance close to the 50% Fib retracement.
Our take profit will be at 35.89, an overlap support.
The stop loss will be placed at 36.57, which is a swing-high resistance.
High Risk Investment Warning
Trading Forex/CFDs on margin carries a high level of risk and may not be suitable for all investors. Leverage can work against you.
Stratos Markets Limited (tradu.com ):
CFDs are complex instruments and come with a high risk of losing money rapidly due to leverage. 63% of retail investor accounts lose money when trading CFDs with this provider. You should consider whether you understand how CFDs work and whether you can afford to take the high risk of losing your money.
Stratos Europe Ltd (tradu.com ):
CFDs are complex instruments and come with a high risk of losing money rapidly due to leverage. 63% of retail investor accounts lose money when trading CFDs with this provider. You should consider whether you understand how CFDs work and whether you can afford to take the high risk of losing your money.
Stratos Global LLC (tradu.com ):
Losses can exceed deposits.
Please be advised that the information presented on TradingView is provided to Tradu (‘Company’, ‘we’) by a third-party provider (‘TFA Global Pte Ltd’). Please be reminded that you are solely responsible for the trading decisions on your account. There is a very high degree of risk involved in trading. Any information and/or content is intended entirely for research, educational and informational purposes only and does not constitute investment or consultation advice or investment strategy. The information is not tailored to the investment needs of any specific person and therefore does not involve a consideration of any of the investment objectives, financial situation or needs of any viewer that may receive it. Kindly also note that past performance is not a reliable indicator of future results. Actual results may differ materially from those anticipated in forward-looking or past performance statements. We assume no liability as to the accuracy or completeness of any of the information and/or content provided herein and the Company cannot be held responsible for any omission, mistake nor for any loss or damage including without limitation to any loss of profit which may arise from reliance on any information supplied by TFA Global Pte Ltd.
The speaker(s) is neither an employee, agent nor representative of Tradu and is therefore acting independently. The opinions given are their own, constitute general market commentary, and do not constitute the opinion or advice of Tradu or any form of personal or investment advice. Tradu neither endorses nor guarantees offerings of third-party speakers, nor is Tradu responsible for the content, veracity or opinions of third-party speakers, presenters or participants.

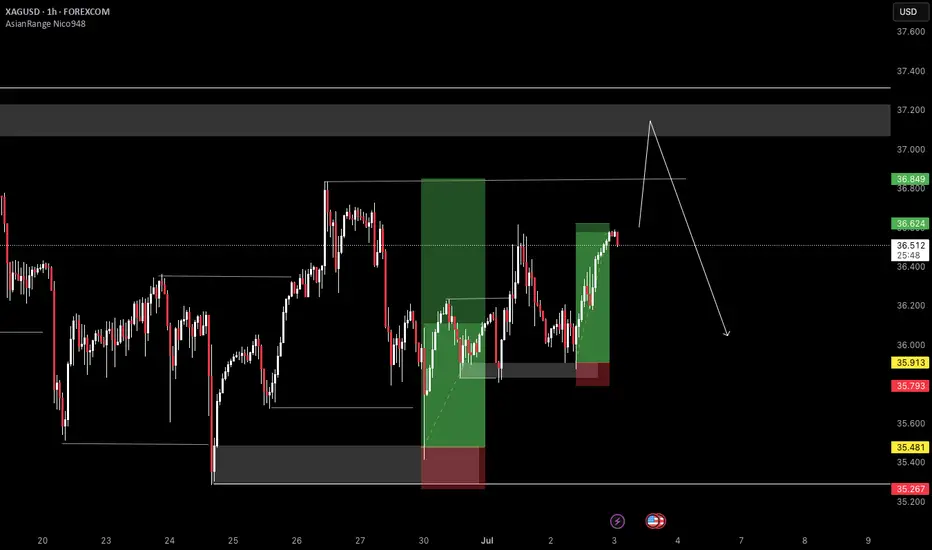
SILVER (XAGUSD): Pullback From SupportIt seems that the time has come for 📈SILVER to experience a pullback.
This morning, I've observed a solid intraday bullish signal with the emergence of a head and shoulders pattern on the 4-hour chart.
I anticipate a pullback to at least 36.61, followed by a move to 36.95.

SILVER: Move Down Expected! Short!
My dear friends,
Today we will analyse SILVER together☺️
The in-trend continuation seems likely as the current long-term trend appears to be strong, and price is holding below a key level of 36.310 So a bearish continuation seems plausible, targeting the next low. We should enter on confirmation, and place a stop-loss beyond the recent swing level.
❤️Sending you lots of Love and Hugs❤️

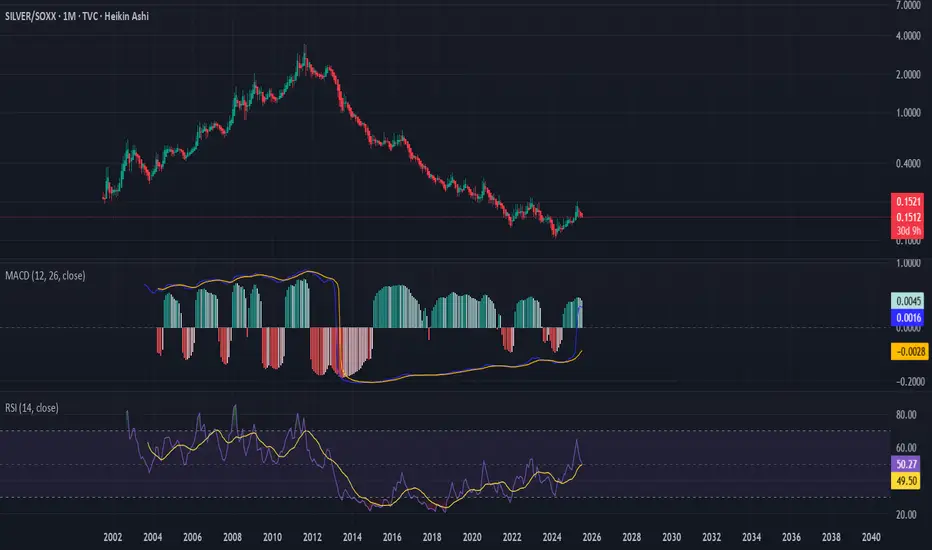
Rotation into Silver form Semi-conductors!A 12 year in the making opportunity to get into the rotation from semi-conductors!
We have seen a blow off top and dead cat bounce in NVIDIA and IBM?
Is it time to jump abord the silver train?
Silver (XAG/USD) on the 1-hour timeframe.Silver (XAG/USD) on the 1-hour timeframe, the chart shows a bullish breakout from a symmetrical triangle pattern. Here's the target breakdown:
📈 Silver Bullish Targets:
Current Price: Around 36.42
1st Target (TP1): Approximately 36.95 – 37.00
2nd Target (TP2): Approximately 37.40 – 37.50
These targets are based on the breakout from the triangle and previous resistance zones marked on your chart.
🛑 Suggested Support Zone (Breakout Retest Area):
Around 36.00 – 36.20 (acts as support now after the breakout)
If price holds above this zone, the bullish structure remains valid. Let me know if you'd like stop loss suggestions or lower timeframe analysis.
