SILVER: Will Go Down! Short!
My dear friends,
Today we will analyse SILVER together☺️
The price is near a wide key level
and the pair is approaching a significant decision level of 39.520 Therefore, a strong bearish reaction here could determine the next move down.We will watch for a confirmation candle, and then target the next key level of 39.416..Recommend Stop-loss is beyond the current level.
❤️Sending you lots of Love and Hugs❤️
SILVERCFD trade ideas

XAG USD SHORT RESULT Silver price was in a broadening falling wedge which is a bullish pattern, but still took a quick short scalp trade from the set supply zone to the next Order Block and it moved just as Predicted
_THE_KLASSIC_TRADER_.


XAGUSDCOT data shows a bullish shift in sentiment for silver (XAG/USD), with managed money increasing net long positions for the third consecutive week. This rising speculative interest signals growing confidence in silver's upside potential. Combined with a weakening USD and supportive macro trends, silver is well-positioned to break above the $30 resistance zone. Continued accumulation by institutional traders suggests momentum could carry XAG/USD toward the $33–$35 area in the coming weeks.

Silver Trades Above $38.3 Amid Safe-Haven Demand and Industrial NYSE:TVC : SILVER Silver is trading above $38.3, supported by safe-haven flows and resilience in industrial demand. The metal outpaces gold on the back of stronger relative momentum and inflation expectations.

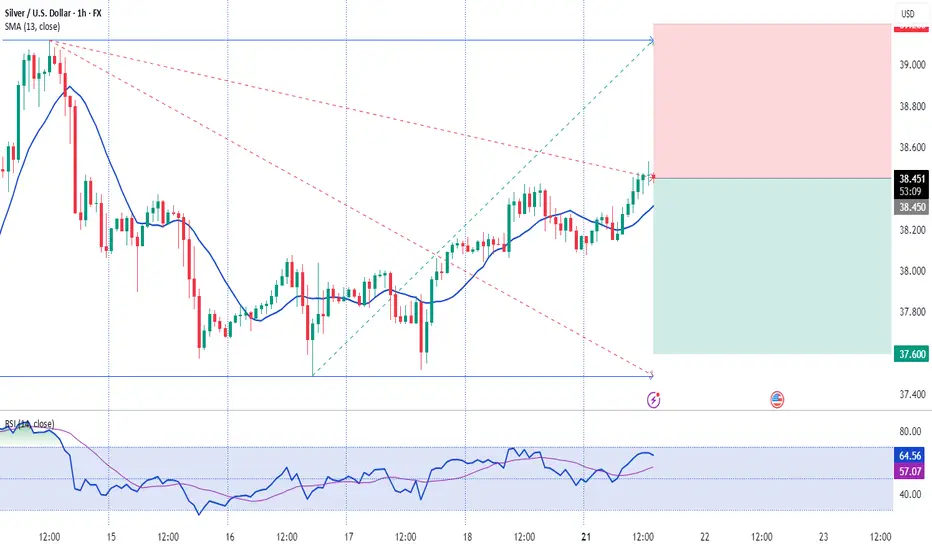
Silver Holds Near $38.40 with Bullish MomentumAs of July 21, 2025, silver (XAG/USD) trades between $38.20 and $38.40, maintaining its upward trend. Key resistance is at $38.50; a break above could lead to $39.10–$40.00. Strong support is at $37.00 and $36.80. The RSI is nearing overbought, suggesting a possible short-term correction.
Upcoming U.S. CPI and PPI data may raise Fed rate cut expectations, supporting silver. Geopolitical risks and U.S. trade policies are supporting safe-haven demand, while strong industrial use in renewable energy and electronics also supports prices. The medium-term outlook remains positive.
Silver faces resistance at 38.50, with higher levels at 39.50 and 40.10. Support is found at 37.20, followed by 36.85 and 35.50.
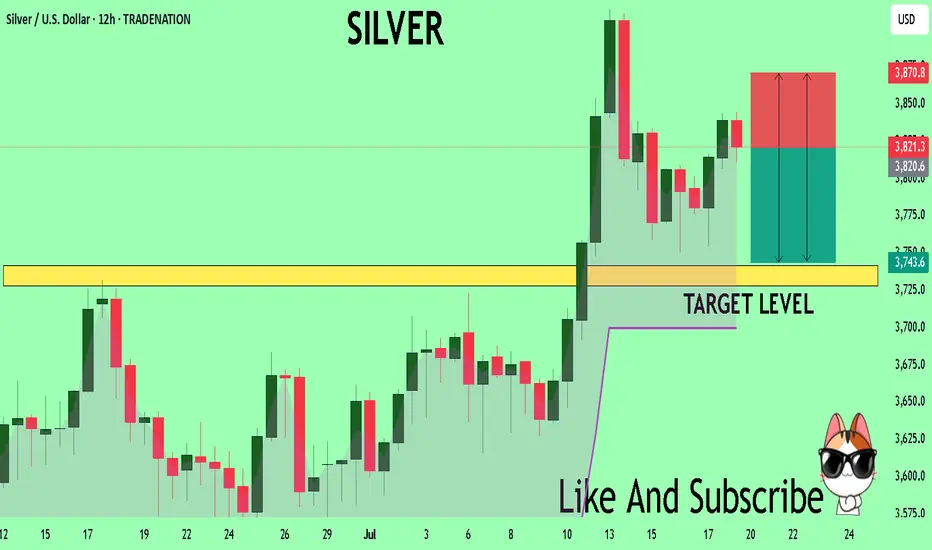
SILVER SELLERS WILL DOMINATE THE MARKET|SHORT
SILVER SIGNAL
Trade Direction: short
Entry Level: 3,612.8
Target Level: 3,572.6
Stop Loss: 3,639.3
RISK PROFILE
Risk level: medium
Suggested risk: 1%
Timeframe: 2h
Disclosure: I am part of Trade Nation's Influencer program and receive a monthly fee for using their TradingView charts in my analysis.
✅LIKE AND COMMENT MY IDEAS✅

XAGUSD in Uptrend ContinuationBuy Limit
Entry Price 38.10
Stop Loss 37.86
Risk 1%
Lot Size 0.21
TP (1RR) 38.34
TP (4RR) 39.06

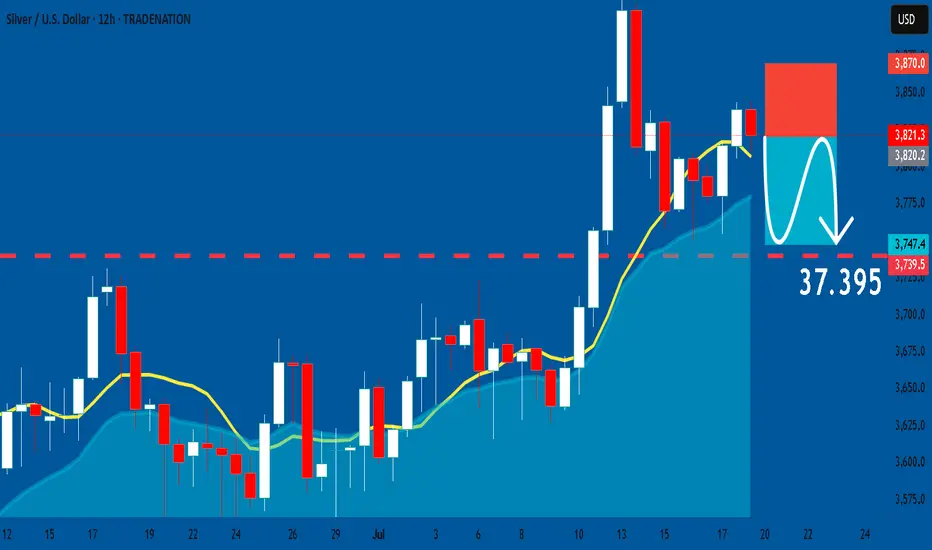
SILVER: Short Trade with Entry/SL/TP
SILVER
- Classic bearish setup
- Our team expects bearish continuation
SUGGESTED TRADE:
Swing Trade
Short SILVER
Entry Point - 38.213
Stop Loss - 38.700
Take Profit - 37.395
Our Risk - 1%
Start protection of your profits from lower levels
Disclosure: I am part of Trade Nation's Influencer program and receive a monthly fee for using their TradingView charts in my analysis.
❤️ Please, support our work with like & comment! ❤️
Bullish Daily Chore Strategy Entry on SilverFirst time I've spoken about this strategy here (as I don't personally trade it myself), but the "Daily Chore" is a very popular one amongst the traders I work with.
Essentially what we're looking for is for price action to be on the correct side of our 3 EMA's (8, 20 & 50), and for those EMA's to be running in the correct order.
If so, we are then looking for a pullback into the EMA's and for a pin bar rejection candles to give us a sign for entry.
This is a very difficult strategy to figure out as it requires a lot of testing and tweaks to optimize, but it also allows for a lot for freedom as it only requires a few minutes a day to check up on.
Please leave any questions or comments below and make sure to give me a follow so you don't miss my next shared trading idea.
Akil

SILVER Massive Short! SELL!
My dear subscribers,
SILVER looks like it will make a good move, and here are the details:
The market is trading on 38.213 pivot level.
Bias - Bearish
My Stop Loss - 38.708
Technical Indicators: Both Super Trend & Pivot HL indicate a highly probable Bearish continuation.
Target - 37.413
About Used Indicators:
The average true range (ATR) plays an important role in 'Supertrend' as the indicator uses ATR to calculate its value. The ATR indicator signals the degree of price volatility.
Disclosure: I am part of Trade Nation's Influencer program and receive a monthly fee for using their TradingView charts in my analysis.
———————————
WISH YOU ALL LUCK

SILVER: Strong Bullish Sentiment! Long!
My dear friends,
Today we will analyse SILVER together☺️
The in-trend continuation seems likely as the current long-term trend appears to be strong, and price is holding above a key level of 38.281 So a bullish continuation seems plausible, targeting the next high. We should enter on confirmation, and place a stop-loss beyond the recent swing level.
❤️Sending you lots of Love and Hugs❤️

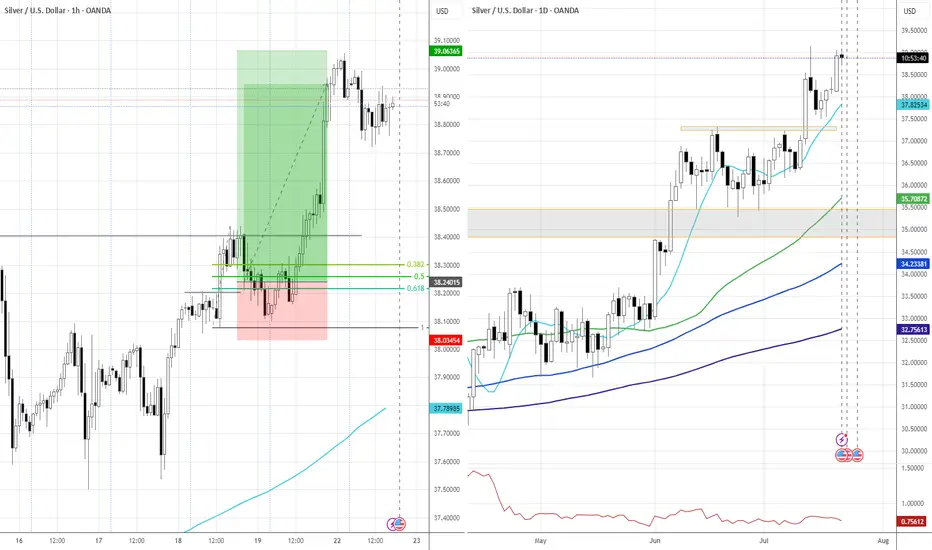
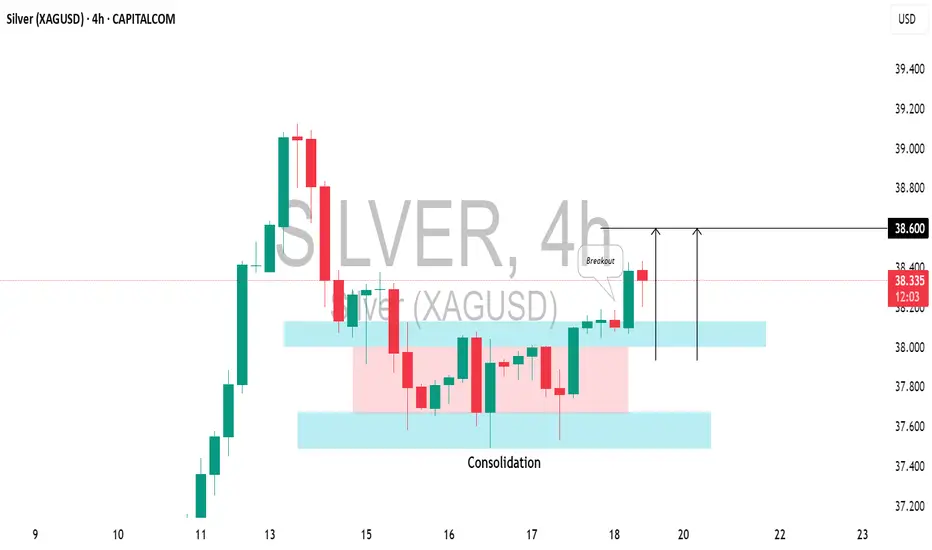
SILVER (XAGUSD): Bullish Move ConfirmedIt appears that the local correction on 📈SILVER has completed, and the pair is shifting back to a bullish trend.
Today's US economic data caused the pair to break through a resistance level within a narrow consolidation range on the 4-hour chart.
The price is expected to rise to the 38.60 level.
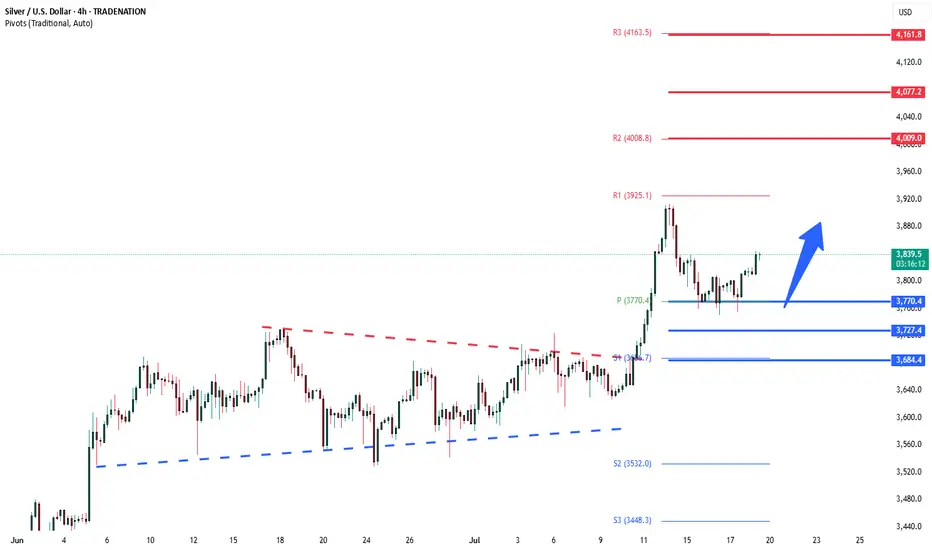
Silver bullish above 3770The Silver remains in a bullish trend, with recent price action showing signs of a continuation breakout within the broader uptrend.
Support Zone: 3770 – a key level from previous consolidation. Price is currently testing or approaching this level.
A bullish rebound from 3770 would confirm ongoing upside momentum, with potential targets at:
4000 – initial resistance
4077 – psychological and structural level
4160 – extended resistance on the longer-term chart
Bearish Scenario:
A confirmed break and daily close below 3770 would weaken the bullish outlook and suggest deeper downside risk toward:
3727 – minor support
3685 – stronger support and potential demand zone
Outlook:
Bullish bias remains intact while the Silver holds above 3770. A sustained break below this level could shift momentum to the downside in the short term.
This communication is for informational purposes only and should not be viewed as any form of recommendation as to a particular course of action or as investment advice. It is not intended as an offer or solicitation for the purchase or sale of any financial instrument or as an official confirmation of any transaction. Opinions, estimates and assumptions expressed herein are made as of the date of this communication and are subject to change without notice. This communication has been prepared based upon information, including market prices, data and other information, believed to be reliable; however, Trade Nation does not warrant its completeness or accuracy. All market prices and market data contained in or attached to this communication are indicative and subject to change without notice.
SILVER - NEW BREAKOUT !Hello Traders !
The Silver price formed a bullish descending triangle!
Currently, the resistance level (37.50 - 36.50) is broken!
This key level becomes new support level!
So, I expect a new bullish move🚀
______________
TARGET: 41.50🎯

Silver Rebounds Toward $38 as Dollar EasesSilver rebounded toward $38 per ounce on Friday, recovering from a two-day decline as the U.S. dollar and Treasury yields eased. The move reflected shifting sentiment on Fed policy and trade conditions after earlier losses sparked by inflation data that reduced hopes for near-term rate cuts.
U.S. stock futures edged higher following record closes for the S&P 500 and Nasdaq, driven by strong retail sales, lower jobless claims, and optimism in AI-related tech stocks after Taiwan Semiconductor’s positive forecast. On monetary policy, Fed officials remain divided: Mary Daly expects two rate cuts this year, while Adriana Kugler urges caution due to tariff-driven inflation. President Trump reinforced trade tensions by sending letters to over 20 partners setting new tariffs between 20% and 40%.
In corporate updates, United Airlines expects stronger earnings in the second half of 2025, and Chevron signaled higher future cash flow as production in its top U.S. oil field nears a plateau.
Resistance is at 38.50, while support holds at 37.20.
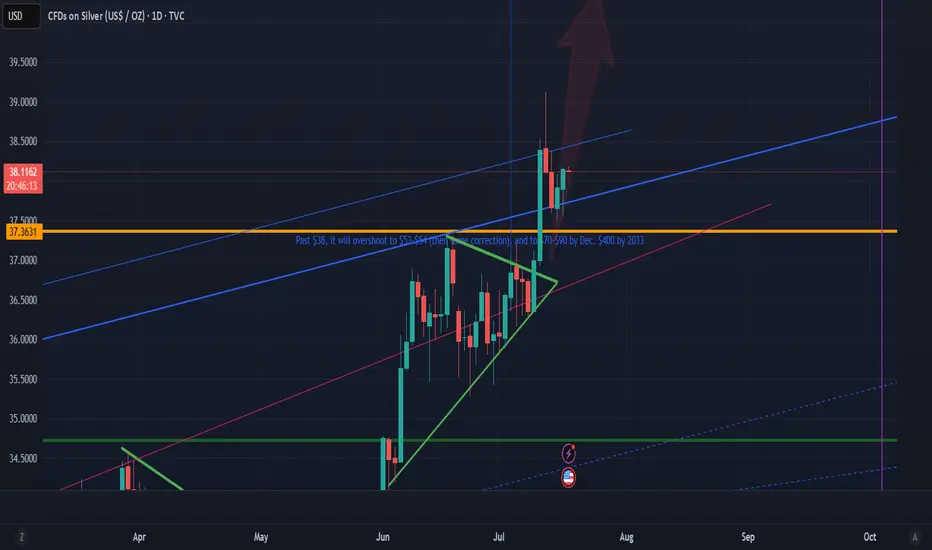
Vertical spike to blow past 50 is imminent Vertical spike to blow past 50 is imminent. It may not stop maybe until $70. Banks is running out of SLV stocks to short silver. Get ready.... This moment will never happen again. Position position NOW.
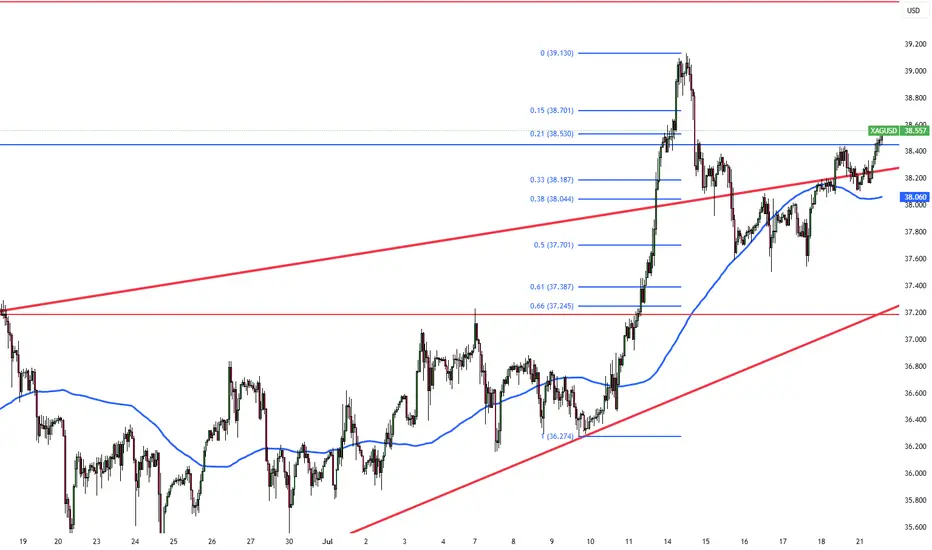
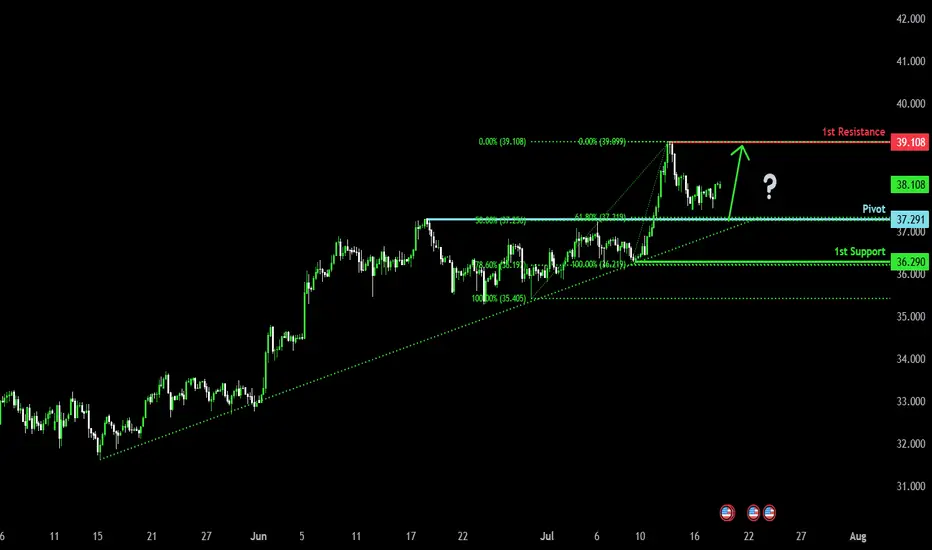
Bullish continuation?The Silver (XAG/USD) is falling towards the pivot and could bounce to the 1st resistance which has been identified as a pullback resistance.
pivot: 37.29
1st Support: 36.29
1st Resistance: 39.10
Risk Warning:
Trading Forex and CFDs carries a high level of risk to your capital and you should only trade with money you can afford to lose. Trading Forex and CFDs may not be suitable for all investors, so please ensure that you fully understand the risks involved and seek independent advice if necessary.
Disclaimer:
The above opinions given constitute general market commentary, and do not constitute the opinion or advice of IC Markets or any form of personal or investment advice.
Any opinions, news, research, analyses, prices, other information, or links to third-party sites contained on this website are provided on an "as-is" basis, are intended only to be informative, is not an advice nor a recommendation, nor research, or a record of our trading prices, or an offer of, or solicitation for a transaction in any financial instrument and thus should not be treated as such. The information provided does not involve any specific investment objectives, financial situation and needs of any specific person who may receive it. Please be aware, that past performance is not a reliable indicator of future performance and/or results. Past Performance or Forward-looking scenarios based upon the reasonable beliefs of the third-party provider are not a guarantee of future performance. Actual results may differ materially from those anticipated in forward-looking or past performance statements. IC Markets makes no representation or warranty and assumes no liability as to the accuracy or completeness of the information provided, nor any loss arising from any investment based on a recommendation, forecast or any information supplied by any third-party.
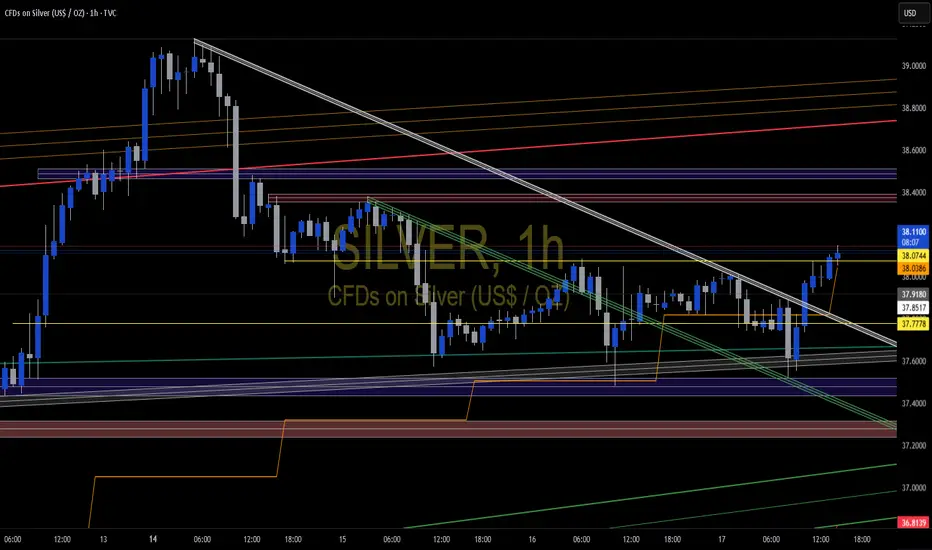
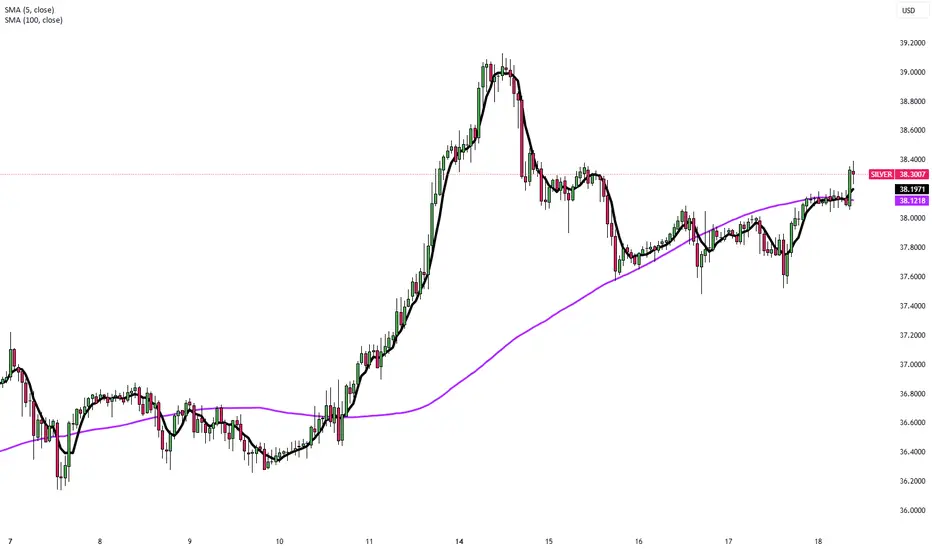
Silver (XAGUSD) – Watch for Bullish Reaction at Key Liquidity ZoDescription:
Silver is now approaching a key liquidity and structural support zone between 37.2805 and 36.8841 (marked by the bottom two blue lines on the chart). This area is likely to attract significant attention, with the potential for stop-losses of buyers below the prior structure to be triggered—a classic liquidity grab scenario.
Trading Idea:
Do NOT enter blindly at these levels.
Wait for price to dip into the 37.28–36.88 range, ideally triggering a liquidity sweep and a spike in volume.
Only consider a long entry after a clear bullish reaction in this zone—such as a strong reversal candle, a bullish engulfing, or a pronounced uptick in net volume.
For extra confirmation, look for a retest of the zone after the first reaction, to confirm that the level is holding as support.
Risk Management:
Stop-loss below the lower end of the entry zone (under 36.88) or the liquidity sweep low.
Target the next resistance levels: 37.88, 38.40, and 38.99–39.00.
Key Points:
The 37.28–36.88 area is a liquidity zone—expect increased volatility and potential for fake-outs.
Wait for confirmation and ideally a retest before considering entry.
Ignore the entry zone if price simply breaks through without a bullish reaction.
Summary:
Let price sweep liquidity and show its hand in the 37.28–36.88 zone. Only enter on clear bullish confirmation and a solid retest. Trade what you see, not what you hope for!