ABB - much needed consolidationABB - after years of steady rise it is time to correct the wave 3 (red count)
This will give investors who believe in the company a good opportunity to get more shares at a discount price.
I predict that at around 440 - 500 SEK the stock will continue to rise in valuation with a potential of about
Next report date
—
Report period
—
EPS estimate
—
Revenue estimate
—
1.98 CHF
3.47 B CHF
29.14 B CHF
1.56 B
About ABB LTD N
Sector
Industry
CEO
Morten Wierod
Website
Headquarters
Zurich
Founded
1988
ISIN
CH0357679619
FIGI
BBG00W7VM4C7
ABB Ltd. is a technology company, which engages in the development and provision of electrification, motion and automation solutions. It operates through the following business segments: Electrification, Motion, Process Automation and Robotics & Discrete Automation. The Electrification segment manufactures and sells electrical products and solutions which are designed to provide safe, smart and sustainable electrical flow from the substation to the socket. The Motion segment manufactures and sells drives, motors, generators, traction converters and mechanical power transmission products that are driving the low-carbon future for industries, cities, infrastructure and transportation. The Process Automation segment develops and sells a broad range of industry-specific, integrated automation and electrification and digital systems and solutions, as well as digital solutions, life cycle services, advanced industrial analytics and artificial intelligence applications and suites for the process, marine and hybrid industries. The Robotics & Discrete Automation segment delivers its products, solutions and services through two operating Divisions: Robotics and Machine Automation. The company was founded on January 5, 1988 and is headquartered in Zurich, Switzerland.
Related stocks

ABBN - CHF | Chart & Forecast SummaryKey Indicators on Trade Set Up in General
1. Push Set Up
2. Range Set up
3. Break & Retest Set Up
Active Sessions on Relevant Range & Elemented Probabilities;
* Asian(Ranging) - London(Upwards) - NYC(Downwards)
* Weekend Crypto Session
Trend | Time Frame Conductive | Daily Time Frame
- General Tre


ABBN - ShortABB broke the lower boundary of the trend channel. Rebound to the channel possible with target in the marked resistance area
________
🚀 Follow for daily posts
🎯 About my posts: They are kept self-explanatory in order to avoid overcomplicating and confusion. Mostly price signals and trend analysis

ABB of SwedenABB went sideways in a wedge pattern since 2009 and broke out to the upside in February of 2021. The stock is in a strong upward trend and is showing confirming downward/sideways flag patterns. After the recent breakout to a new all time high (ATH) the strong trend is likely to continue and the stoc


ABB LTD - BUY ABB LTD has recently touched a very solid support. Right now, there is a beautiful buy opportunity.
The target is shown with an arrow.


ABB looking for buy entryABB is of interest because fundamental analysis says it could reach SEK 244,-
However, at the moment it doesn't seem to have enough power to break through the overhead resistance just yet.
On the 4h chart we have clear divergence between the price action and the RSI, AND we have declining volume. Al

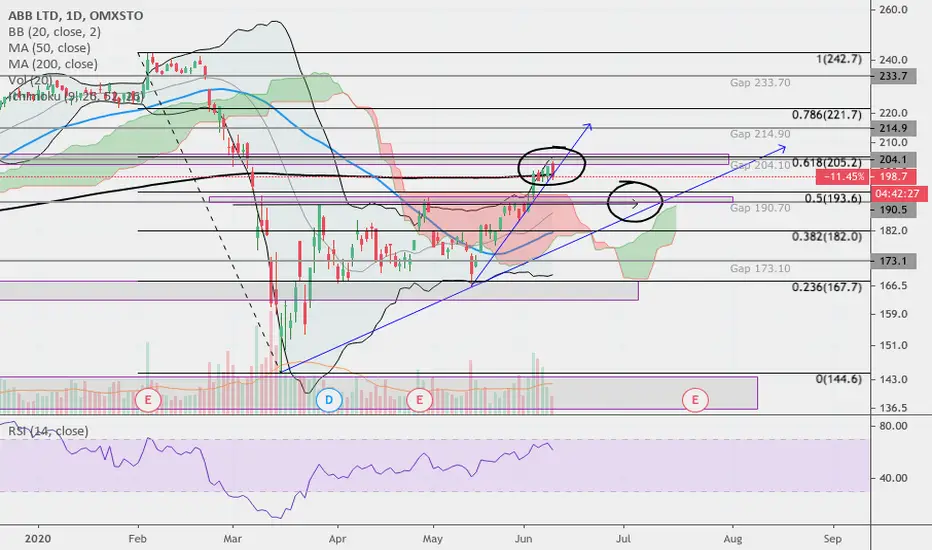
ABB buying opportunityAs analysts are giving ABB a target of around 240, I am looking for a buying opportunity.
At the moment ABB might be rejected at the current resistance area around 202-206. This resistance also represents the 0.618 fib retrace of the 'corona dump'. The trendline (blue) is still holding, but if it br
See all ideas
Summarizing what the indicators are suggesting.
Oscillators
Neutral
SellBuy
Strong sellStrong buy
Strong sellSellNeutralBuyStrong buy
Oscillators
Neutral
SellBuy
Strong sellStrong buy
Strong sellSellNeutralBuyStrong buy
Summary
Neutral
SellBuy
Strong sellStrong buy
Strong sellSellNeutralBuyStrong buy
Summary
Neutral
SellBuy
Strong sellStrong buy
Strong sellSellNeutralBuyStrong buy
Summary
Neutral
SellBuy
Strong sellStrong buy
Strong sellSellNeutralBuyStrong buy
Moving Averages
Neutral
SellBuy
Strong sellStrong buy
Strong sellSellNeutralBuyStrong buy
Moving Averages
Neutral
SellBuy
Strong sellStrong buy
Strong sellSellNeutralBuyStrong buy
Displays a symbol's price movements over previous years to identify recurring trends.
Frequently Asked Questions
The current price of ABBNE is 53.70 CHF — it has increased by 0.45% in the past 24 hours. Watch ABB LTD N 2. LINIE stock price performance more closely on the chart.
Depending on the exchange, the stock ticker may vary. For instance, on SIX exchange ABB LTD N 2. LINIE stocks are traded under the ticker ABBNE.
ABBNE stock has risen by 0.26% compared to the previous week, the month change is a 13.27% rise, over the last year ABB LTD N 2. LINIE has showed a 9.97% increase.
ABBNE reached its all-time high on Jan 24, 2025 with the price of 54.06 CHF, and its all-time low was 16.02 CHF and was reached on Feb 11, 2016. View more price dynamics on ABBNE chart.
See other stocks reaching their highest and lowest prices.
See other stocks reaching their highest and lowest prices.
ABBNE stock is 1.71% volatile and has beta coefficient of 1.22. Track ABB LTD N 2. LINIE stock price on the chart and check out the list of the most volatile stocks — is ABB LTD N 2. LINIE there?
Today ABB LTD N 2. LINIE has the market capitalization of 97.72 B, it has decreased by −1.06% over the last week.
Yes, you can track ABB LTD N 2. LINIE financials in yearly and quarterly reports right on TradingView.
ABB LTD N 2. LINIE is going to release the next earnings report on Oct 16, 2025. Keep track of upcoming events with our Earnings Calendar.
ABBNE earnings for the last quarter are 0.50 CHF per share, whereas the estimation was 0.51 CHF resulting in a −2.13% surprise. The estimated earnings for the next quarter are 0.53 CHF per share. See more details about ABB LTD N 2. LINIE earnings.
ABB LTD N 2. LINIE revenue for the last quarter amounts to 7.06 B CHF, despite the estimated figure of 6.98 B CHF. In the next quarter, revenue is expected to reach 7.19 B CHF.
ABBNE net income for the last quarter is 950.69 M CHF, while the quarter before that showed 990.67 M CHF of net income which accounts for −4.04% change. Track more ABB LTD N 2. LINIE financial stats to get the full picture.
No, ABBNE doesn't pay any dividends to its shareholders. But don't worry, we've prepared a list of high-dividend stocks for you.
As of Aug 2, 2025, the company has 109.9 K employees. See our rating of the largest employees — is ABB LTD N 2. LINIE on this list?
EBITDA measures a company's operating performance, its growth signifies an improvement in the efficiency of a company. ABB LTD N 2. LINIE EBITDA is 5.47 B CHF, and current EBITDA margin is 18.65%. See more stats in ABB LTD N 2. LINIE financial statements.
Like other stocks, ABBNE shares are traded on stock exchanges, e.g. Nasdaq, Nyse, Euronext, and the easiest way to buy them is through an online stock broker. To do this, you need to open an account and follow a broker's procedures, then start trading. You can trade ABB LTD N 2. LINIE stock right from TradingView charts — choose your broker and connect to your account.
Investing in stocks requires a comprehensive research: you should carefully study all the available data, e.g. company's financials, related news, and its technical analysis. So ABB LTD N 2. LINIE technincal analysis shows the buy rating today, and its 1 week rating is strong buy. Since market conditions are prone to changes, it's worth looking a bit further into the future — according to the 1 month rating ABB LTD N 2. LINIE stock shows the buy signal. See more of ABB LTD N 2. LINIE technicals for a more comprehensive analysis.
If you're still not sure, try looking for inspiration in our curated watchlists.
If you're still not sure, try looking for inspiration in our curated watchlists.