CFR trade ideas

Ascending Triangle Breakout on CFRAn ascending triangle chart pattern has been forming on JSE:CFR since early Jan. It is currently breaking out of the top of the triangle. If it confirms, this could be a good sign for a long position.

CFRAnalysis - Extract from weekly report 01-05 Feb
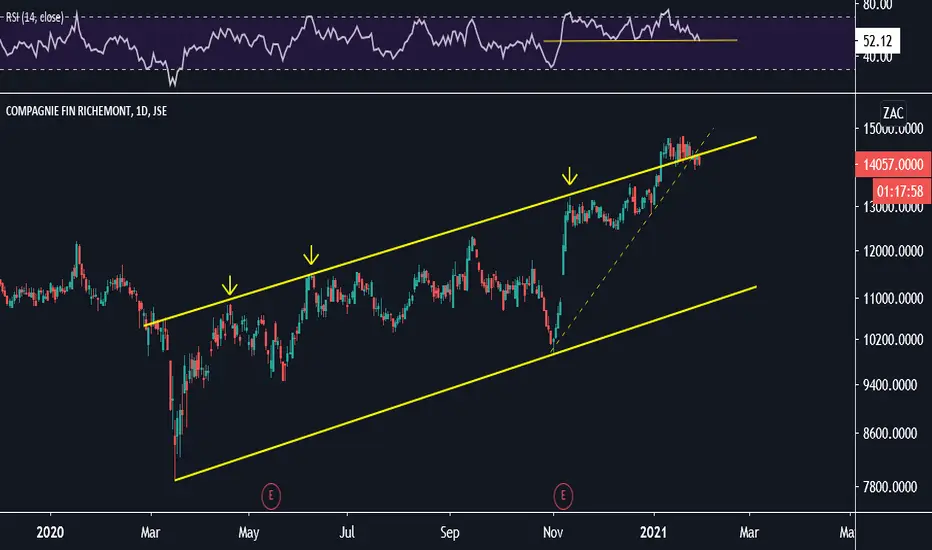
Richemont (CFR, 13986c)-Following a brief consolidation phase above the upward trending channel, the price has started to shift back into the channel, making lower highs and breaching the upward trend extending back to 30 October 2020 (yellow dotted). We also note the RSI in neutral territory with a 50 reading as it looks to break horizontal support (see upper panel). The first support level for the name comes in at 13477 which is the rising 50-day moving average. Daily Chart.

Richemont - Drifting Back Into The ChannelObservation
- Drifting Back Into The Channel
- RSI at 50, about to break support
- Price lost 8-day EMA
CFR - easy breakout trade setup hereJust a nice small range. A break of it in either direction should make for a decent risk-reward trade.

CFR - Struggling at ResistanceJSE:CFR seems to be struggling at a resistance level that it has traded at in August 2018 and November 2017. If it doesn't break through this level and creates lower lows, we can possibly be looking at a short position with a target at the gap from 5 November.

$JSECFR big gap upside because of company earnings was release.$JSECFR big gap upside because of company earnings was release. Drove the South Africa Market upside.
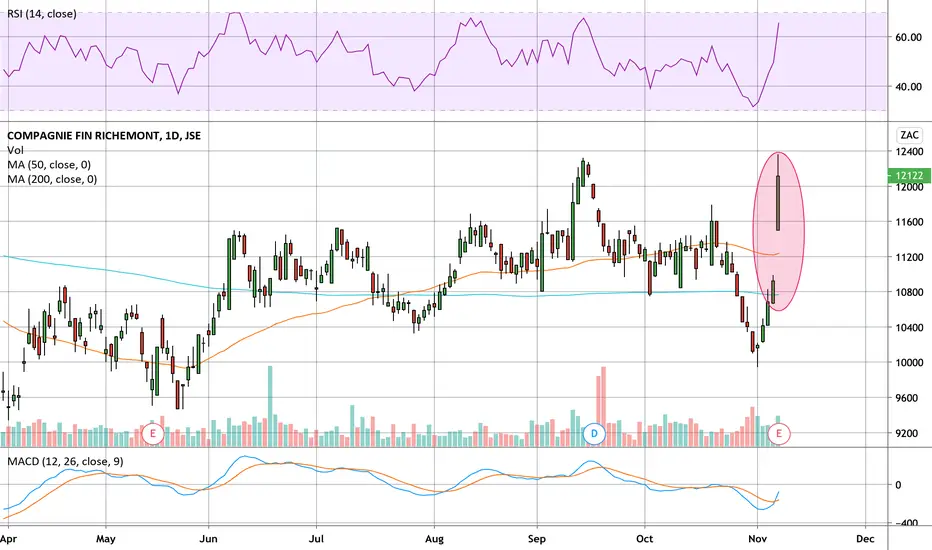
Head & Shoulder Pattern for CFRA nice Head & Shoulders pattern has appeared on JSE:CFR and with today's movement, it has broken through the neckline. If it continues to play out and head downwards, we could see a move all the way down to the 9400 level.

Hold the line in Richemont for nowWould keep a close eye on Richemont over the next few days. We just saw a break below the medium-term recovery trend. Should this turn out not to be a false break, could see the share price test R108 support level soon. A break and close below R108, could see CFR test the July lows around R104.40, with a break and close below this support level, bring back the long-term support level of R97, into play.
As I still believe in CFR’s long-term value proposition, I would not necessarily call it a short at current levels, but would definitely holdoff on buying for now.
The 14-day RSI is not OVERSOLD yet, which could see CFR test R100-R105 levels soon. Will revaluate lower.


M-Formation!Jumping in on completion of the M-Formation here. WIde stop loss to give it room to move.

CFR: Golden cross signalling upside potential (again)?The previous instances of the Golden Cross signalled some upside potential.

Inverted Hammer - Bullish on JSE:CFRA Inverted Bullish Hammer has formed on CFR, but could this play out for the long run?
The MACD is still negative and RSI is also a bit low on the daily chart, but the Bolinger Bands seems to be getting closer to each other so let's see what happens today.
Let me know your thoughts and remember this is not financial advice.


CFR ShortCFR bouncing on LTR ready for C wave
Be Careful the last C Wave ran from 12261 down to 6642
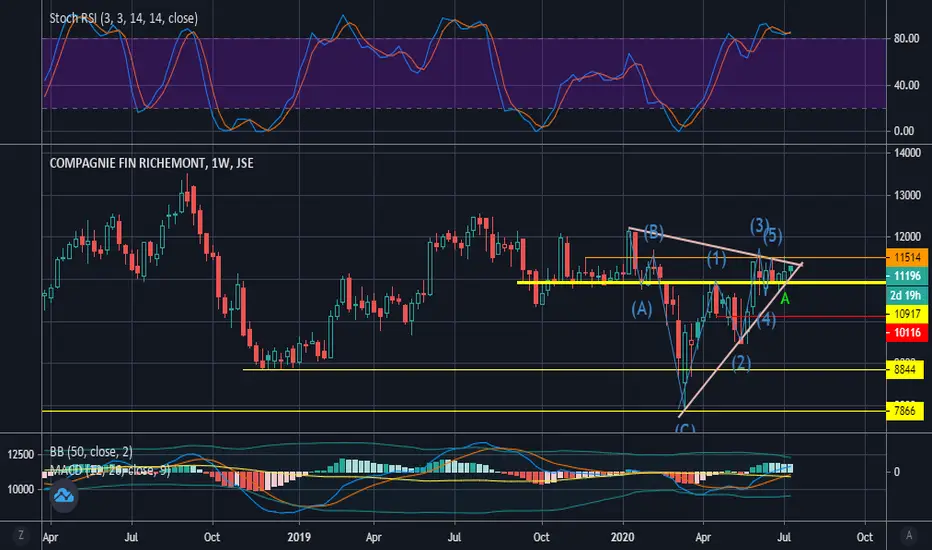
CFR: some upside potential? (Investing)Will that inclining channel support the price action to reach the upper range?

CFR possible long with breakoutCFR start of B wave
with volatility this high
we could see a movement up
with volumes


