UBER long-term gemOn the monthly chart, Uber broke out from a massive ascending triangle and successfully retested the upper resistance, flipping it into support. You’re not ready for what’s coming!
UBER trade ideas


UBER Breakout Alert!
Breaking above resistance with rising support — eyes on $95.75 🎯
Entry: $93.28 | SL: $92.70 | TP: $95.75
📈 Bullish momentum in play.
#UBER #BreakoutTrade #StockTrading #BullishSetup #ProfittoPath

$UBER: Why $UBER Is a Robotaxi WinnerUber is on the verge of a major transformation, with robotaxis set to become a game-changing profit engine.
Technical charts indicate we can enter a long position today with low risk, while aiming for a long term rally resumption from here. Monthly and quarterly timeframe Time@Mode trends are bullish, suggesting price can reach heights between $111, $176 and $265 per share long term.
Here’s why the future looks bright for Uber investors from a fundamental perspective:
The global robotaxi market is projected to surge from $0.4B in 2023 to $45.7B by 2030, with Uber aggressively expanding its autonomous fleet in the U.S. and Europe through partnerships.
Uber’s approach is to integrate autonomous vehicles from partners (Waymo, May Mobility, Momenta, Avride, Volkswagen) into its platform, avoiding the massive costs and risks of building its own AVs.
Autonomous vehicles will slash Uber’s largest expense -driver payments- unlocking higher margins and scalability. CEO Dara Khosrowshahi calls AVs Uber’s “greatest future opportunity” for profit expansion.
Robotaxi pilots are already live in cities like Austin, with plans to expand to Atlanta, Dallas, and Europe by 2026. The average Waymo vehicle on Uber is busier than 99% of human drivers, showing strong demand and efficiency.
Uber’s core business is robust: Q1 2025 gross bookings up 14% to $42.8B, net income of $1.8B, and adjusted EBITDA up 35% to $1.9B. This profitability funds AV investments without sacrificing financial health.
Uber is uniquely positioned to lead the robotaxi revolution, leveraging its platform, partnerships, and financial strength. As AVs scale, expect a step-change in profitability and long-term shareholder value.
Best of luck!
Cheers,
Ivan Labrie.

Uber’s Path to $95+Uber Technologies (UBER) is positioning itself for long-term growth by expanding beyond its core ride-hailing and delivery businesses into advertising, travel, service partnerships, and autonomous vehicle (AV) technology. These strategic moves aim to diversify revenue streams and enhance operational efficiency.
Key Growth Drivers:
- Strong Core Business Performance – Uber continues to benefit from robust demand in both ride-hailing and delivery, generating significant economic profit.
- Artificial Intelligence Integration – AI plays a crucial role in optimizing pricing, reducing wait times, personalizing user experiences, and preventing fraud.
- Autonomous Vehicle Expansion – Uber is increasingly leveraging AV technology to reduce driver-related costs and scale its services.
- Strategic Investments – The company is using its strong cash flow to fund innovation, product development, acquisitions, and minority investments, driving long-term value.
- Capital-Efficient Growth – Uber’s ability to expand its service platform with minimal capital investment is expected to accelerate revenue growth and shareholder value creation.
Price Target & Options Flow:
Tigress Financial has raised Uber’s price target from $103 to $110, maintaining a Buy rating. Additionally, option flow on Uber is showing strong bullish activity, suggesting institutional interest. Given this momentum, Uber could potentially surpass $95 before August, especially if AV advancements and AI-driven efficiencies continue to strengthen its financial outlook

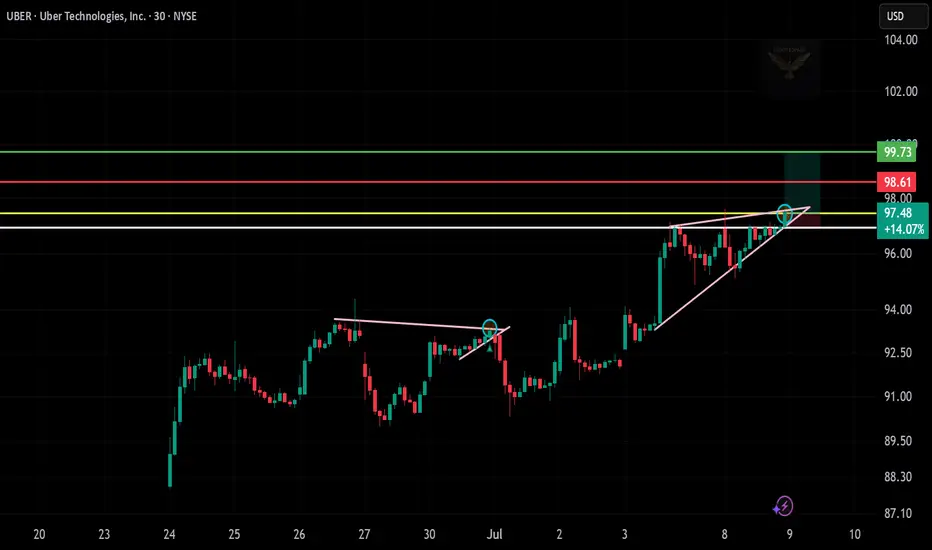
Long Trade Description (UBER | Uber Technologies Inc.)📄
Ticker: NYSE:UBER
Timeframe: 30-Minute Chart
Trade Type: Long – Ascending Triangle Breakout
UBER is forming a strong ascending triangle near resistance, with bullish momentum and clean structure. Entry is taken around $97.48, anticipating a breakout above the horizontal level. Target is set at $99.73, while the stop-loss is placed just below the triangle trendline at $96.00.
With strong trend continuation and multiple rejections at resistance, this trade offers a clear risk-to-reward opportunity with solid breakout confirmation.
📌 Trade Levels:
Entry: $97.48
Target: $99.73
Stop-Loss: Below $96.00
💡 Chart shared for educational use only — not financial advice.
📊 Follow @ProfittoPath for more actionable trade setups and real-time breakdowns.
UBER longBroken long term resistance, retested, and once again pushed 20 day Donchian Channel.
Turtles are coming out of their shells taking UBER to the new ATHs.
Long term hold.

UBER · Daily — “Channel-Break” Idea Toward $110 → $125Why I Like the Setup
Secular Up-Channel: Since mid-2023 price has respected a textbook rising channel (~$30 tall).
Fresh Breakout Attempt: UBER is now pressing the upper rail near $100. A daily close above it would signal a new expansion phase.
Measured-Move Math: Projecting the channel’s height from the breakout pivot (~$80) gives Target-1 ≈ $110-113; the 127 % fib expansion points to Target-2 ≈ $124-128.
Volume Profile Tailwind: The histogram thins sharply once price is north of $100, meaning little “stored” supply until $112; a larger node re-appears near $120, my second profit zone.

Uber (UBER, 1W) Tightening Structure Ready for BreakoutOn the weekly chart, UBER has formed a strong ascending wedge / tightening channel, showing clear higher lows and repeated rejections near upper resistance. The price is now approaching the apex of the pattern, with a possible breakout setup above $82.42.
If confirmed, the projected measured move (H = $27.67) aligns with Fibonacci extension targets at:
– $89.86 (1.272)
– $93.74 (1.414)
– $99.32 (1.618)
Technical structure:
– Price held support twice, confirming bullish intent
– Structure tightening — breakout likely on sustained volume
– Bullish divergence forming on the weekly stochastic oscillator
– A breakout above $82.42 activates the next impulse wave
– Volume is stable, with no signs of heavy distribution
Fundamentals:
Uber has reached a major financial milestone: consistent profitability and positive EBITDA growth. The company continues to expand across mobility and delivery, with a focus on cost efficiency, platform monetization, and retention. Increased user activity and growing institutional interest support a bullish mid-term thesis. Uber is increasingly seen as a core holding in next-gen tech and services portfolios.
The technical structure is approaching resolution. A confirmed breakout above $82.42 opens the door for a move to $89.86 → $93.74 → $99.32. With bullish structure and improving fundamentals, Uber is positioned for the next leg higher. This is a setup worth watching.


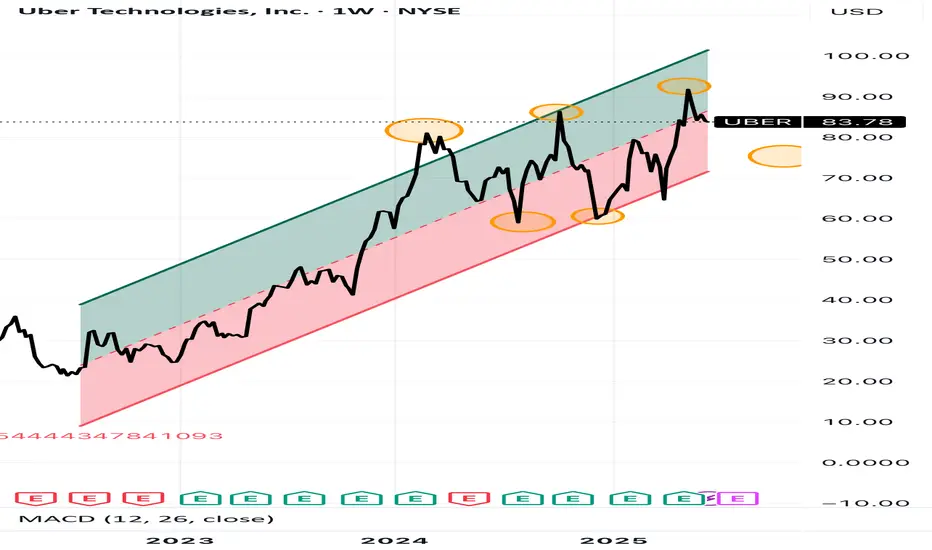
Ride UBER to $300.00 The chart of Uber Technologies Inc. (UBER) showcases a multi-year bullish setup following a prolonged accumulation phase and key breakout signals:
Consolidation: The stock entered a horizontal consolidation phase above previous resistance, now acting as strong support ($60–$80), confirmed by multiple bounce points (green arrows).
Measured Move Projection: The current breakout from consolidation implies a 34% immediate upside target to $110.36, followed by a long-term target of $316.90, mirroring the prior major impulse.
Volume Profile: Volume spikes during uptrends and stable participation during consolidation suggest institutional accumulation.
🔑 Key Technical Levels
Support Zones: $80.00 (major), $60.00 (breakdown risk),
Short-Term Target: $110.36
Long-Term Extension Target: $316.90 (288% move)

UBER: RISK ADJUSTED MODELUBER – Daily SMC Structure Points to $ 151 Risk-Adjusted Target
Context
• Strong BOS off the 2024 discount block (≈ $ 63-67) confirms bullish order-flow.
• Price is now back inside the premium box (≈ $ 95-105). A weekly close above $ 95 opens the weak-high sweep.
• Long-term “Risk-Adjusted Model” extension projects to $ 151.68 (1.618 confluence).
Trade Plan
• Entry Zone $ 88-92 (current equilibrium retest).
• Invalidation Daily close < $ 80 (below most recent imbalance).
• Targets T1 $ 105 (weak high) → T2 $ 128 (1.272 FE) → T3 $ 151.68 (1.618).
• Stop Initial $ 79 | Trail after $ 105 break.
Narrative
As rideshare profitability tightens and AV partnerships expand, institutional flow continues to accumulate below premium. A clean break above $ 95 should ignite the next liquidity leg.
Educational / not financial advice.
#UBER #SmartMoney #OrderFlow #Fibonacci #WaverVanir #VolanX

UBER short term bearish!UBER Stock Analysis: June 23, 2025
Key Points:
• Institutional buying in UBER often sparks bullish momentum, but traders are quick to short or cover positions at perceived segment lows, frequently leveraging news about Robotaxi developments to shape the market narrative.
• Elon Musk’s Robo Taxi project is gaining significant traction on social media, especially with the announcement of a flat $4.20 fee per ride. This innovation is dampening UBER’s upward momentum, particularly as UBER’s own Waymo partnership is seen as a less compelling alternative.
• UBER appears to have reached a growth plateau. The company now faces pressure to identify new revenue streams to fulfill its growth commitments to investors.
• The prevailing trend for UBER is currently bearish. Given these conditions, it is advisable to cover any long call positions for the time being.
Uber: Upward Momentum ExpectedUber attempted to counter recent sell-offs with an upward move; however, downward pressure quickly resumed. We must still consider a 35% chance that the turquoise wave alt.3 has already concluded, which would imply direct declines below support at $77.57 during wave alt.4 . In this scenario, long entry opportunities could emerge within our alternative turquoise Target Zone between $65.94 and $57.24. Primarily, the regular wave 3 should reach its peak well above the $94.10 mark, and wave 4 would start later.
📈 Over 190 precise analyses, clear entry points, and defined Target Zones - that's what we do.

Short Uber to deathUber driver's pay is declining constantly. This week it reached the point where good drivers are quitting. The self driving technology to replace these drivers is not yet here. Uber will start absorbing the self driving cars maintenance costs. They will be surprised how much money it takes to have a running clean car. Uber jacked up riders prices to prepare for this; accounting them as insurance costs. Riders are looking more and more into cheaper alternatives. Public transportation is making a come back.
Uber will be bankrupt with this model. Their biggest mistake is not taking care of their biggest asset; their drivers.
I'm shorting UBER to their death.

#UBERUber shares will fall by at least 60% due to the blatant and flagrant infringement of Carma Technology's patents.

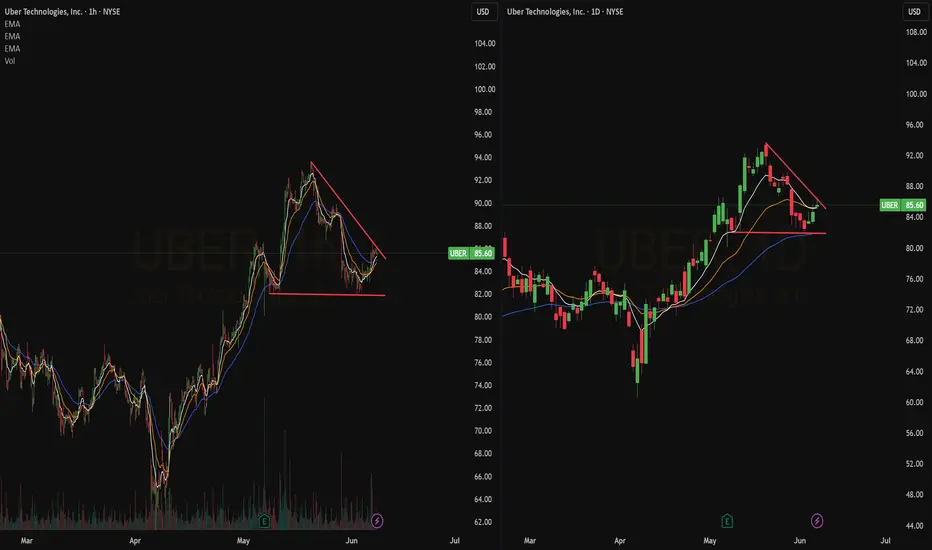
Quick View: $UBER- Bullish setup on the daily that sees a triangle with support found on the ema 50Daily.
- Classic pullback on the hourly
Area of $86-$87 as key resistance.
Support → $81
Is This the Perfect Moment to Execute the UBER Heist?💰 UBER Stock Market Heist Blueprint 🚀
🌟 Hi! Hola! Ola! Bonjour! Hallo! Marhaba! 🌟
Dear Money Makers & Robbers, 🤑💰💸✈️
Here’s our grand plan: a 🔥Thief Trading Style heist🔥 targeting the UBER stock! Let’s break in with this cunning strategy — chart-ready and primed for action!
🎯 Entry:
The vault’s open! Grab the bullish loot at any price — the heist is live!
Tip: For precision, use a buy limit order on 15m/30m swing highs or lows — that’s your perfect pullback entry!
🛑 Stop Loss:
Thief SL is stashed at the nearest swing low (or just below the MA on the daily chart ~80.00 for swing trades).
Tailor SL to your trade risk, lot size, and your thieving gang’s order plan.
🏴☠️ Target:
100.00 — or vanish before hitting the target to avoid the traps of the overbought zone!
💎 The Setup:
We’re seeing bullishness fueled by key factors: macro moves, fundamentals, sentiment, intermarket trends… it’s all in play! 📈🔗🌏
Check the macro, COT report, sentiment outlook, and future trend targets to stay ahead of the game!
⚠️ Trading Alert:
News releases can flip the game fast.
Avoid fresh trades during major news.
Use trailing stops to lock in those juicy profits and protect your loot.
❤️🔥 Support the Heist Crew!
💥Hit the Boost Button💥 — fuel our robbery plans and let’s keep cashing in every day!
The Thief Trading Style: slick, powerful, and ready for the next heist.
See you soon with another plan, fellow robbers! 🤑🐱👤🤩

UBER results on quick flips for this ticker--Long @ 82.53 If I ranked the performance of UBER with my algo vs. all the other large caps I trade, it would rank right near the top with regard to return per day held. I don't rank it, because I don't have enough historical data to include it in my rankings.
Its limited results are impressive, however. 196-3 (the 3 are open from the last 3 days) with an average gain of 2.83% and an average hold period of 10 trading days. That's around 7x the daily average return of the market overall.
Additionally, it is currently right at support from the most recent low in early May and the high in February. On a longer scale, it is in a long-term uptrend and only 10 trading days removed from its all-time high. That makes me even more convinced that this is just a normal correction in an uptrend. The pullback has been significant, though, down 9 out of the 10 trading days since that ATH. However, the 5 down days in a row is a solid short term contrarian indicator, historically speaking.
I won't add daily if it keeps falling, in the interests of maintaining portfolio balance and diversification, but I am open to tactically adding to the position. The plan is for a FPC exit, as long as the return is > 0.10% if that FPC comes on day 1 of the trade. Below that, I will hold until a satisfactory exit point is reached.
As always - this is intended as "edutainment" and my perspective on what I am or would be doing, not a recommendation for you to buy or sell. Act accordingly and invest at your own risk. DYOR and only make investments that make good financial sense for you in your current situation.

Uber Technologies (UBER) – Break & Retest + Long-Term GrowthOverview Summary
Uber Technologies Inc. ( NYSE:UBER ) has approached a structurally significant price zone, both from a technical and fundamental lens. After a strong rally into the $90s, price action has pulled back toward a multi-year resistance-turned-support zone between $81–84. This zone previously capped rallies throughout 2023–2025 and now offers a potential launchpad for a continuation into new all-time highs, especially with the macro backdrop favoring Uber’s platform model.
Technical Insight:
The 4H chart shows a breakout-retest structure, where price is retesting the prior resistance band. This aligns with historical price memory and volume pockets. A successful retest and base in this zone would signal fresh accumulation and set up the next leg toward $100+.
Support Zone: $81.00–85.00
Breakout Target: $100.00
Medium-Term Target: $120
Invalidation Zone: $80
Why We’re Buying Uber: Long-Term Conviction + Technical/Fundamental Confluence
Dominance in Mobility & Delivery: Uber is expanding its lead as the global leader in ride-sharing and food delivery, with strong pricing power and platform scale.
Free Cash Flow Growth: Uber’s recent quarters show consistent positive FCF, with improving margins and reduced reliance on subsidies.
Operating Leverage & Cost Discipline: CEO Dara Khosrowshahi has emphasized discipline, turning Uber into a more predictable, leaner machine.
Uber for Business, Freight, and Ads: These emerging verticals are quietly building into high-margin growth engines, adding new levers to long-term valuation.
AI & Automation Tailwinds: Uber is positioned to integrate AI across logistics, routing, and customer personalization, driving efficiency and margin expansion.
Valuation Reset Opportunity: Compared to high-growth tech peers, Uber trades at a relative discount despite superior revenue growth and execution.
Final Thoughts
We at Green Zone Capital see Uber as a long-term compounder in the platform economy, bridging mobility, logistics, and commerce. Technically, the current pullback may serve as a high-conviction re-entry zone after a multi-month rally. If this zone holds and confirms strength, the upside potential over the next few quarters is significant.

Uber: Topped out Already?Uber sold off sharply after topping out at $94.10 – thus, our short-term alternative scenario needs to be considered. In this view (35% probability), turquoise wave alt.3 has already concluded, and the stock is headed toward a pullback in wave alt.4 . That retracement would likely bottom in the turquoise Target Zone between $65.94 and $57.24 — a potential setup for long entries. The primary scenario remains more bullish: we expect a renewed push above $94.10 to complete the regular turquoise wave 3.
📈 Over 190 precise analyses, clear entry points, and defined Target Zones - that's what we do.

UBER – Momentum Pullback to 20 SMA: Classic Continuation SetupUber is giving one of my favorite swing setups — a shallow pullback into the “bone zone” (between the 9 EMA and 20 SMA) during a hot market.
🔹 Trend Continuation Play
Strong momentum stock pulling back right into the 20 SMA — not a deep retrace, just enough to reload.
In hot markets, I don’t wait for deep dips — I want tight consolidations into momentum zones.
🔹 The Bone Zone Setup
The shaded area between the 9 EMA and 20 SMA is where momentum stocks often base before the next leg up.
Price is respecting that zone perfectly — no breakdown, just controlled digestion.
🔹 Oversold Stochastics
Stochastics are in oversold territory — adds confirmation that this is a high-quality dip within a strong trend.
My Trade Plan:
1️⃣ Entry: Looking to start a swing position off the 20 SMA.
2️⃣ Add: On confirmation candle back above 9 EMA with volume.
3️⃣ Stop: Below 20 SMA lows — tight risk, strong reward if trend continues.
Why I Love This Setup:
Market’s hot — I want to ride strength, not fade it.
NYSE:UBER is a trending name with institutional accumulation.
This pattern has worked again and again in strong tape.

Bullish UBERThe 2-week candlestick performance of Uber Technologies highlights a large consolidation zone between $60 and $88. The price is currently testing heavy resistance around $88, a level that previously triggered multiple rejections.
A confirmed breakout above this level projects a potential 42% upside towards the $120 –$125 range.
Target : $125.00
