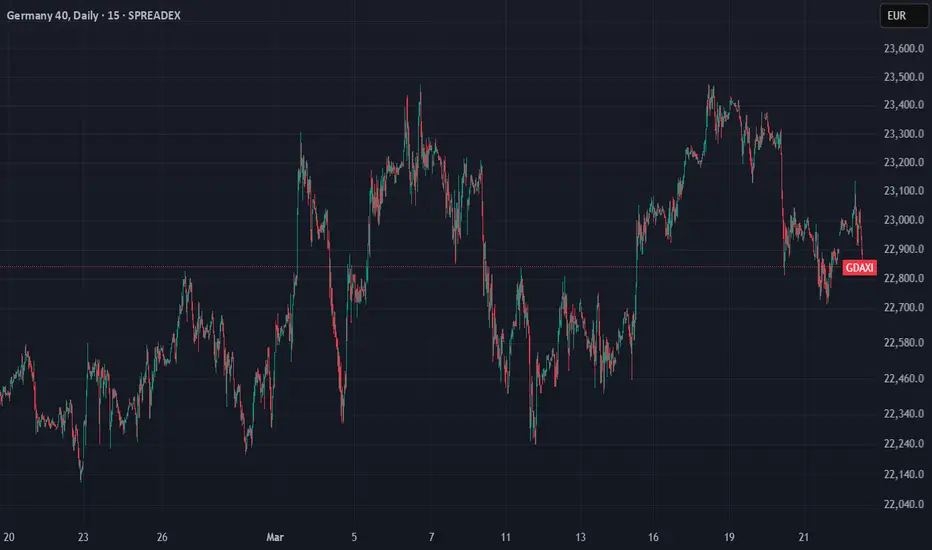
Trade Idea: DAX 40 (15m Chart)Trade Idea: DAX 40 (15m Chart)
Price is currently retracing towards a higher timeframe Fair Value Gap (FVG) zone. This area aligns with previous supply and offers a high-probability short setup. Once price enters this FVG, watch for bearish confirmation such as a rejection candle or a shift in market structure on lower timeframes.
DE40 trade ideas

DAX INTRADAY under pressure from 25% tariff on car imports The U.S. announced a 25% tariff on all car imports starting next week, pushing automaker stocks lower. Meanwhile, the EU expects Washington to impose double-digit tariffs across the bloc when Trump announces reciprocal levies on April 2, sources say. Trump also warned of more tariffs on the EU and Canada if they act against U.S. economic interests. The news weighed on the DAX 40, pressuring German automakers and exporters.
The DAX40 continues to exhibit bullish sentiment, breaking out from a period of sideways consolidation and pushing toward previous resistance and all-time highs (ATH). The prevailing uptrend supports further upside potential, with key resistance levels in focus.
Key Support and Resistance Levels
Resistance Level 1: 23,446
Resistance Level 2: 23,815
Resistance Level 3: 24,000 - 24,420
Support Level 1: 22,575
Support Level 2: 22,204
Support Level 3: 21,814
Conclusion:
The positive reaction to fiscal spending plans and geopolitical developments reinforces the bullish sentiment for DAX40. A sustained move above the nearest resistance at 23,446 could pave the way toward higher targets, while holding above support at 22,575 is crucial to maintaining the uptrend.
This communication is for informational purposes only and should not be viewed as any form of recommendation as to a particular course of action or as investment advice. It is not intended as an offer or solicitation for the purchase or sale of any financial instrument or as an official confirmation of any transaction. Opinions, estimates and assumptions expressed herein are made as of the date of this communication and are subject to change without notice. This communication has been prepared based upon information, including market prices, data and other information, believed to be reliable; however, Trade Nation does not warrant its completeness or accuracy. All market prices and market data contained in or attached to this communication are indicative and subject to change without notice.

DAX Update – Wave IV in Focus
The current XETR:DAX FOREXCOM:GER40 PEPPERSTONE:GER40 structure appears to be unfolding as Wave IV of a larger impulsive move. The correction remains orderly so far, respecting the channel and the overall bullish structure.
At this point, the most likely scenario is the formation of a triangle within Wave IV. Price action and volume behavior suggest a sideways consolidation before the final push higher.
Once Wave IV completes, we can expect a final rally as Wave V, with a potential target zone around 23,800–25,000.
As long as the structure remains intact, the bullish outlook stays in play.
GERMAN 40 Long Positive Surprises?EU data going to be released:
M3 Money Supply y/y
Private Loans y/y
EU Economic Forecasts
Never the less,technically German 40 is providing very interesting oppurtunity
where the bulls are accumulatiing their positions
Chart:
green arrows: More buys/add to more buying positions
1 profit target,but 7 different entries for aggressive and conservative traders
red-line: Below the red line the strong bearish pressure is starting, where the bulls get bigtroubles.In this case,if the price holds just for a short time below the red zone,but returns back above,it will be a clear sign that the bulls are taking back control.
If not,the bullish trade setup is not valid anymore.
Also it is possible that winning trades should be liquidated immediately,once news catalysts/events cause the market to turn down(market trend change).
In this case I recommand to close immediately the positions, and waiting for new entry signal.
It can also happen, that we have to close the positions, and the price coming back to our origin entry. We can use the stup to enter again,once confirmation aligned with signals(Respecting/Rejecting OF THE RED LINE).

#DAX - 27 MarSimilar to SPX, DAX looks even more bearish based on price action.
IMO, as long as PZ holds, expect further downside.

de40how deep will that sink ? asking for friend.
Year of panic just begun as we can see over seas. Now "biggest europe economy" have to catch up.

European Markets to Continue rally ? BUY GER40 after retraceGER40 retraced this morning in an otherwise quiet market after european markets snapped a three day losing streak yesterday on news that Trump may soften his tariff stance .
Market is quiet until US opens , recent economic data still pointing to upside potential , charts indicating a good point to rebound from .
Stop 22725
Buy 22980
Take Profit 23308
E.

#DAX - 26 MarI called a good bottom yesterday and an almost 400 points up move.
Price is pulling back now. Looking at 23010-30 to hold for a move higher.

DAX Supercycle: Entering the Age of Global Distribution
The XETR:DAX PEPPERSTONE:GER40 FOREXCOM:GER40 appears to be entering a supercycle phase of global distribution — a period characterized by explosive long-term growth, but also extreme volatility along the way.
This phase is fueled by two key structural forces:
1. Ongoing fiat currency devaluation, which boosts nominal asset prices.
2. German multinational corporations — most of the DAX components are globally diversified businesses, not limited by domestic demand.
As long as these companies maintain solid cash flow and international market exposure, there’s a strong case for sustained growth in the index — despite interim corrections and shakeouts.
We're likely heading into a market environment where prices will advance in giant leaps, but corrections will be sharp and fast. Adaptability will be key.

Ger 30 Additional LookOutThis is what I wanted to talk about today, the gap might really mess with our heads if we are not careful enough. Please don't take the motivation offensive, I am just directing the message to people who are as stuck as I am. Happy Trading.

DAX 40 (DE40) Analysis – 25th March 2025Elliott Wave Count
Wave 1: Strong impulsive move upwards, establishing a bullish trend.
Wave 2: A corrective decline, respecting Fibonacci retracement levels.
Wave 3: Largest and most aggressive push, confirming bullish continuation.
Wave 4: Consolidation phase, finding support at a key level.
Wave 5: Final leg up, targeting resistance near historical highs.
Currently, the market is in Wave 5
Key Levels
Major Levels:
23,696 (Major Resistance)
22,883 (Key Support, currently holding)
21,963 (Deeper Support Level)
Mid Levels:
23,369 (Midway Resistance)
22,669 (Bullish Breakout Zone)
Minor Levels:
23,128 (Current Market Price Zone)
22,400 (Potential Retest)
Trading Strategy (Entry, SL, TP)
Buy Scenario:
Entry: 22,883
Stop Loss: 22,669
Take Profit 1: 23,369
Take Profit 2: 23,696
Sell Scenario (If Rejected at 23,696):
Entry: 23,696 (Strong rejection)
Stop Loss: 23,850
Take Profit 1: 23,128
Take Profit 2: 22,883
Bullish breakout above 23,369: 78%
Rejection from 23,696 & drop to 22,883: 62%
Market remains range-bound (between 22,883 - 23,369): 40%
Final Thoughts & Risk Management
The RSI broke out of a downtrend, aligning with a bullish continuation.
Risk-reward ratio is ideal for long entries, but careful monitoring is required near 23,696.
🔥 Conclusion: Bulls are in control, but a breakout above 23,369 is key for continuation. If rejected, shorts become viable.

DAX Euro Area flash PMI data triggered consolidation yesterdayThe DAX40 continues to exhibit bullish sentiment, breaking out from a period of sideways consolidation and pushing toward previous resistance and all-time highs (ATH). The prevailing uptrend supports further upside potential, with key resistance levels in focus.
Key Support and Resistance Levels
Resistance Level 1: 23,446
Resistance Level 2: 23,815
Resistance Level 3: 24,000 - 24,420
Support Level 1: 22,575
Support Level 2: 22,204
Support Level 3: 21,814
Conclusion:
The positive reaction to fiscal spending plans and geopolitical developments reinforces the bullish sentiment for DAX40. A sustained move above the nearest resistance at 23,446 could pave the way toward higher targets, while holding above support at 22,575 is crucial to maintaining the uptrend.
This communication is for informational purposes only and should not be viewed as any form of recommendation as to a particular course of action or as investment advice. It is not intended as an offer or solicitation for the purchase or sale of any financial instrument or as an official confirmation of any transaction. Opinions, estimates and assumptions expressed herein are made as of the date of this communication and are subject to change without notice. This communication has been prepared based upon information, including market prices, data and other information, believed to be reliable; however, Trade Nation does not warrant its completeness or accuracy. All market prices and market data contained in or attached to this communication are indicative and subject to change without notice.

DAX H4 | Rising into resistanceDAX (GER30) is rising towards a swing-high resistance and could potentially reverse off this level to drop lower.
Sell entry is at 23,093.36 which is a swing-high resistance that aligns with the 50.0% Fibonacci retracement.
Stop loss is at 23,260.00 which is a level that sits above the 61.8% Fibonacci retracement and a pullback resistance.
Take profit is at 22,708.85 which is a swing-low support that aligns with the 61.8% Fibonacci retracement.
High Risk Investment Warning
Trading Forex/CFDs on margin carries a high level of risk and may not be suitable for all investors. Leverage can work against you.
Stratos Markets Limited (www.fxcm.com):
CFDs are complex instruments and come with a high risk of losing money rapidly due to leverage. 63% of retail investor accounts lose money when trading CFDs with this provider. You should consider whether you understand how CFDs work and whether you can afford to take the high risk of losing your money.
Stratos Europe Ltd (www.fxcm.com):
CFDs are complex instruments and come with a high risk of losing money rapidly due to leverage. 63% of retail investor accounts lose money when trading CFDs with this provider. You should consider whether you understand how CFDs work and whether you can afford to take the high risk of losing your money.
Stratos Trading Pty. Limited (www.fxcm.com):
Trading FX/CFDs carries significant risks. FXCM AU (AFSL 309763), please read the Financial Services Guide, Product Disclosure Statement, Target Market Determination and Terms of Business at www.fxcm.com
Stratos Global LLC (www.fxcm.com):
Losses can exceed deposits.
Please be advised that the information presented on TradingView is provided to FXCM (‘Company’, ‘we’) by a third-party provider (‘TFA Global Pte Ltd’). Please be reminded that you are solely responsible for the trading decisions on your account. There is a very high degree of risk involved in trading. Any information and/or content is intended entirely for research, educational and informational purposes only and does not constitute investment or consultation advice or investment strategy. The information is not tailored to the investment needs of any specific person and therefore does not involve a consideration of any of the investment objectives, financial situation or needs of any viewer that may receive it. Kindly also note that past performance is not a reliable indicator of future results. Actual results may differ materially from those anticipated in forward-looking or past performance statements. We assume no liability as to the accuracy or completeness of any of the information and/or content provided herein and the Company cannot be held responsible for any omission, mistake nor for any loss or damage including without limitation to any loss of profit which may arise from reliance on any information supplied by TFA Global Pte Ltd.
The speaker(s) is neither an employee, agent nor representative of FXCM and is therefore acting independently. The opinions given are their own, constitute general market commentary, and do not constitute the opinion or advice of FXCM or any form of personal or investment advice. FXCM neither endorses nor guarantees offerings of third-party speakers, nor is FXCM responsible for the content, veracity or opinions of third-party speakers, presenters or participants.

#DAX - 25 MarDAX moved up but sold down strongly while US indices held up.
Is it really so bearish? IMO, as long as Friday's low hold, could see another move higher. Looking for a move higher from here.

Weekly Technical AnalysisStart your week by identifying the key price levels and trends.
The SpreadEx Research team has analysed the most popular markets, including stocks, indices, commodities & forex.
--------------------------------------------------------------------------------------------------------------
Analysis
Germany 40 retains its bullish trend and impulsive stance, trading near 22,954 just above the 20‐day VWAP of 22,900. An RSI of 54 suggests neutral momentum, which continues to show bearish divergence. If the index slips, 22,375 could serve as near‐term support, while a decisive break above 23,473 may open further upside.
UK 100 has flipped into a neutral/sideways trend, consolidating after the Jan-Feb rally, quoted at 8,659 just below the 20‐day VWAP of 8,681. The RSI at 49 indicates muted momentum. 8,494 marks notable support if selling accelerates; on the upside, a move beyond 8,868 could signal renewed strength.
Wall Street upholds its bearish momentum but a rally of the lows puts it into a correction, currently at 42,310, hovering around the 20‐day VWAP of 42,180. With an RSI of 48, the index isn’t oversold but still faces downside pressure. Key support appears near 40,700, and any rebound may encounter resistance around 43,619.
Brent Crude continues its bearish trajectory in a corrective phase at 7,210, above the 20‐day VWAP of 7,068 but overshadowed by a broader downtrend. The RSI at 52 signals mild momentum. Sellers are eyeing 6,850 support for another leg lower; any bounce could stall at 7,287.
Gold remains firmly bullish and impulsive, hovering at 3,030 just off record highs and well above the 20‐day VWAP of 2,956. An RSI reading of 67 points to strong positive momentum. Should a pullback occur, 2,836 could offer support; otherwise, clearing 3,076 might extend the rally.
EUR/USD holds a bullish and impulsive posture, quoted at 1.0840, holding above the 20‐day VWAP of 1.0720 during a brief consolidation. The RSI at 60 leans constructive, though not overbought. 1.0515 is nearest support, while pushing through 1.1077 opens room for continued gains.
GBP/USD sustains its bullish tone in an impulsive move, trading around 1.2968—clearing the 20‐day VWAP of 1.2840. With the RSI at 63, upside momentum remains intact but off recent overbought levels. The pair’s support sits at 1.2690, and a break above 1.3091 could spark further advances.
USD/JPY stays bearish but has entered a correction, printing 149.55 slightly above its 20‐day VWAP of 149.20. The RSI of 50 indicates neutral momentum. A dip below 146.99 may reinforce the downtrend, whereas moving beyond 150.57 would challenge the current bearish bias.
"GERMANY40" GER40/DAX Indices Market Heist Plan🌟Hi! Hola! Ola! Bonjour! Hallo! Marhaba!🌟
Dear Money Makers & Robbers, 🤑💰🐱👤🐱🏍
Based on 🔥Thief Trading style technical and fundamental analysis🔥, here is our master plan to heist the "GERMANY40" GER40/DAX Indices market. Please adhere to the strategy I've outlined in the chart, which emphasizes long entry and short entry. 🏆💸Book Profits, Be wealthy and safe trade.💪🏆🎉
Entry 📈 :
"The loot's within reach! Wait for the breakout, then grab your share - whether you're a Bullish thief or a Bearish bandit!"
Buy entry above 23000
Sell Entry below 22100
However, I recommended to place buy stop for bullish side and sell stop for bearish side.
📌I strongly advise you to set an alert on your chart so you can see when the breakout entry occurs.
Stop Loss 🛑:
-Thief SL placed at 22600 for Bullish Trade
-Thief SL placed at 22600 for Bearish Trade
Using the 30min period, the recent / swing low or high level.
SL is based on your risk of the trade, lot size and how many multiple orders you have to take.
Target 🎯:
-Bullish Robbers TP 24100 (or) Escape Before the Target
-Bearish Robbers TP 21200 (or) Escape Before the Target
📰🗞️Fundamental, Macro Economics, COT data, Sentimental Outlook:
"GERMANY40" GER40/DAX Indices market is currently experiencing a Neutral trend (there is a higher chance for Bearishness)., driven by several key factors.
🔰Fundamental Analysis
The GER40 index has experienced a moderate decline of 2.5% in February, with the index currently standing at 22,500 points.
Company earnings have been mixed, with some companies exceeding expectations while others have disappointed.
The dividend yield for the GER40 is around 2.5%, which is relatively attractive compared to other major European indices.
🔰Macro Economics
The European Central Bank (ECB) has maintained its hawkish stance, keeping interest rates at 4.25% to combat inflation.
Germany's GDP growth rate is expected to slow down to 1.5% in 2025, due to the ongoing economic uncertainty.
Global trade tensions, particularly between the US and China, continue to impact the German market.
🔰Global Market Analysis
The GER40 is experiencing a bearish trend, with a 0.5% decline in the last 24 hours.
The index is currently trading at 22,500, with a high of 22,600 and a low of 22,400.
🔰COT Data
Speculators (Non-Commercials): 45,011 long positions and 30,015 short positions.
Hedgers (Commercials): 25,019 long positions and 40,011 short positions.
Asset Managers: 30,015 long positions and 20,019 short positions.
🔰Market Sentiment Analysis
The overall sentiment for the GER40 is bearish, with a mix of negative and neutral predictions.
55% of client accounts are short on this market, indicating a bearish sentiment.
🔰Positioning Analysis
The long/short ratio for the GER40 is currently unknown.
The open interest for the GER40 is approximately €10 billion.
🔰Quantitative Analysis
The GER40 has a relatively high volatility, with an average true range (ATR) of 150 points.
The index is currently trading below its 50-day moving average, indicating a bearish trend.
🔰Intermarket Analysis
The GER40 is highly correlated with the Euro Stoxx 50 index, with a correlation coefficient of 0.85.
The index is also highly correlated with the DAX index, with a correlation coefficient of 0.90.
🔰News and Events Analysis
The GER40 has been impacted by the ongoing economic uncertainty in Europe.
The index has also been affected by the decline in German industrial production.
🔰Next Trend Move
Bearish Prediction: Some analysts predict a potential bearish move, targeting 22,000 and 21,800, due to the ongoing economic uncertainty and decline in German industrial production.
Bullish Prediction: Others predict a potential bullish move, targeting 23,000 and 23,200, due to the attractive valuations and potential economic recovery.
🔰Overall Summary Outlook
The overall outlook for the GER40 is bearish, with a mix of negative and neutral predictions.
The market is expected to experience a moderate decline, with some analysts predicting a potential bearish move targeting 22,000 and 21,800.
🔰Real-Time Market Feed
As of the current time, the GER40 is trading at 22,500, with a 0.5% decline in the last 24 hours.
🔰Future Prediction
Short-Term: Bearish: 22,200-22,000, Bullish: 22,800-23,000
Medium-Term: Bearish: 21,800-21,600, Bullish: 23,200-23,400
Long-Term: Bearish: 21,400-21,200, Bullish: 24,000-24,200
📌Keep in mind that these factors can change rapidly, and it's essential to stay up-to-date with market developments and adjust your analysis accordingly.
⚠️Trading Alert : News Releases and Position Management 📰 🗞️ 🚫🚏
As a reminder, news releases can have a significant impact on market prices and volatility. To minimize potential losses and protect your running positions,
we recommend the following:
Avoid taking new trades during news releases
Use trailing stop-loss orders to protect your running positions and lock in profits
💖Supporting our robbery plan 💥Hit the Boost Button💥 will enable us to effortlessly make and steal money 💰💵. Boost the strength of our robbery team. Every day in this market make money with ease by using the Thief Trading Style.🏆💪🤝❤️🎉🚀
I'll see you soon with another heist plan, so stay tuned 🤑🐱👤🤗🤩

DAX WILL GO UP|LONG|
✅DAX is trading in an uptrend
Along the rising support line
Which makes me bullish biased
And the index is about to retest the rising support
Thus, a rebound and a move up is expected
With the target of retesting the level above at 23,200
LONG🚀
✅Like and subscribe to never miss a new idea!✅
Disclosure: I am part of Trade Nation's Influencer program and receive a monthly fee for using their TradingView charts in my analysis.

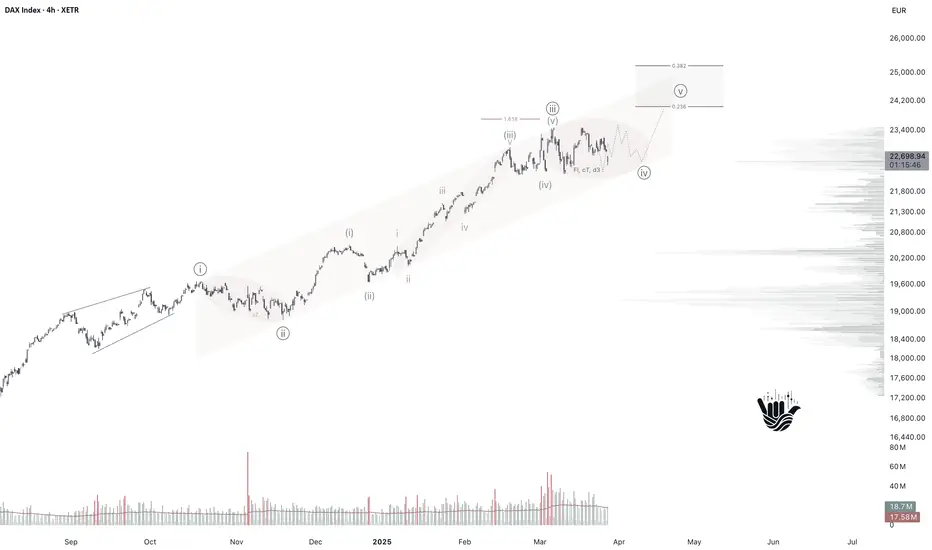
DAX Index: Further Upside Ahead? On the DAX chart, we’re tracking a very large diagonal pattern to the upside, which is likely not yet complete. We are probably in the late stages of circle wave C, within a larger third wave in the yellow scenario.
Upside Targets
Next resistance levels: 24,205 and 25,715 EUR
Support Zone for Wave 4
Support area: 22,512 to 21,610 EUR
This zone would become more relevant if the current rally completes and Wave 4 begins.
On the very small time frame, it’s possible that the internal fourth-wave pullback within circle wave C has already started.
Micro support remains between 22,512 and 21,610 EUR
A break below 22,260 EUR would help confirm that wave 4 is underway
However, one more high is still possible before that pullback begins—this would align with the white scenario, where the current move finishes wave 3 before wave 4 kicks in.

GER30 COMING WEEK'S INTENTIONSPlan ahead always, never compromise your plan because of your feelings, use your mind more, build a new channel of dopamine from your disciplined self, we cant be bad at everything, at least let us dominate them here.

DAX40 The Week Ahead 24th March '25DAX40 bullish & overbought, the key trading level is at 22467
This communication is for informational purposes only and should not be viewed as any form of recommendation as to a particular course of action or as investment advice. It is not intended as an offer or solicitation for the purchase or sale of any financial instrument or as an official confirmation of any transaction. Opinions, estimates and assumptions expressed herein are made as of the date of this communication and are subject to change without notice. This communication has been prepared based upon information, including market prices, data and other information, believed to be reliable; however, Trade Nation does not warrant its completeness or accuracy. All market prices and market data contained in or attached to this communication are indicative and subject to change without notice.

DAX Growth Ahead! Buy!
Hello,Traders!
DAX is going down
And will soon retest the
Rising support and after
The retest we will be
Expecting a bullish rebound
Because we are bullish biased
Buy!
Comment and subscribe to help us grow!
Check out other forecasts below too!
Disclosure: I am part of Trade Nation's Influencer program and receive a monthly fee for using their TradingView charts in my analysis.

GER40 Breakout Setup! 🔥 GER40 Breakout Setup! 🔥
I'm watching this key resistance level on GER40! 📈 A breakout above could trigger a strong bullish move towards my targets.
🔹 Entry: Waiting for confirmation above trendline
🎯 Targets: TP1 - 23,147.95 | TP2 - 23,341.05 | TP3 - 23,493.75
🛑 Stop-Loss: 22,781.45
Risk management is everything! Let’s see how this trade plays out. Would you take this setup? Drop your thoughts below! 👇

German $DAX ($EWG) Topping Out?Originally posted on 3/12, but blocked b/c I referenced my X account. Looks like a bearish move could be materializing alongside broader risk asset weakness:
Is the XETR:DAX topping out? Monthly RSI @ 80+ w/ weekly nosing over and daily bearish divergences observable. Index high from 3/6 coincided with the 261.8% Fibonacci extension of the 11/2021-10/2022 uptrend correction.
Confirmation short setup could materialize $FDAX closes below pivot low of the 1D uptrend (22226), bounces off of short-term demand (ex: 22142-21691, and trades into supply ≥ 22226. This scenario is speculative - the market needs to show its hand.
Presently, DAX is up > 1.5% alongside US stocks, which dipped into intermediate-term demand and benefited from softer-than-expected CPI prints. However, DAX (and domestic) bulls haven't proven anything yet. Unless buyers manage to push the DAX higher - initially above 22900 and secondarily through 23000-23200 - on accelerating momentum, risk remains to the downside (IMO). German stocks have been global relative strength leaders as of late, so if they do correct, other equity indexes may retreat in tandem.
Long-term charts for US indices ( SP:SPX , NASDAQ:NDX , TVC:RUT ) look more bearish vs. bullish (I still have some shorts on), though a near-term recovery is plausible. If domestic equities do trade lower, selling could materialize in Asian and European markets. Use LTF charts to monitor price action/manage risk and splice into shorts if German stocks AMEX:EWG start to crack.
My $0.02. Feedback welcome.
Jon
