Relooking at HSI long term market trend35 years is a long time, twice of it makes a person already in their senior years. Most likely, in their 80-90s (if they still stick around) since most of us do not start investing at age 1.
I was 18 years old had I invested in the stock market, especially HSI. Looking at the chart and the two recent fall out from the bullish trend (on hindsight) , I will still be up 948% had I hold so long , 35 years later .........
Of course, had I been exposed to the US market and equally started investing in 1987, my returns would be 1828% , near double of the HSI returns. WOW. WOW. WOW
Let's not go into the individual stock pick where returns can be in the 5-6 figures like Apple (117056%), 3884% (Macdonald),500% (XAUUSD), 3047% (PG), etc
So you see, investing is not rocket science and you need not spend endless nights analysing stocks and market leaders like some of these companies I mentioned cannot even beat the SPX index, with few exceptions.
In short, I would still invest in both of these two indices, one with solid track record (SPX) and another sorely undervalued and with most negative news out of the way and China shoring up on stimulus programs to prop up the stock markets, it is a matter of time we start to see the index returning to its glorious days again.
Ride the trend while it last........
HK50 trade ideas


Hong Kong shines in search of highsThe Asian indices got off to a strong start today. The Hang Seng Index (Ticker AT: HKIND) has broken out of the long-running downtrend channel in the direction of 9-month old price zones. Stocks returned to 15-month highs today as the Fed cut numbers may help or halt the market's evolution. Today we have as we said releases from the Vice Chairman and the President and CEO of the Cleveland (Ohio) Fed Philip N. Jefferson and the Loretta J. Mester. Beijing has reported a welcome cut in Chinese inflation, helping to undo concerns of prolonged deflation in the markets. The retail and industrial sales forecast put an end to that on Friday. The Chinese government has been able to sell 1 trillion yuan (128.045 billion euros) to maintain its domestic economic stimulus measures. Blue chips felt it the most with 0.1% growth. Even the Asia-Pacific market of the MSCI index grew by 0.1% unlike the Japanese Nikkei which fell by 0.3% due to the interest rate hike implemented by the Bank of Japan.
Looking at the chart, the channel bounced off its January lows and has been building in a slightly bullish sideways movement. On April 18th the figure marked a strong move to the upside which coincides with the FED releases and the expectations that were held, turning the market upside down. Currently the market has touched the 19280 point zone and is looking to pierce the resistance zone indicated in green at 19437.89 points.
If this zone is overcome, nothing will prevent the Chinese market to shine again at highs.
Ion Jauregui - AT Analyst
*******************************************************************************************
The information provided does not constitute investment research. The material has not been prepared in accordance with the legal requirements designed to promote the independence of investment research and such should be considered a marketing communication.
All information has been prepared by ActivTrades ("AT"). The information does not contain a record of AT's prices, or an offer of or solicitation for a transaction in any financial instrument. No representation or warranty is given as to the accuracy or completeness of this information.
Any material provided does not have regard to the specific investment objective and financial situation of any person who may receive it. Past performance is not reliable indicator of future performance. AT provides an execution-only service. Consequently, any person acing on the information provided does so at their own risk.

Surging of the first Uptrend ResistanceBased on the Daily chart, HSI has surged alot since end of April 2024, now we are going to check when is the next resistance, or further resistance.
Based on Fib i drew, until today, it hit R1, which was the support during Aug 2023.
Breaking R1, next resistance will be around 20240, this is a major resistance as it was the peak during Aug 2023, Jun 2023, May 2023. Seeing the RSI is 69.xx today, so expecting if reaching R2 will be exceeding 70, based on previous history, it will U turn and heading down.
HSI is still uptrending, when it retraces, and able to perform 2nd uptrend, this is the time when the bull starts.
So, just my 2 cents. Happy charting.

China Recovery BetFundamentals & Sentiment
HK50:
- China recovery, based on PMI and GDP QoQ
- The latest China Trade Balance printed decently above the previous one (although below consensus)
USD:
Yesterday's cooling US labor market, based on Initial Jobless Claims increase
Technical & Other
*Chose HK50 instead of ChinaA50 because of smoother price action; eventually HK turned out to be stronger because of the dividend tax cuts for individuals who bought HK shares. China A50 seems to be more vulnerable to geopolitics, like China tariffs in the US.
Technical & Other
Setup: TC(B)
Setup timeframe: 4h
Trigger: 1h
Medium-term: Up
Long-term: Uptrend
Target: June-August highs
Risk: 1.2%
Entry: Buy Stop

The Hang Seng Index Has Risen by Over 13% in 2 WeeksThe Hang Seng Index Has Risen by Over 13% in 2 Weeks
Analyzing the Hang Seng (Hong Kong 50 at FXOpen) chart, we wrote on January 30th that the price was near an important support level formed by the lower boundary (shown in orange) of a long-term channel, which has been relevant since 1995.
According to Reuters, Goldman Sachs representatives noted in a client note that hedge funds were actively buying Chinese stocks – the period from January 23 to 25 saw the largest capital inflow in 5 years.
As of the beginning of May, price action suggests that hedge fund purchases are justifiable – with the Hang Seng 50 (Hong Kong 50 at FXOpen) index rising by over 13% in the past two weeks.
This was partly driven by:
Economic stimulus from Beijing.
The Hong Kong Monetary Authority's (HKMA) decision to keep the base rate unchanged at 5.75%. As reported by the South China Morning Post, HKMA's decisions correlate with the Federal Reserve's policy since 1983, reflecting the local currency's peg to the US dollar.
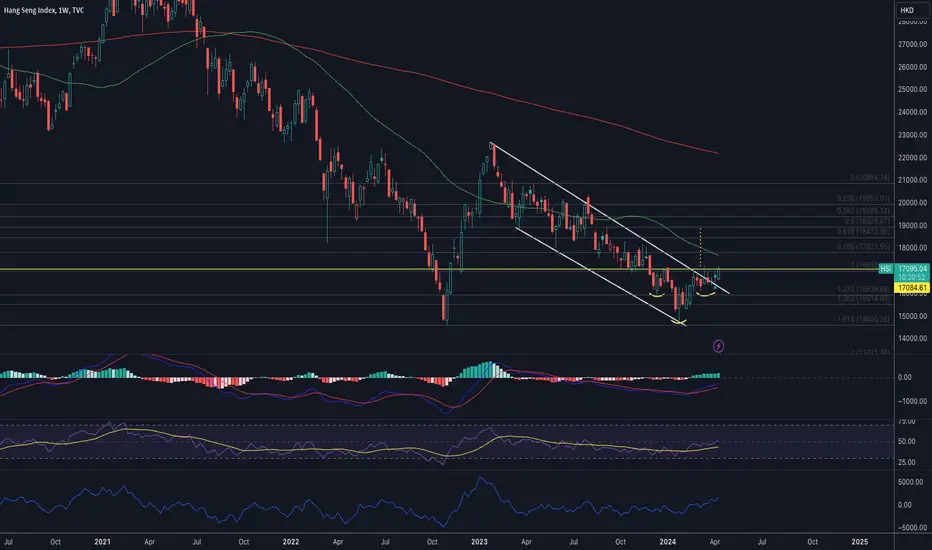
Technical analysis of the Hang Seng (Hong Kong 50 at FXOpen) weekly chart shows signs of bullish strength:
The HSI price (Hong Kong 50 at FXOpen) remains within the orange long-term channel. After fluctuations in January 2024 around the psychological level of 16,000 points, the price stabilized above this level.
In mid-April, bears attempted to breach the psychological level of 16,000 points but failed.
The last two closed candles on the chart were bullish, with wide bodies closing near the highs – indicating demand dominance.
If bulls maintain control, the HSI price (Hong Kong 50 at FXOpen) could break above the upper boundary of the descending channel (shown in red) and open up prospects for a significant rally.
Trade global index CFDs with zero commission and tight spreads. Open your FXOpen account now or learn more about trading index CFDs with FXOpen.
CFDs are complex instruments and come with a high risk of losing your money.
This article represents the opinion of the Companies operating under the FXOpen brand only. It is not to be construed as an offer, solicitation, or recommendation with respect to products and services provided by the Companies operating under the FXOpen brand, nor is it to be considered financial advice.

The Hang Seng Index Has Risen by Over 13% in 2 WeeksThe Hang Seng Index Has Risen by Over 13% in 2 Weeks
Analyzing the Hang Seng (Hong Kong 50 at FXOpen) chart, we wrote on January 30th that the price was near an important support level formed by the lower boundary (shown in orange) of a long-term channel, which has been relevant since 1995.
According to Reuters, Goldman Sachs representatives noted in a client note that hedge funds were actively buying Chinese stocks – the period from January 23 to 25 saw the largest capital inflow in 5 years.
As of the beginning of May, price action suggests that hedge fund purchases are justifiable – with the Hang Seng 50 (Hong Kong 50 at FXOpen) index rising by over 13% in the past two weeks.
This was partly driven by:
Economic stimulus from Beijing.
The Hong Kong Monetary Authority's (HKMA) decision to keep the base rate unchanged at 5.75%. As reported by the South China Morning Post, HKMA's decisions correlate with the Federal Reserve's policy since 1983, reflecting the local currency's peg to the US dollar.
Technical analysis of the Hang Seng (Hong Kong 50 at FXOpen) weekly chart shows signs of bullish strength:
The HSI price (Hong Kong 50 at FXOpen) remains within the orange long-term channel. After fluctuations in January 2024 around the psychological level of 16,000 points, the price stabilized above this level.
In mid-April, bears attempted to breach the psychological level of 16,000 points but failed.
The last two closed candles on the chart were bullish, with wide bodies closing near the highs – indicating demand dominance.
If bulls maintain control, the HSI price (Hong Kong 50 at FXOpen) could break above the upper boundary of the descending channel (shown in red) and open up prospects for a significant rally.
Trade global index CFDs with zero commission and tight spreads. Open your FXOpen account now or learn more about trading index CFDs with FXOpen.
CFDs are complex instruments and come with a high risk of losing your money.
This article represents the opinion of the Companies operating under the FXOpen brand only. It is not to be construed as an offer, solicitation, or recommendation with respect to products and services provided by the Companies operating under the FXOpen brand, nor is it to be considered financial advice.

Hong Kong Market has bottomed in Jan 2024Based on the above daily chart, I am making a bold prediction that the HSI has bottomed in Jan 2024. We can see clearly the breakout from the daily chart. What's important is the support level at 16,194, a critical support level that must be maintained !
I will be slowly accumulating this index . Also, watching banks stocks and some tech stocks as well.
Please DYODD.

ICT Long setup HK50, scalpingOur AI system detected that there is an ICT short setup in HK50 for scalping,
Please refer to the details Stop loss, Supply Zone(Sell Zone), TP 1 and TP2 for take profit.
For more ideas, you are welcome to visit our profile in tradingview.
Have a good day!
Please give this post a like if you like this kind of simple idea, your feedback will bring our signal to next better level, thanks for support!


That breakout from the bull flag is coming in HOT. 🔥 $HSI That breakout from the bull flag is coming in HOT. 🔥 TVC:HSI
Bullish sentiment is heating up in the Hang Seng Index.
The confirmed breakout can push prices to our target mapped out in the charts

$HSI - Could be breaking out!TVC:HSI $17,000 has been a big resistance. It is on the verge of breaking out. Once it move above 200 DMA, it could head to 18,500.
NYSE:BABA AMEX:KWEB 👀

Waiting for Breakout, time to Up Up Up.Based on my previous monthly chart, the trend has bottom at the hidden lines, and now switching to weekly chart, the trends has hit upper resistance.
It may be a breakout for HSI to pursue further uptrend if it can maintain above the resistance line.
If referring to Daily chart, the price is almost hit MA200, further up will test resistance at 18100.

Weekly Analysis - HK50Since March 5, HK50 has been ranging between 16122 to 17101. This is mostly due to the lower volume of trade. Last week it looked like we might finally see a break thru between range; however, it still failed to close below 16122 level.
This week, overall, I am bearish for HK50. However, watch out for the first day of spike up to grab more liquidity. Once the 4h candle starts to close below 16122 level, I will comfortable to enter sell, TP can be roughly 15700 level.
As for buy, it might be little bit tough as we are now forming a lower low low high pattern. Thus, I will need more confirmation before I can enter a buy.

A Han Seng Index Trade Early Monday morning Hello everyone,
The markets are slightly ruffled lately and there is an opportunity to short HS50 on Monday.
Trend:
W1: Up
D1: Down
H4: Down
Moving Average:
Below the Daily MA
H4 pointing downwards
Pattern:
Gartley on M15
Strong resistance at 16450.
Target is 16000
Double top on H1 and lots of divergence
Stop loss of 40 pips and a target of 120.

Apr 17: Uptrend still intactWe are at a decisive point here as the drop has been at an important support. If it continues to break, we will continue with the downtrend. But the uptrend scenario is still the preferred one: with the leading diagonal and a 3-wave correction. If the bullish scenario is correct, we should have a strong bounce from here. Once it breaks above the resistance, we can confirm the bottom is in.

Big Shortdepending on market structure the price is broken the important levels on 4H TimeFrame, when the correction occurring at level 16744 will put a position at level 16621 and the first target at 16320 with suitable stop loss level.

PERFECT Sell opportunity for HK50 - High Reward Low RiskHere is a perfect SELL opportunity for the HK50... You can see the market has not broken pass the trend line to the upside for over ONE YEAR!
The other support trend line has been broken which indicates that the market will continue to head towards the downside...
The current price also rebounded off the 61.8 fibonacci level which is a huge sign that the HK50 will head downwards!

$HSI - It might finally breakout!TVC:HSI Looking like it will finally break above $17000 on weekly close and make a run to $19,000.
Watch NYSE:BABA $KWEB. Both of them are at the critical pivot area.
China's inflation data Yesterday was not good, but the index shrugged it off. It is a sign that the market might be thinking China has bottomed.
HK33 remains mixed and volatile.HK33HKD - 24h expiration
Intraday dips continue to attract buyers and there is no clear indication that this sequence for trading is coming to an end.
Trend line support is located at 16530.
Preferred trade is to buy on dips.
Trading within a Corrective Channel formation.
Risk/Reward would be poor to call a buy from current levels.
50 4hour EMA is at 16720.
We look to Buy at 16700 (stop at 16540)
Our profit targets will be 17100 and 17180
Resistance: 17000 / 17054 / 17150
Support: 16800 / 16700 / 16600
Risk Disclaimer
The trade ideas beyond this page are for informational purposes only and do not constitute investment advice or a solicitation to trade. This information is provided by Signal Centre, a third-party unaffiliated with OANDA, and is intended for general circulation only. OANDA does not guarantee the accuracy of this information and assumes no responsibilities for the information provided by the third party. The information does not take into account the specific investment objectives, financial situation, or particular needs of any particular person. You should take into account your specific investment objectives, financial situation, and particular needs before making a commitment to trade, including seeking advice from an independent financial adviser regarding the suitability of the investment, under a separate engagement, as you deem fit.
You accept that you assume all risks in independently viewing the contents and selecting a chosen strategy.
Where the research is distributed in Singapore to a person who is not an Accredited Investor, Expert Investor or an Institutional Investor, Oanda Asia Pacific Pte Ltd (“OAP“) accepts legal responsibility for the contents of the report to such persons only to the extent required by law. Singapore customers should contact OAP at 6579 8289 for matters arising from, or in connection with, the information/research distributed.

Weekly Analysis - HK50This week has been a really slow with no clear direction. It closes with a doji candle.
For this week trade idea, It will be roughly the same as last week. Buy above 17101 and sell below 16127. If you want a more aggressive buy, depends how the first 4 hr candle closes, buy above 16906 is also a choice.

Tell your hedge fund to buy HSITell your hedge fund to buy Hang Seng Index and some Chinese stocks. Good returns will be coming in next years.
