HSI Potential for Bullish Continuation towards recent highLooking at the H4 chart, my overall bias for HSI is bullish due to the current price being above the Ichimoku cloud, indicating a bullish market.
Looking for a pullback buy entry at 19926.48, where the overlap support and 78.6% Fibonacci line is. Stop loss will be at 18660.47, where the overlap resistance and 23.7% Fibonacci line is. Take profit will be at 22700.85, where the recent high is.
Please be advised that the information presented on TradingView is provided to Vantage (‘Vantage Global Limited’, ‘we’) by a third-party provider (‘Everest Fortune Group’). Please be reminded that you are solely responsible for the trading decisions on your account. There is a very high degree of risk involved in trading. Any information and/or content is intended entirely for research, educational and informational purposes only and does not constitute investment or consultation advice or investment strategy. The information is not tailored to the investment needs of any specific person and therefore does not involve a consideration of any of the investment objectives, financial situation or needs of any viewer that may receive it. Kindly also note that past performance is not a reliable indicator of future results. Actual results may differ materially from those anticipated in forward-looking or past performance statements. We assume no liability as to the accuracy or completeness of any of the information and/or content provided herein and the Company cannot be held responsible for any omission, mistake nor for any loss or damage including without limitation to any loss of profit which may arise from reliance on any information supplied by Everest Fortune Group.
HK50 trade ideas

HKEX to see early pessimism?HS50 - 24h expiry - We look to Buy at 20900 (stop at 20670)
Although the bears are in control, the stalling negative momentum indicates a turnaround is possible.
A higher correction is expected.
The hourly chart technicals suggests further downside before the uptrend returns.
We look to buy dips.
Although the anticipated move higher is corrective, it does offer ample risk/reward today.
Our profit targets will be 21555 and 22590
Resistance: 22590 / 24770 / 27550
Support: 20875 / 19525 / 18580
Please be advised that the information presented on TradingView is provided to Vantage (‘Vantage Global Limited’, ‘we’) by a third-party provider (‘Signal Centre’). Please be reminded that you are solely responsible for the trading decisions on your account. There is a very high degree of risk involved in trading. Any information and/or content is intended entirely for research, educational and informational purposes only and does not constitute investment or consultation advice or investment strategy. The information is not tailored to the investment needs of any specific person and therefore does not involve a consideration of any of the investment objectives, financial situation or needs of any viewer that may receive it. Kindly also note that past performance is not a reliable indicator of future results. Actual results may differ materially from those anticipated in forward-looking or past performance statements. We assume no liability as to the accuracy or completeness of any of the information and/or content provided herein and the Company cannot be held responsible for any omission, mistake nor for any loss or damage including without limitation to any loss of profit which may arise from reliance on any information supplied by Signal Centre.

Trading and Investing in HSI Followers of mine know that I am pretty bullish on HK/China stocks , ETF since last year and I have been slowly accumulating once there is a pull back.
Yesterday, FED's decision to raise rates by 25 basis points go well with the market and the stock market reciprocate in kind ! I believe the Hong Kong market will follow this rally as well in addition to the booming tourists coming from China and also the exports business of China !!!
HKEX close to find support after mild selloff.HS50 - 24h expiry - We look to Buy at 21810 (stop at 21635)
We are trading at oversold extremes.
Price action looks to be forming a bottom.
This is positive for sentiment and the uptrend has potential to return.
Preferred trade is to buy on dips.
Our profit targets will be 22265 and 22590
Resistance: 22590 / 24770 / 27550
Support: 20870 / 19525 / 18580
Please be advised that the information presented on TradingView is provided to Vantage (‘Vantage Global Limited’, ‘we’) by a third-party provider (‘Signal Centre’). Please be reminded that you are solely responsible for the trading decisions on your account. There is a very high degree of risk involved in trading. Any information and/or content is intended entirely for research, educational and informational purposes only and does not constitute investment or consultation advice or investment strategy. The information is not tailored to the investment needs of any specific person and therefore does not involve a consideration of any of the investment objectives, financial situation or needs of any viewer that may receive it. Kindly also note that past performance is not a reliable indicator of future results. Actual results may differ materially from those anticipated in forward-looking or past performance statements. We assume no liability as to the accuracy or completeness of any of the information and/or content provided herein and the Company cannot be held responsible for any omission, mistake nor for any loss or damage including without limitation to any loss of profit which may arise from reliance on any information supplied by Signal Centre.

Would this news drive up the Hong Kong Stock Market ?Read article here
After reading , it looks promising that HK has a lot of opportunities moving forward. What's important is how fast can these measures be implemented as we continue to witness outflow of talents out of the country.
CONFIDENCE is the key in stock market investing/trading. If people on the ground lack confidence, they will not put their money in the stock market as they are uncertain of many things- jobs, taxes, standard of living, government regulations, etc. People need to feel safe and assured , that's basic.
HSI has dropped more than 50% from its peak and is trading at an attractive level with many good fundamental companies at attractive prices. Those who have done their research will be able to pick up gems at this stage and ride the turbulence through the next few years.

CCP Bears And Bulls?It looks like the HSI will form a very large inverse head and shoulders, bearish then very bullish :)

HK50 - Major Downtrendline Rejection?HSI has been rallying significantly , and currently testing resistance.
Trendline & Fibo 0.5 confluence , with daily closing bearish engulfing.
Potential short opportunity towards 20.8K area
TVC:HSI
PEPPERSTONE:HK50
OANDA:HK33HKD
HKEX:HSI1!


Hang Seng - ChinaMajor resistance in another China ETF....Tagging Multi year Pivots going all the way back to 2011.

ICHIMOKU WEATHER REPORT WEEKLY FORECAST OF HANG SENG 50This is an update of my forecast of the Hang Seng Index using the Ichimoku Kinko Hyo Indicator. HSI:HSI

HSI and WTZ2Happy Chinese New Year. Hangseng Index has given us the present with index rally since the end of last year. Actually, I apply Dollar Cost Average strategy together with TD Sequential tool for price average entry during Q4 of last year. The average cost is such competitive and suit for long term foreign investment. Anyway, in the term of trading strategy, I apply WTZ2, one of my favorite setup, for short term speculative profits. Small risks are applied at below Tunnel. Good Luck!

HKEX dips continue to attract.HS50 - 24h expiry - We look to Buy at 21405 (stop at 21180)
Although the bulls are in control, the stalling positive momentum indicates a turnaround is possible.
A lower correction is expected.
The medium term bias remains bullish.
We therefore, prefer to fade into the dip with a tight stop in anticipation of a move back higher.
Our profit targets will be 22040 and 22145
Resistance: 22590 / 24770 / 27550
Support: 20875 / 19525 / 18580
Risk Disclaimer
The trade ideas beyond this page are for informational purposes only and do not constitute investment advice or a solicitation to trade. This information is provided by Signal Centre, a third-party unaffiliated with OANDA, and is intended for general circulation only. OANDA does not guarantee the accuracy of this information and assumes no responsibilities for the information provided by the third party. The information does not take into account the specific investment objectives, financial situation, or particular needs of any particular person. You should take into account your specific investment objectives, financial situation, and particular needs before making a commitment to trade, including seeking advice from an independent financial adviser regarding the suitability of the investment, under a separate engagement, as you deem fit.
You accept that you assume all risks in independently viewing the contents and selecting a chosen strategy.
Where the research is distributed in Singapore to a person who is not an Accredited Investor, Expert Investor or an Institutional Investor, Oanda Asia Pacific Pte Ltd (“OAP“) accepts legal responsibility for the contents of the report to such persons only to the extent required by law. Singapore customers should contact OAP at 6579 8289 for matters arising from, or in connection with, the information/research distributed.

Hangseng Index Rallying in Nesting Impulse Elliott Wave StructurCycle from 10.31.2022 low in Hangseng Index is in progress as a nesting 5 waves impulsive Elliott Wave structure. Up from 10.31.2022 low, wave ((1)) ended at 18414.09. The 45 minutes chart below shows pullback in wave ((2)) ended at 16833.68. Wave ((3)) is currently in progress as another impulse in lesser degree. Up from wave ((2)), wave ((i)) ended at 19237.45 and dips in wave ((ii)) ended at 18530.82. Wave ((iii)) ended at 19737.31, pullback in wave ((iv)) ended at 18799.81 and final leg wave ((v)) ended at 19926.48. This completed wave 1 in higher degree.
Wave 2 pullback ended at 18878.64 with internal subdivision as a zigzag structure. Down from wave 1, wave ((a)) ended at 19130.53, rally in wave ((b)) ended at 19786.29 and wave ((c)) lower ended at 18878.64. This completed wave 2 in higher degree. The Index has resumed higher in wave 3. Up from wave 2, wave ((i)) ended at 20098.23 and pullback in wave ((ii)) ended at 19303.73. Index then extended higher in wave ((iii)) towards 21396.09, and pullback in wave ((iv)) ended at 20862.77. Expect Index to end wave ((v)) of 3 soon, then it should pullback in wave 4 to correct cycle from 12.20.2022 low before the rally resumes. Near term, as far as pivot at 18878.64 low stays intact, expect pullback to find support in 3, 7, 11 swing for more upside.

ICHIMOKU WEATHER REPORT: Forecast of Hang Seng 50I am forecasting the probable direction in price of the Hang Seng 50 using the Ichimoku Kinko Hyo Indicator. HSI:HSI

entanglement and wavesHSI weekly chart level wave count, currently in the first white wave, wait steadily for the second white wave to step back and end and go long.

Hange Seng index still heading on up to 24,637!Large C&H has formed since the break up and out of it's recent medium downtrend.
Price is also above the 200SMA (Which explains the Green background)
This means, an uptrend is confirmed,
7>21 >200SMA
RSI >50 >75
Target 24,637
Bullish

HK50 Sell Setup , Sold at 21639HK50 Sell Setup
Currently 21642
Sold at 21639
(Trading plan If HK50 go up to 21900 we will add more sell)
Expecting target 21320
Incase of early exist will update this anaylsis
Its not a Financial Advice

HSI Potential for Bullish Continuation Looking at the H4 chart, my overall bias for HSI is bullish due to the current price being above the Ichimoku cloud, indicating a bullish market. Looking for a pullback buy entry at 19926.48, where the 61.8% Fibonacci line is. Stop loss will be at 18814.83, where the 23.6% Fibonacci line is. Take profit will be at 22523.64, where the previous swing high and liquidity hotspots are.
Please be advised that the information presented on TradingView is provided to Vantage (‘Vantage Global Limited’, ‘we’) by a third-party provider (‘Everest Fortune Group’). Please be reminded that you are solely responsible for the trading decisions on your account. There is a very high degree of risk involved in trading. Any information and/or content is intended entirely for research, educational and informational purposes only and does not constitute investment or consultation advice or investment strategy. The information is not tailored to the investment needs of any specific person and therefore does not involve a consideration of any of the investment objectives, financial situation or needs of any viewer that may receive it. Kindly also note that past performance is not a reliable indicator of future results. Actual results may differ materially from those anticipated in forward-looking or past performance statements. We assume no liability as to the accuracy or completeness of any of the information and/or content provided herein and the Company cannot be held responsible for any omission, mistake nor for any loss or damage including without limitation to any loss of profit which may arise from reliance on any information supplied by Everest Fortune Group.

HK / HSI ?
Multi month bullish run.
Can make a big reversal IF
you set you criterias
It's a double top or breaks the lower trendline.
For now . it respects the upper trendline. Suspicious of this activity.
Gotta go to ground level for market sentiments there.
All the best

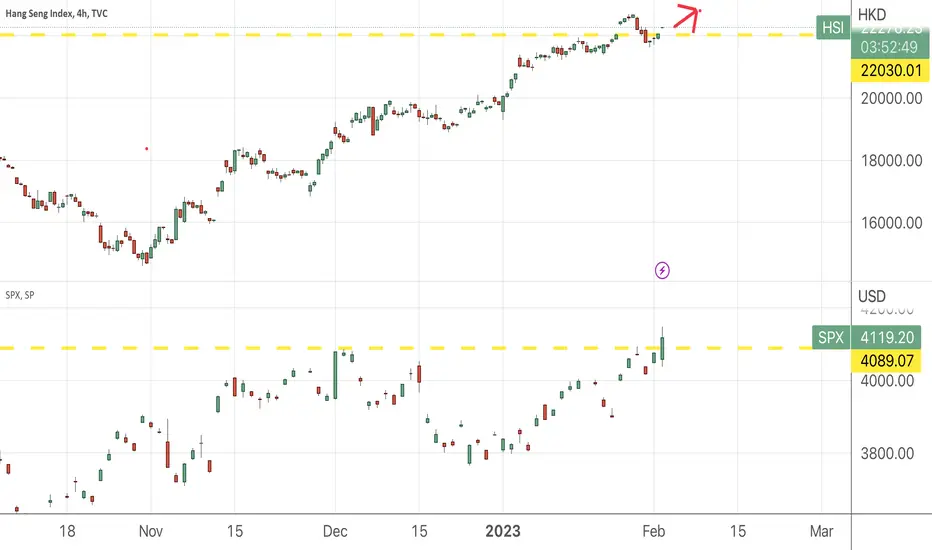
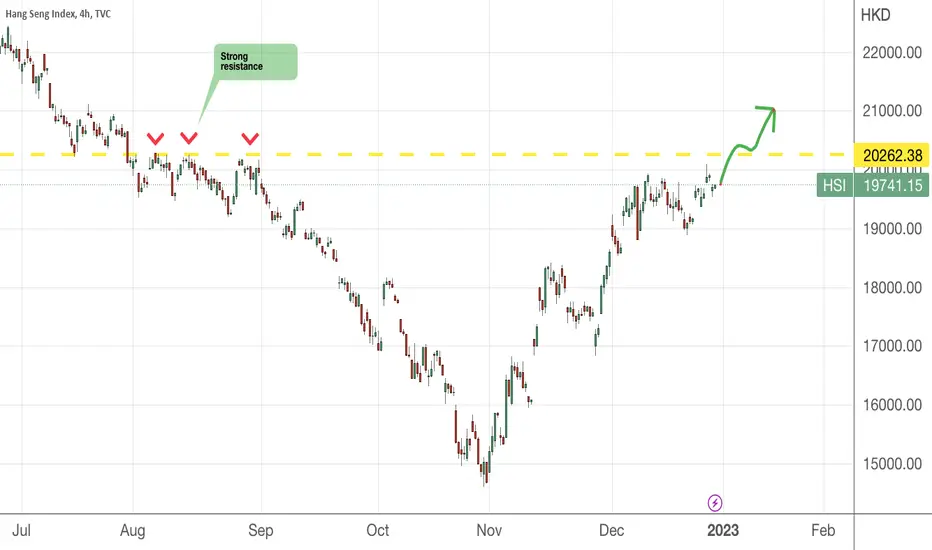
HSI to break out of resistance zoneIf history does repeats itself, then I expect HSI today, in the last trading day of 2022 will emulate the good performance of US indices last night.
On the 4H chart, we can see several price point being rejected at the yellow dotted line, priced at 20,262. It is my hope that HSI closed today above this level and towards the first month of 2023, it will ride higher towards the festive season rally.
ICHIMOKU WEATHER REPORT DAILY FORECAST OF HANG SENG 50Daily forecast of the Hang Seng Index using the Ichimoku Kinko Hyo Indicator
