IBEX35decision coming this quarter if ibex can close above 9381 we can look for further upside till 10.000-10.200-10600.
If we reject this coming week in this level we have support around 8810 but will make more sense take all the liquidity below the swimg lows marked with X.
decision para este trimestre en la bolsa española , si el ibex consigue cerrar arriba de 9381 podriamos mirar una rotura con potencial hasta los 10.000 - 10200 y 10600 como swimgtrade y zona de cojer profit.
en caso de rejeccionar esta semana en este nivel , tendriamos un soporte en 8800 pero seria mas tentadora el corto como swimgtrade e ir cojiendo toda la liquidity debajo de los swimg lows que he marcado con una X
att : m0byy
SPA35 trade ideas

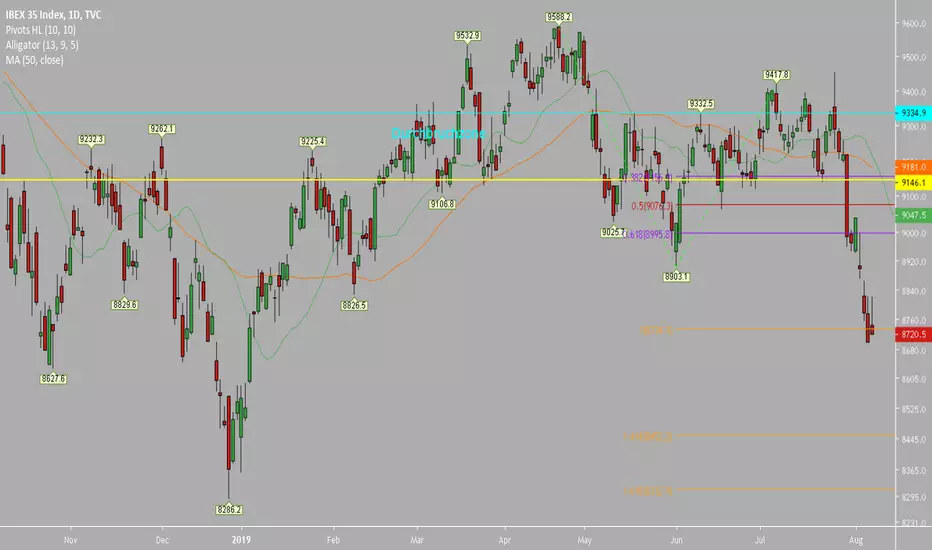
Dios mio, nooo es bueno (ESP35)Hello Traders, here is a nice 0.618 entry for ESP35 short.
Good luck.

Elliott Wave View: IBEX Ended Impulsive RallyShort term Elliott Wave view on IBEX calls the rally from August 15, 2019 low (8405.39) as a 5 waves impulse Elliott Wave structure. Up from 8405.3, wave ((i)) ended at 8806.4 and wave ((ii)) pullback ended at 8592.70. Index then resumed higher in wave ((iii)) towards 9123.9, wave ((iv)) pullback ended at 8964, and wave ((v)) ended at 9208.90. As the chart below shows, the internal of wave ((i)), ((iii)) and ((v)) also show 5 waves impulsive structure in lesser degree. This illustrates the fractal nature of Elliott Wave Principle.
The 5 waves move from 8405.39 ended wave 1 in larger degree. Index should now pullback in wave 2 to correct cycle from August 15, 2019 low before the rally resumes. Pullback should find buyers in the sequence of 3, 7, or 11 swing for further upside as far as pivot at 8405.39 low stays intact.

Spanish IBEX Head and ShouldersAlready outlined on how central banks will HAVE to keep stocks propped up. This is due to pensions and also the fact that central banks have forced money into stocks as yields were suppressed. A decade ago, you could retire with 1,000,000 and buy government bonds yielding 6-8% making 60,000-80,000 a year...enough to live off of in retirement. Now a days, you would make less than 30,000. In fact, bonds are now being used to trade rather than for yields!
Pensions funds are heavy in bonds and fixed income. They are not making the 8% required per year. In Canada, or pension funds have had to go into stocks and real estate. American social security is still 100% in fixed income...
Now, in some places, even real estate cannot be purchased for 1,000,000 meaning stocks are the only place to go for yield! There is nowhere else to go. Plus, stocks can be liquidated quickly which is important in this environment.
Expect central banks to prop stocks up because they have to in order to keep system propped up. Yes, a geopolitical situation can change this. Watch China for this. But you need to remember, central banks will keep stocks up. Cutting rates means you can only go to stocks for yield. Stimulus will also be reintroduced (very soon imo) but cannot be called QE. When stimulus comes back online there will be a CONFIDENCE CRISIS as people realize we are in 0 rates and fake/managed markets for life.
Check my other posts on these topics.

Ibex doing a flat, long looks so nice.As tittle said looks like ibex is doing a flat wave, so there is a nice risk/profit ratio. The channel and 10.000 should be a big resistance (I expect there a big wave short)


Daily Spain IBEX stock market index forecast analysis22-Jul
Price trend forecast timing analysis based on pretiming algorithm of Supply-Demand(S&D) strength.
Investing position: In Falling section of high risk & low profit
S&D strength Trend: In the midst of a downward trend of strong downward momentum price flow marked by temporary rises and strong falls.
Today's S&D strength Flow: Supply-Demand(S&D) strength flow appropriate to the current trend.
View forecasts shape of candlestick 10 days in the future: www.pretiming.com
Forecast D+1 Candlestick Color : RED Candlestick
%D+1 Range forecast: 0.3% (HIGH) ~ -0.5% (LOW), -0.1% (CLOSE)
%AVG in case of rising: 0.8% (HIGH) ~ -0.3% (LOW), 0.6% (CLOSE)
%AVG in case of falling: 0.4% (HIGH) ~ -0.8% (LOW), -0.5% (CLOSE)

Ibex on way to 8800/8700Ibex is fragile right now, shorts have a nice chance at this area.
Objetive 8800/8700 (61% of the wave).

IBEX35 (IBC) ESPAÑA / SPAIN - DOS TRIANGULOS / TWO TRIANGLESDos triángulos simétricos (de largo y corto plazo) a punto de llegar al APEX. Posible ruptura al alza o a la baja. Vigilar.
Two simetric triangles (short and long term) on the verge of reaching the APEX. Possible breakout or breakdown. Watch out.


Daily Spain IBEX stock market index forecast timing analysis27-Jun
Price Forecast timing analysis by pretiming algorithm of Supply-Demand strength
Investing position about Supply-Demand(S&D) strength: In Falling section of high risk & low profit
Supply-Demand(S&D) strength Trend Analysis: About to begin a rebounding trend as a downward trend gradually gives way to slowdown in falling and rises fluctuations
Today's S&D strength Flow: Supply-Demand(S&D) strength flow appropriate to the current trend.
read more: www.pretiming.com
D+1 Candlestick Color forecast: GREEN Candlestick
%D+1 Range forecast: 0.2% (HIGH) ~ 0.0% (LOW), 0.4% (CLOSE)
%AVG in case of rising: 0.9% (HIGH) ~ -0.3% (LOW), 0.6% (CLOSE)
%AVG in case of falling: 0.4% (HIGH) ~ -0.8% (LOW), -0.5% (CLOSE)
Price Forecast timing is analyzed based on pretiming algorithm of Supply-Demand(S&D) strength.

Ibex 35 abandoning bullish channel from 01/01/2019Trade war tensions made the markets tumble this Wednesday. Ibex 35, which is gaining volume (Cumulative Volume Indicator CVI was used) every week, has abandoned bullish channel started at the beginning of 2019 and continues its downward trend started back in May 2017. From a long term point of view, the end of this week will be critical to establish a correct position on it, either bullish if it gets back in the bullish channel or bearish, if it gets further away. One thing is for sure, from a short-term point of view the "Sell in May" prophecy period is also ending this week as May ends and the index could experience a bullish reversal the first days of June that won't last for long. All in all, long-term is bearish and short-term might come with some volatility surprises.


Confirmed New LowThe new lows below 9475.5 have been passed down. This confirms the running downtrend.
