IBEX35 SPAIN INDEXHello all !
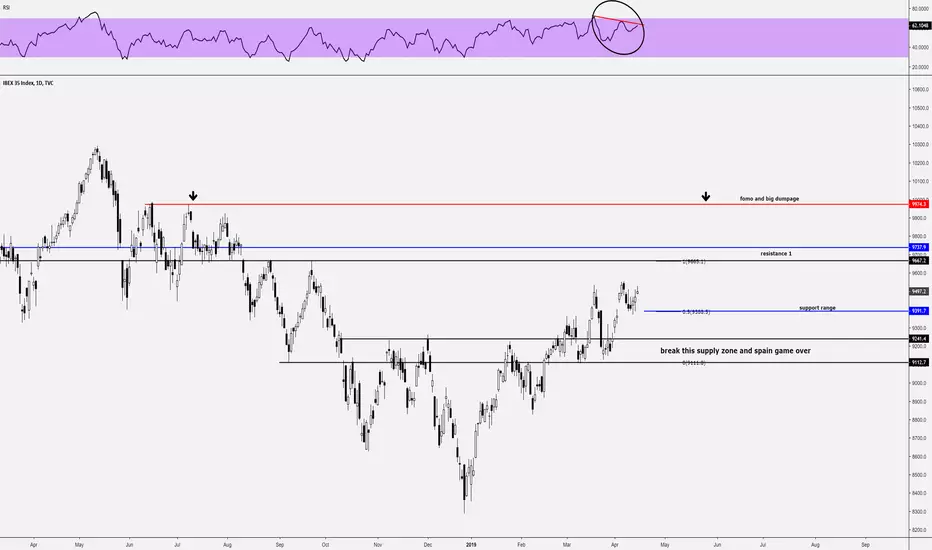
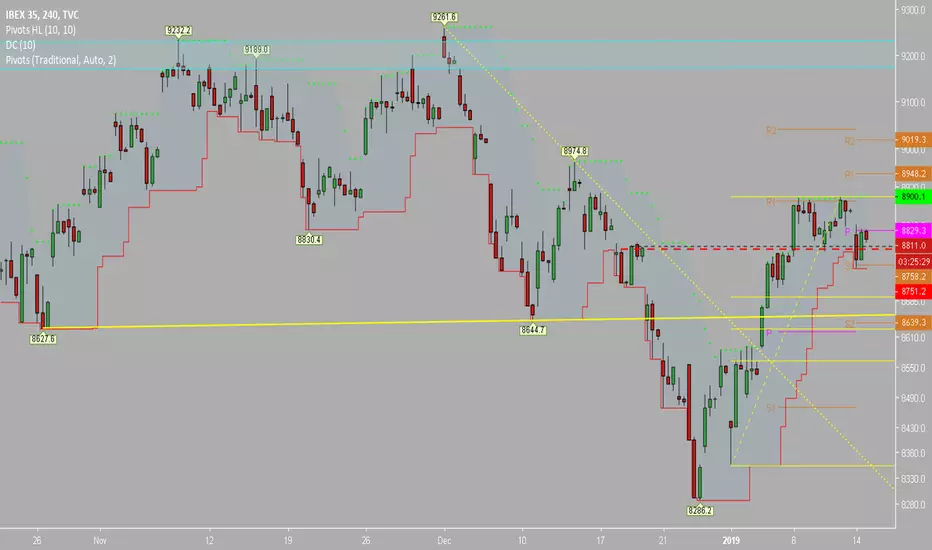
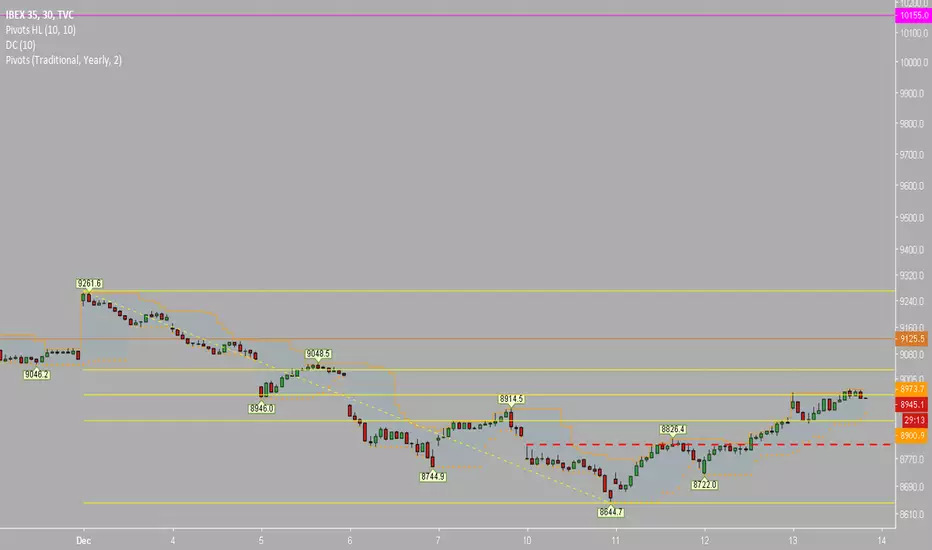
been charting this index for a few weeks months... actually is forming a range still in clear downtrend.
lvls support and resistances in the chart
actually forming a bear divi with rsi :)
SPA35 trade ideas
Ibex35 y la deceleración de la economía europea"El Ibex 35 cierra la sesión con una leve subida del 0,23% hasta los 9.363,5 puntos tras el jarro de agua fría que el Fondo Monetario Internacional ha vertido sobre los mercados al dejar caer que rebajará su previsión de crecimiento global."
La pegunta es cuánto tiempo podrá seguir flotando hasta empezar la caida. Ultima esperanza para seguir subiendo es recibir noticias positivas, algo complicado de conseguir cuando la mayoria de los indicadores macroeconómicos estan por debajo de los esperados.

Ibex 35 Bearish reversal - shooting starMás claro, chorizo pamplona.
The shooting star is a bearish reversal pattern that looks identical to the inverted hammer but occurs when price has been rising.
Its shape indicates that the price opened at its low, rallied, but pulled back to the bottom.
This means that buyers attempted to push the price up, but sellers came in and overpowered them. This is a definite bearish sign since there are no more buyers left because they’ve all been murdered.

Strong SupportWe have reached a support that is lasting since November already. I consider the sharp decline in the past hours an exhausting one.

Elliott Wave View: IBEX Shows Bullish StructureIBEX Elliott Wave sequence from 12.28.2018 low remains bullish , favoring further upside. Near term, the rally from Feb 11, 2019 low (8834.3) is unfolding as a zigzag Elliott Wave structure. The first leg of this zigzag wave A ended at 9361.4 as a 5 waves impulse structure. Wave B pullback ended at 9106.97 as a Flat Elliott Wave structure. Down from 9361.4, wave ((a)) ended at 9204.4, wave ((b)) ended at 9366.2, and wave ((c)) of B ended at 9106.97.
The index has resumed wave C rally higher and broken above previous peak on 9366.2. The internal of wave C is also unfolding as a 5 waves impulse where wave ((i)) ended at 9212.3 and wave ((ii)) at 9123.5 low. Above from there it is suggesting that it is still within black wave (( iii )). Anyway, near term, while pullback stays above 9106.45, expect Index to extend higher. We don’t like selling the Index and expect buyers to appear in 3, 7, or 11 swing as far as pivot at 9106.97 stays intact. Potential target to the upside comes at 9652 – 9771 area where wave C is equal to wave A in length.


IBEX exposed after ECBHere we have a very important flow forming after a soft ECB via revised forecasts for growth, inflation and TLTRO's.
We have reached heavy resistance at 9,280 and a global slowdown will be enough to seriously damage the downside. From a technical perspective this would also satisfy the ABC from the 2015 highs.
On the FX side, please find attached the flow for EURUSD towards 1.09.
Best of luck all those in Spanish Equities.


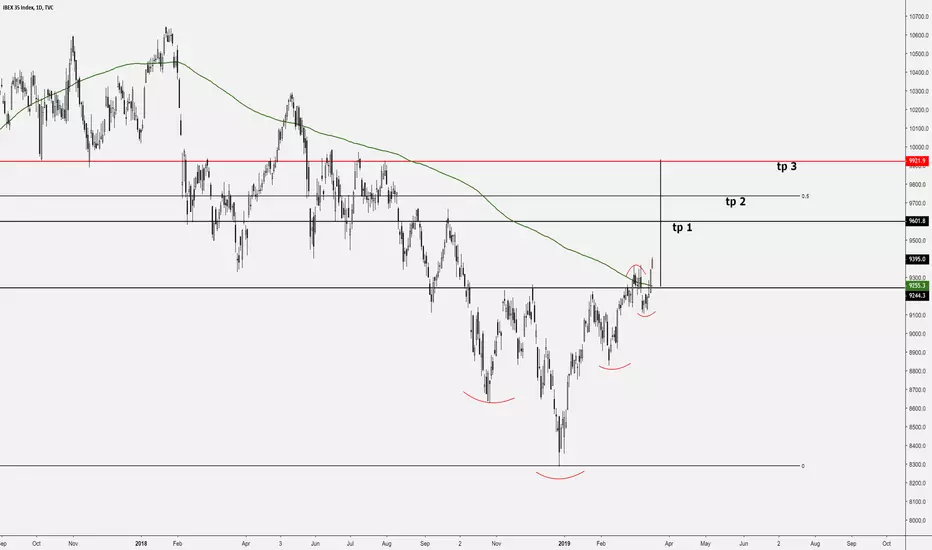
Turning PointHaving reached the long target I am turning the position expecting a correction within the trend.

IBEX SIN SUPERAR ANTIGUA NECKLINETras la activación del HCH, el precio bajó hasta cerrar Gap, allí subió hasta la neckline y activó pullback. Ahora el precio se encuentra subiendo, probablemente hasta la SMA 200 sin que supere, a precios de cierre el Nivel 61.8% de Retrocesos de Fibonacci.
Más información y detallada sólo para los suscritos a nuestro Grupo de Trabajo: Premium.
Escríbenos a da.globalinvestments.info@gmail.com y suscríbete.

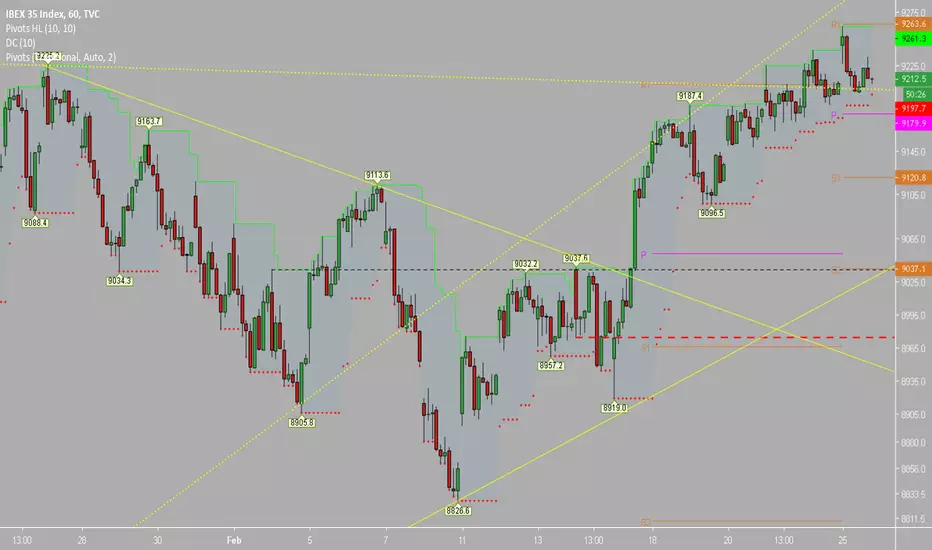
Outstanding CorrectionA correction of the rise since end December is outstanding. The close of the window of January 11th and the following undecisiveness tells me that it may be on the way now.

Spain 35 Signal D1As you can see in the graph above we are in a bearish pattern with accurate support and resistance, It is important to note that the very long trend is a downward trend, but the short trend is precisely an upward trend!
Our recommendation for this index is buying until resistance
Buy Spain 35
Entry Price: 9190
Stop loss: 9050
Take profit: 9400

IBEX On key levels?Ibex flat for a long period of time, actually it looks quite similar as in 2011 and then in 2012 touching 6,065 points. Is it going there again? Maybe no, but too close of. Why? That's the risk for flat assets.
Learn how to beat the market as Professional Trader with an ex-insider!
Have a Good Trading Week,
Cream Live Trading, Best Regards!


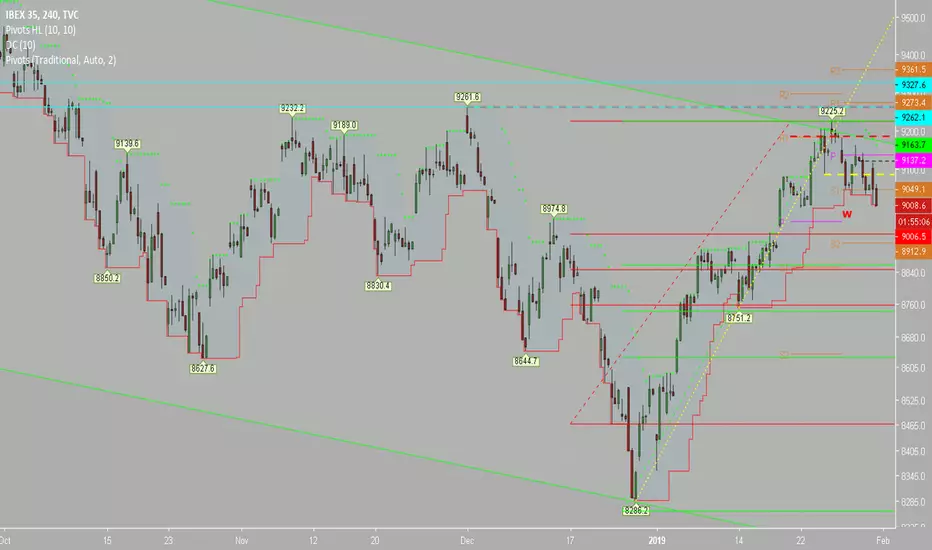
Turning the PositionHaven taken the profit on the long position now, I am turning it into short. The decline since December 3rd has been retraced now what gives hope for a continuation of the trend. The window on December 5th is supporting this view additionally.
IBEX35 possible double bottom, still on downtrend. As seen, we're still in down trend. We have witnessed however two close bottoms oct 22 and dec 10. We are also within a demand zone, so keep an eye for 9100 and 9200. If we fall with the rest of the world, keep eye for slightly over 8200's and next 7700's.
Not advice or anything, just an idea. Keep an open mind .

ESP35 continues the downtrend!As the chart shows the downtrend line hold strong but a small dead cat bounce happened on support, breakdown might continue if support is tested again.
Disclaimer:
This written/visual material is comprised of personal opinions and ideas. The content should not be construed as containing any type of investment advice and/or a solicitation for any transactions. It does not imply an obligation to purchase investment services, nor does it guarantee or predict future performance. Coinmarkets.net, its affiliates, agents, directors, officers or employees do not guarantee the accuracy, validity, timeliness or completeness of any information or data made available and assume no liability for any loss arising from any investment based on the same.

