SPA35 trade ideas


IBEX FLAT correction to a long extensionPossible bottom flat structure
Invalidation last low
Target fibonacci 1 extension

Resistance ZoneDespite the rise above the falling trendline we are stopping below the important resistance zone. So I consider the break of the trendline as a fals one.

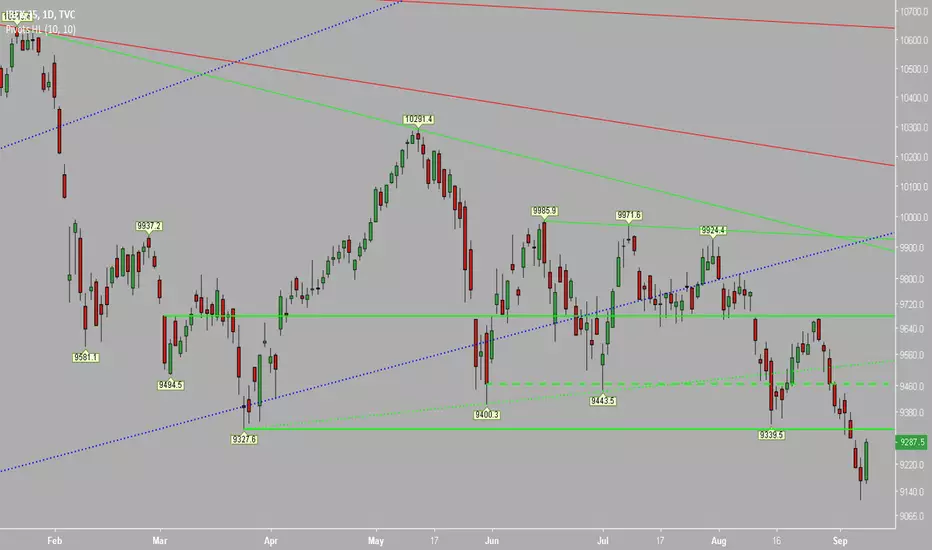
IBEX35 risk play on resistancespossible ascending triangle resistences just above now.
waiting for a possible rally this month ... mmm :)
tt 9500


Short Sell Ibex 35 (Spanish Index) Many of the European Indices are entering a bear market (50sma<200sma).
Shorting is difficult this early in a trend because counter-trend rallies can be explosive and rip through your stops.
The TI indicator that Tone Vays uses is brilliant for finding these inflection points when these counter-trend rallies run out of steam.
The Ibex hit a 9 candle inflection and the next candle closed lower.
Potentially we'll go sideways early in the week (I don't like shorting on Mondays/Tuesdays) and after the 4 candle correction we head lower.
A sell order in this vicinity with a stop above the 9, and above the previous TDST line (orange line) as well as the 50 day moving average (how far above depends on your own risk tolerance) presents a good risk to reward ratio if you're targeting the next lows around 8,650.

IBEX35 small play here retest blue line formation stoploss above triangle would like to swimg and retest blue line horizontal trendline but will see


Elliott Wave: Further Downside Looming For IBEX?Hello Traders,
IBEX short-term Elliott wave view suggests that a decline to 8850.20 low ended red wave A of a zigzag structure. The internals of that decline unfolded as 5 waves impulse structure where black wave ((i)) ended at 9471.20 low. Black wave ((ii)) ended in 3 swings at 9542.80 high. Black wave ((iii)) ended in lesser degree 5 waves at 8971.30 low. Then black wave ((iv)) bounce ended at 9120.80 high and black wave ((v)) ended at 8850.20 low.
Up from there, the index made a 3 wave bounce to 9141.92 high & ended red wave B in lesser degree zigzag structure. Where black wave ((a)) ended at 9021.10. Black wave ((b)) ended at 8986.80 low. And black wave ((c)) at 9141.92 high.
Down from there, the index has made new lows already confirming the next extension lower in red wave C and creating a short-term bearish sequence from 9/21/2018 peak. Where a decline to 8639.70 low ended black wave ((i)) of C. Near-term, while below 8885 but more importantly below 9141.92 high we expect more downside to follow. We don’t like buying it as the right side is to the downside.

No es Bueno Espana!UGHHHH! See that price action from late 1998 to the beginning of 2000? Not Good, that’s corrective behavior. Another European country in a multi-decade market correction. The chart shows a good possibility for the potential pin ball price action over the next decade.
So what is going on here? High Unemployment, Property Bubbles, the Prime Minister is the Tyrannical, Socialist, Fascist Second coming of Franco… Favoring the welfare of an invasion of refugees over the welfare of the citizenry… Have I missed anything?...


IBEX Elliott Wave Calling Rally To Fail For Further DownsideHello Traders,
IBEX short-term Elliott wave view suggests that a rally to 9668.31 high ended blue wave (X) bounce. Down from there, the index made a declined in 5 waves impulse structure. And ended red wave A of a zigzag structure at 8850.20 low. Where the lesser degree black wave ((i)) ended at 9471.20 low. Up from there, a bounce to 9542.80 high ended black wave ((ii)) as a Flat structure. Below from there, a decline to 8971.30 low ended extended black wave ((iii)) in lesser degree 5 waves. A bounce to 9120.80 high ended black wave ((iv)). Finally, a decline to 8850.20 low ended black wave ((v)) & also completed the red wave A.
Currently, we are calling red wave B pullback complete at 9140 and as long as the index stays below that level but more importantly below 9668.31 it is expected to see more downside. We don’t like buying it as the right side stamp is lower & calling more downside against 9668.31 high.

BacktestWe are testing the downside of the former suppert now. As this had been broken we can asume that this resistance will hold now and further declines will follow.
ESP35 Finding Support on PSR?
Hello Traders... Here is another index that is setting up for a bullish move. I have marked on the charts the potential areas of Previous Support and Resistance (PSR) which may provide the required support to the upside. If they hold strong, I will be waiting to get a defined high arising from the current low. I will insert my counter trend line on this high and wait for a candle that will close clear above the trade line with the retracement failing to take out the low from which this high started. I will then buy the next candle. STOP at the low of the U turn and TARGET at Fib 127, maintaining a tight STOP as price approaches Fib 100. I hop this little helps. Thank you and Happy trading traders.


Spanish IBEX 35 close to bear market dropIBEX now at 9180.
At 9000 it will officially be in a BEAR market (-20% from 2017 peak)....


CORRECTION IN THE IBEX35 - DAILYHey Traders,
Looking for these moves in the Ibex35.
We are looking for the area 8400-9000 points and then we will expect a total reversal for a new uptrend rally.
Trade with care,
Carlos


ibex35 - SpainIbex35 has been able to sustain its position around the support area and should be really for an upside Rally in the coming days/weeks all the way to the top from where it all started. Yes, It will take at least a month for this trade to complete so be patient with it.

IBEX 35 - MID-TERM OUTLOOKFor IBEX 35 we foresee a new low to the Long-Term Ascending trend-line which could be tested again before to start to climb again.
