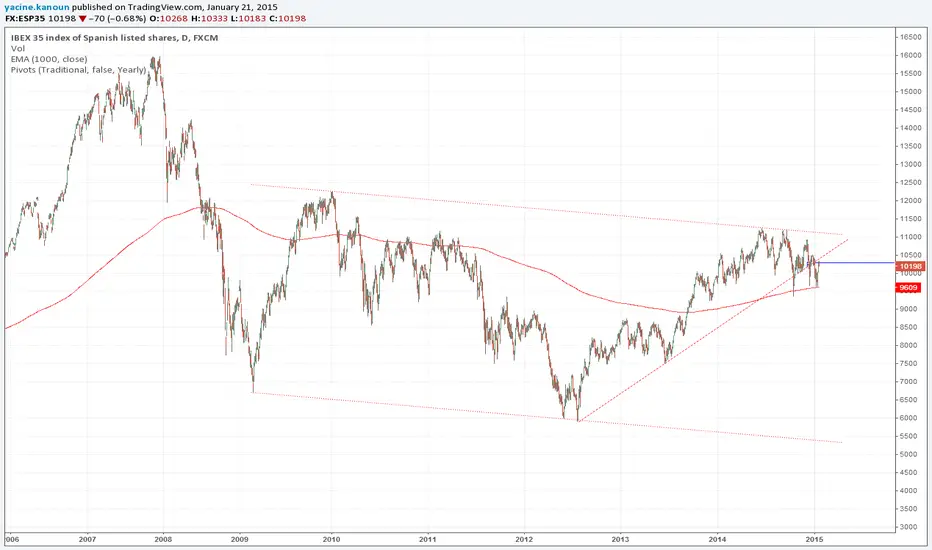
IBEX 35 IDEA [UPDATE]We have IBEX 35 doing the same movement as did at 2010 wich it's paired with a support and the 60% fib.
Regards
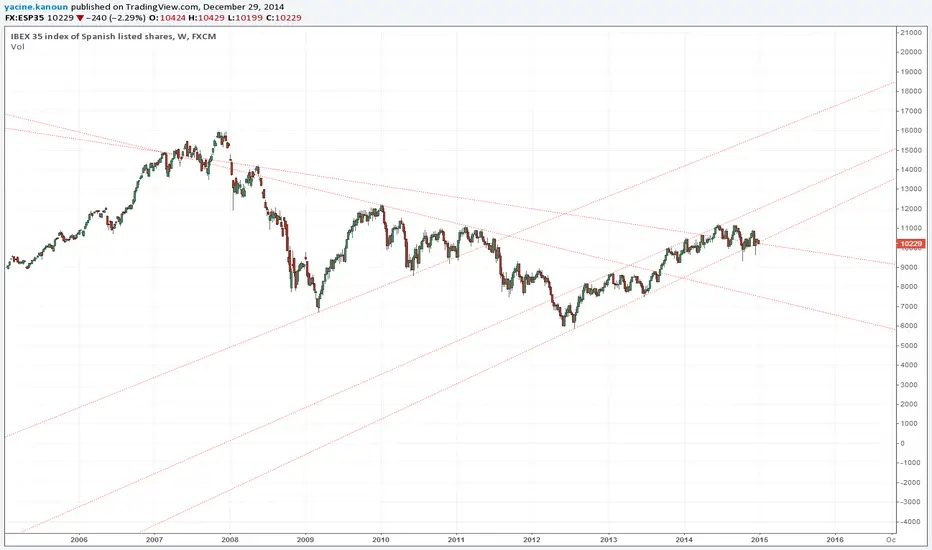
SPA35 trade ideas


IBEX35 - Back to the future?Some beautiful symmetry on this index.
As the world has a mini melt down in 2016 I'll be looking around 7,000 level to find support and hopefully mirror the move from 2008 to take us up and hopefully beyond 12,000


Spanish Bull SharkBullish shark pattern at median line and the head & shoulders target area with bullish RSI divergence.


IBEX 35 ShortWell... After all this news, this index is so overbought and on critical levels of resistance, we should see this one going down sooner than later.
Regards

(J) Trade 7: Speculating on Trend Resumption #IBEXUpdate: Target Reached without entry Trade Cancelled.
===========================================================================
Trade 7: Pending Long IBEX35 @ 10,800
S.L @ 10590
T1 11,160
T2 11,585
For $29,798.94 Balance, Position size = 0.4 lot (0.2+0.2) .
Risk= 4(position size) x0.8(point value per 0.1 lot)x210(stop loss)=$672 ~ 2.2% of Balance.
===========================================================================
Reasoning
Long term trend is up
200 Days SMA forming support
Multiple hammer candles at 200-days Average
1.271 extension of recent bullish wave
Fundamental factor: Any minor progress on Greece will probably lead to a major rally, as economic conditions improved recently in the euro area and ECB continues to pump money through QE.
Don't forget to click the Thumbs Up
Wish me luck and best of luck for everyone.
For Trades rules and guidelines follow this link
My best regards
Technician
Subscribe to my trading portal thefxchannel.com

Unemployment in Spain 23.2 percent. Market index up 100 percent.Spain could be facing the same outcome as Greece. But a much bigger economy.

Finds support at prior resistanceGood looking setup as the index rebounded of previous resistance forming a long pin bar. Good risk reward ratio trade as well.

Retesting Previous Major ResistanceThe index is retesting the previously broken high, it look like a Good level to look for long positions towards 12255 next resistance.

Uptrend continues?Open 3 positions or more for the two main targets with additional positions for a continuation. Move stops to protect positions once price has cleared them.
Good Luck!


Long Spain after broken important resistance and bullish pin barUPDATE 5/5: Stopped out on both positions. Result: -2R
Two entries:
1. Buy limit half of 26/03 pin bar, s/l under horizontal support, t/p around highs on monthly chart, R:R 3,5:1
2. Buy stop top of 26/03 pin bar, s/l under horizontal support, t/p around highs on monthly chart, R:R 2:1
Let the euro QE roll...

España Challenging Sideways ResistanceWatch-out España traders, the IBEX is challenging the major key long term sideways resistance or ceiling. Typically, in sideways markets, we expect price to reverse to the downside. However, this time might be different, as the price test the level for sixth time. The latest test(March 2) was followed by a minor pullback and a bullish pin bar.
I would think twice before going short at that resistance for now. why? For the first time , the ECB is pumping money for free with its new asset purchase program. History and the FED have taught us what happens to equities when central banks go full throttle.
We might see a reactive correction but i advise waiting for a candlestick confirmation for such scenario and look only for limited downside potential.
A breakout above 11235 resistance with at least a weekly closing would confirm the bullish breakout. I wont suggest targets for this scenario as this idea is just a general opinion...
------------------------------------------------------------------------------------------------------------------------------------------------------------
Be one of the first members of my new trading portal, check my new website thefxchannel.com , vote and subscribe. Thank you
Good luck, keep your stops tight..
twitter.com
www.facebook.com
plus.google.com
My best regards
Technician

Spain IBEX - Stuck and Complex
If the QE was meant to help peripherals, so far it s not working as planned (for Spain at least).
I keep this one on the radar - It is not driving but is a good metric to see if the plan is working or not.
IBEX - Spain - On cliff for a dive
The European QE is pending - It is largely in the media for a long while now.
I doubt equities would be trading where they are if they expected something great to come (this is speculative, i acknowledge).
IBEX is on a cliff that rejected up twice in weekly close...
The third attempt down may break the elastic this time and there is 25% free fall zone.
In any case: very pivotal supported zone that shall launch something rather soon.
My view: down.
Short 10% stop 11000... TP 8000.
IBEX 35 Spanish Index ( Daily )IBEX 35 Spanish Index ( Daily )
Bullish Pennant brake_out.
RSI at 65.

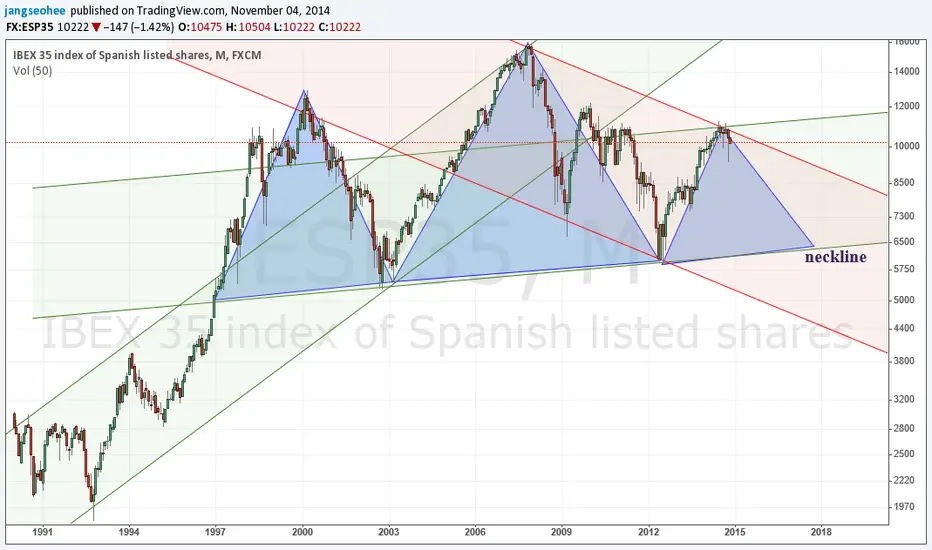
Spain index doesn't look promisingAfter a few channels are drawn, i though i see a potential right shoulder forming.
And the potential neckline is the channel support. Whatever it is, since Nov 2007 market top, the price has been in the current downtrend channel. The channel resistance at Aug 2014 makes the channel very very well.
Spain analysis - Weekly bearish, daily bullishI will set this chart on neutral because it isn't a trade signal. The daily chart gives me a buy signal (), like all other major european markets, but the weekly has a beautiful bearish picture at 11000, which is the most important area in this chart.
If the daily will give me a selling signal, I will short this, if not, well... I think it is due for a pullback and it will probably five a buy signal on the daily when the weekly reaches the Wave (well, hopefully).
I forgot to link related ideas, so if you are interested, here they are
* The evening star signal is confirmed or not depending on the platform you use. For example here, the red candle did not close below 50% of the blue candle, but on my platform it did. These things don't really matter in my opinion, you can bend the rules a bit, in the long run, it shouldn't affect trading performance.

SPAIN: Confluence short, or the art of patienceSecond rejection at the same area, after gun the shorts first - including mine- at 10,500.
Another try at 0.764 from 2010 highs to June 2012 lows, upper BB boundary again, and the same diverging momentum, produced a BE weekly candle, just like the one we saw at the end of January.
If will continue down or not, its up to the Blood Moon I guess. Strong support at 10,100-120 area and 9,800 as well. The trend is clearly up and the bottom IH&S has a roughly target above 11,500.
Remember that Spain is borrowing from the markets currently with a lower rate than USA. The fact that it's unemployment level is close to 30%, with the 24-34 ages touching 60%, I guess make the economy stable. Go figure the bankster world we live in...
Last but not least, the need to practice patience is clearly shown at the chart.

Update: Bullish Reversal; Bearish Targets | $IBEX35 $ESP35 $EURFriends,
Back on January 24th, we forecast a potential bearish target with a "far-fetched" qualifier, although we also provided two other prior examples where that proprietary geometric pattern unfolded - See this chart, as well as examples in the USDollar index and AUDUSD here:
CHANGE IN DIRECTION:
At this point though, we have to change our directional stance based on a BULLISH market reversal signal favoring further rallying in this index. While we remain cautious about further advance, the system is the plan. Hence, we will continue to plan the trade, and trade the plan.
STRUCTURES:
On a structural standpoint, 10549 offers the next probable resistance overhead. However, once surpassed, expect this level to convert to support as price might probably use that structure as a springboard to the new high target defined today as "TG-Hi = 1109 - 25 FEB 2014".
At that point, added forecast will require a review and further analysis of the chart, but the background that motivates our interest in the lower target defined earlier in the year as "TG-Lo = 7791 - 24 JAN 2014" is based on a proprietary geometric pattern we called "The Great White". Caveat here is that our predictive analysis and forecast are NOT based on price action, whereas our proprietary patterns (Great White, Janus, Deep Shark, Euclid) are price-based, hence less relevant to our way of analyzing the market. Nonetheless, some traders may be exclusively pattern traders, and on our side, we continue to discover, test and validate such patterns as well, out of curiosity.
ALTERNATE SCENARIO:
In case the bullish scenario would not play out (i.e.: further rallying and breaking above structure at 10549), we would like to bring the trader's attention to two other structural levels:
One rests at 9650, defined as the prior structure low. However, transgression of that level should not necessarily constitute a bullish abandonment, or herald a directional reversal. In fact, in our system, we would tolerate a reversal as low as the "Pink" 9506-to-9371 range. However, if and once price breaks below and closes below ("BBCB, as opposed to breaking above and closing above, or "BACA"), then we would be concerned bulls, and would seek ways to reverse tack.
OVERALL:
A BULLISH reversal confirmation occurred with a new bullish target at 11092. Further downside might exist, but that scenario does not currently apply to the directional signal just released by our prop strat system.
Cheers,
David Alcindor
TradingView.com Moderator, Alias: 4xForecaster
Predictive Analysis & forecasting
-----------------------------------------------------
Get out Twitted forecasts, signals,analyses:
Alias: @4xForecaster
-----------------------------------------------------
Disclaimer: Forecasts, analyses and opinions generated herein are for educational purposes only and are not trading recommendations. We trust that you will do your own due diligence first, then seek professional advice from a licensed professional, then enter the market at your own perils - David Alcindor - TradingView.com Alias: 4xForecaster
