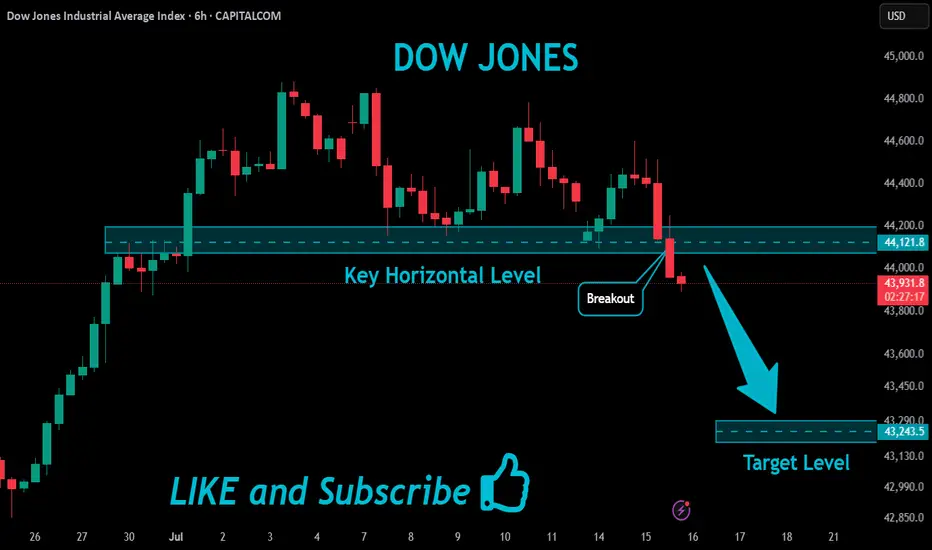
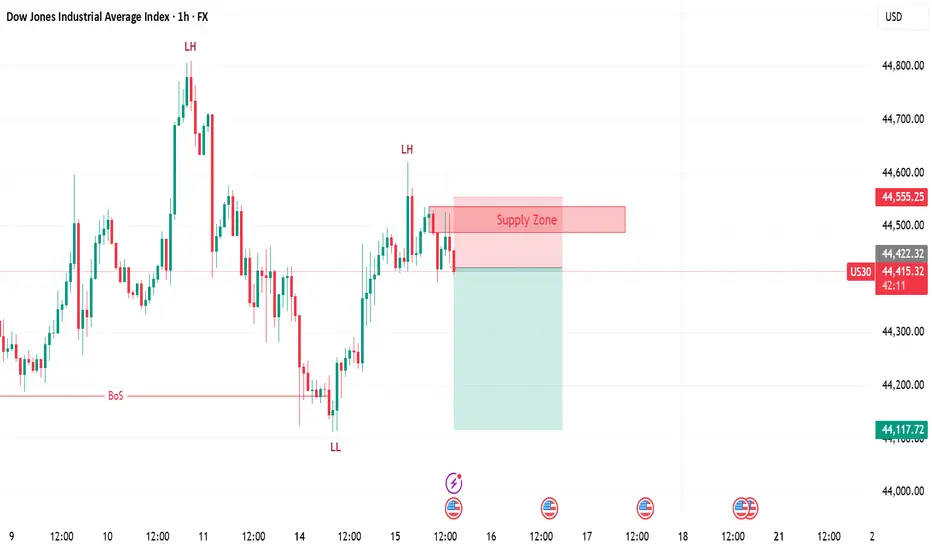
US30 Bearish Breakout!
HI,Traders !
#US30 index is trading in a strong downtrend,
and has broken through the key horizontal
level at 44121.8, reinforcing our bearish
outlook. We expect further declines !
Comment and subscribe to help us grow !
US30 trade ideas
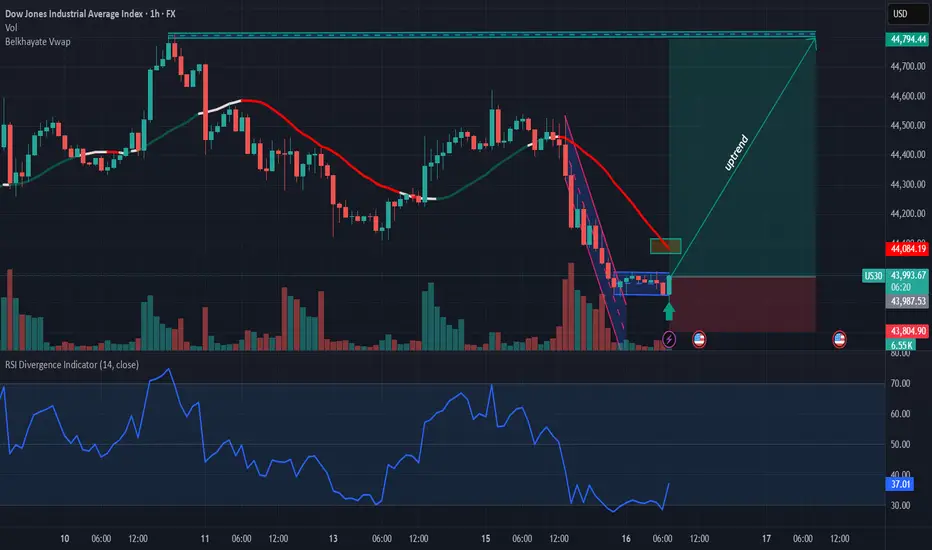
US30: Buy ideaOn US30 as you can see on the chart we would have a hight probability to have an uptrend.
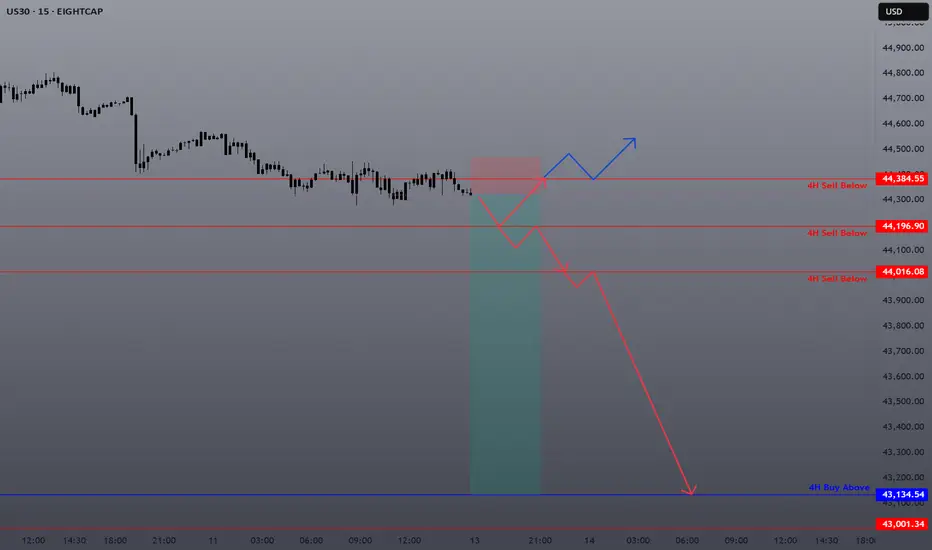
check the trendGiven the behavior of the index in the current support area, possible scenarios have been identified.
If the index breaks through the support area, a continuation of the downward trend will be likely.

Dow Jones Industrial Average Index - 4 Hour Chart4-hour chart of the Dow Jones Industrial Average (US30) shows a recent price movement as of July 13, 2025. The index is currently at 44,315.0, reflecting a decline of 285.5 points (-0.64%). The chart highlights a sell signal at 44,312.0 and a buy signal at 44,318.0, with a shaded area indicating a potential downward trend from a recent peak. Key price levels include 44,855.7 (high) and 43,902.2 (low), with a support level around 44,315.0.

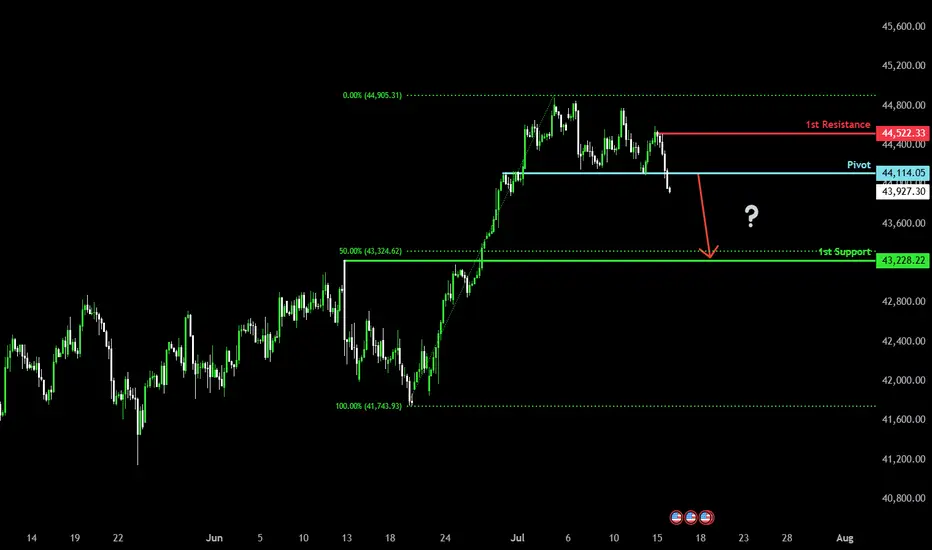
Bearish drop?Dow Jones (US30) has reacted off the pivot and could drop to the 1st support which has been identified as a pullback support.
Pivot: 44,114.05
1st Support: 43,228.22
1st Resistance: 44,522.33
Risk Warning:
Trading Forex and CFDs carries a high level of risk to your capital and you should only trade with money you can afford to lose. Trading Forex and CFDs may not be suitable for all investors, so please ensure that you fully understand the risks involved and seek independent advice if necessary.
Disclaimer:
The above opinions given constitute general market commentary, and do not constitute the opinion or advice of IC Markets or any form of personal or investment advice.
Any opinions, news, research, analyses, prices, other information, or links to third-party sites contained on this website are provided on an "as-is" basis, are intended only to be informative, is not an advice nor a recommendation, nor research, or a record of our trading prices, or an offer of, or solicitation for a transaction in any financial instrument and thus should not be treated as such. The information provided does not involve any specific investment objectives, financial situation and needs of any specific person who may receive it. Please be aware, that past performance is not a reliable indicator of future performance and/or results. Past Performance or Forward-looking scenarios based upon the reasonable beliefs of the third-party provider are not a guarantee of future performance. Actual results may differ materially from those anticipated in forward-looking or past performance statements. IC Markets makes no representation or warranty and assumes no liability as to the accuracy or completeness of the information provided, nor any loss arising from any investment based on a recommendation, forecast or any information supplied by any third-party.
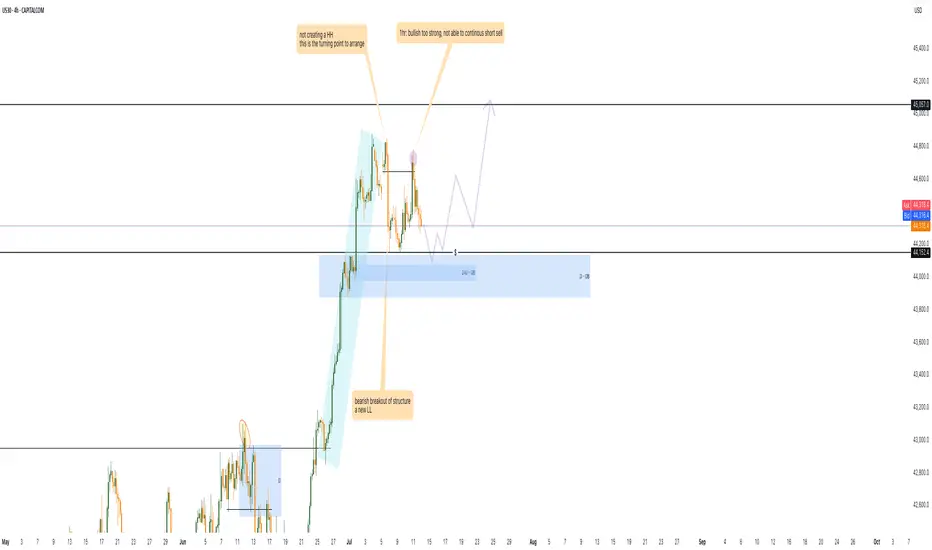
Shakeout On The WayUnlike the SPX, the DJI didn't make a higher-high. Why is this? I think partially because it's price weighted as opposed to market cap weighted like the Nasdaq or SPX. The other part would be CPI numbers.
So what's next for the DJI? I see hidden bullish divs long term and hidden bearish divs short term, this a common shake out tactic I see to liquidate longs and shorts. I'll be looking to load up on the trade at the bottom of the channel and play the range as it develops.
As always: stay calm, don't panic, and don't forget you can always use a stop loss
The fear and green index is at 74, when people are greedy be fearful.

14.07.25 Morning ForecastPairs on Watch -
FX:NZDCAD
FX:USDJPY
FX:EURUSD
OANDA:US30USD
A short overview of the instruments I am looking at for today, multi-timeframe analysis down to what I will be looking at for an entry. Enjoy!

US30 | SELLConfirmation from 15 minute timeframe.
General trend in 1H is downward.
Trading with impulse.
US30: Bears Are Winning! Short!
My dear friends,
Today we will analyse US30 together☺️
The price is near a wide key level
and the pair is approaching a significant decision level of 44,420.7 Therefore, a strong bearish reaction here could determine the next move down.We will watch for a confirmation candle, and then target the next key level of 44,379.6..Recommend Stop-loss is beyond the current level.
❤️Sending you lots of Love and Hugs❤️


US30 Bearish Below 44490 – Watching 44180 US30 Analysis
US30 remains bearish below 44490, with downside targets at 44180 and 43960.
A 1H close below 44180 would confirm continuation toward 43630.
To turn bullish, price must break above 44490.
Pivot: 44430
Resistance: 44460, 44550, 44760
Support: 44180, 43960, 43630

DOW JONES INDEX (US30): Classic Gap Trade
I see a gap down opening on US30 index.
As always, there is a high chance that this gap is going to be filled.
A bullish imbalance candle and a local change of character CHoCH
indicate a highly probable rise to a gap opening level.
Target - 44300
❤️Please, support my work with like, thank you!❤️
I am part of Trade Nation's Influencer program and receive a monthly fee for using their TradingView charts in my analysis.

Crystal ball market Crystal ball market ..market insights are invaluable! Their team provides actionable advice and their customer service is top-notch. A trusted broker in this industry!

correctionIt is expected to fluctuate within the current support level and then continue the upward trend.
If the index breaks through the green support level, the correction to the next support level is possible.
US30US30 needs some more correction before we go bullish again.
Disclosure: We are part of Trade Nation's Influencer program and receive a monthly fee for using their TradingView charts in our analysis.

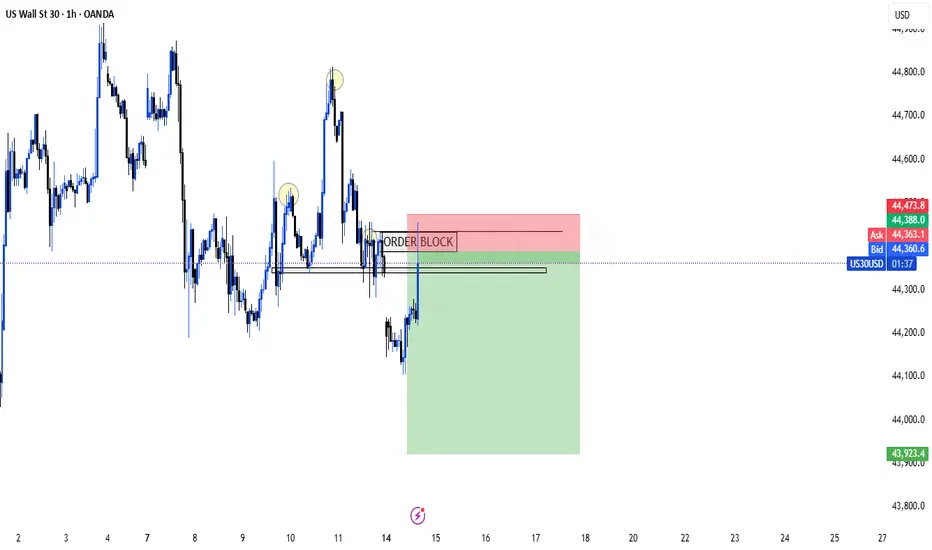
US30 prepare for the bullish 1. there is double bottom at 44152 level, i will tend to wait for the sweep meaning the price go down and hit the 4hr order block.
2. wait for 15m/ 30m TF a strong bullish momentum.
3. retest the 44152 around level or 0.618 to enter the market to long
US30 Sell continuationUS 30 appears to be running SSL. 4H levels identified. Looking for Break & retest. If support does not hold on to any level, expect the bulls to return and take over.
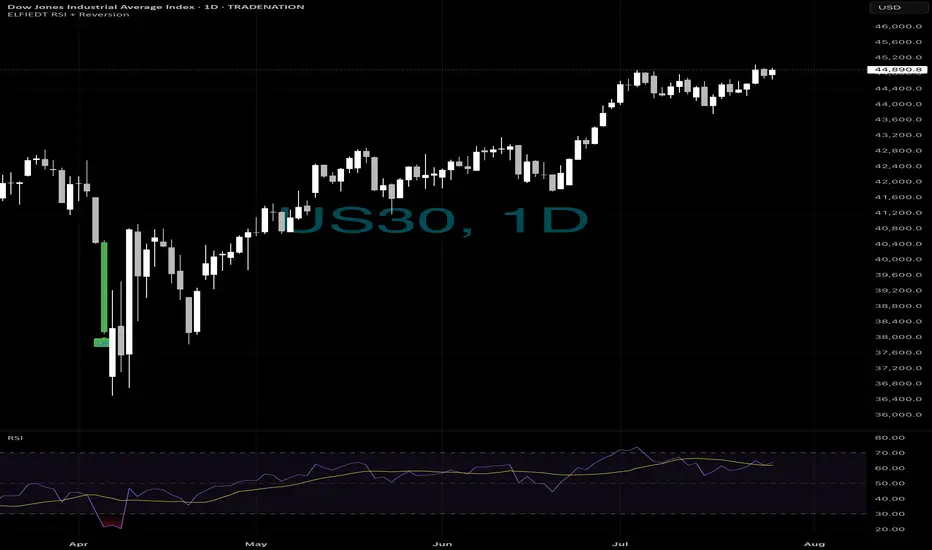
Retirement trading?🏦 LONG-TERM INVESTORS — This Was the Signal.
When fear hit the Dow in April,
most sold.
Our system?
🟢 It bought the dip — and never looked back.
That single green “UP” on the daily US30 chart caught the bottom of the move that led to 5,000+ points and counting.
⸻
This is what long-term confidence looks like:
✔️ Oversold RSI + deep structure
✔️ Clean mean reversion signal
✔️ Daily confirmation = strong foundation
✔️ No lag. No second guessing. Just one entry, held strong.
📈 From panic to new highs — all off one candle.
⸻
🧠 Here’s How Investors Can Use It:
1. Monitor daily charts on major indices
2. Wait for RSI exhaustion + reversion zone tag
3. Let ELFIEDT RSI + Reversion give the green light
4. Enter with size. Ride the trend.
This isn’t about day-trading.
This is about compound wealth with simple conviction.
⸻
💬 DM “DOW ENTRY” to get access
📲 Follow if you want less noise and more clarity
🔐 For investors who want an actual edge, not just advice
Because smart investors don’t time the market —
🚀 They follow signals with structure behind them.
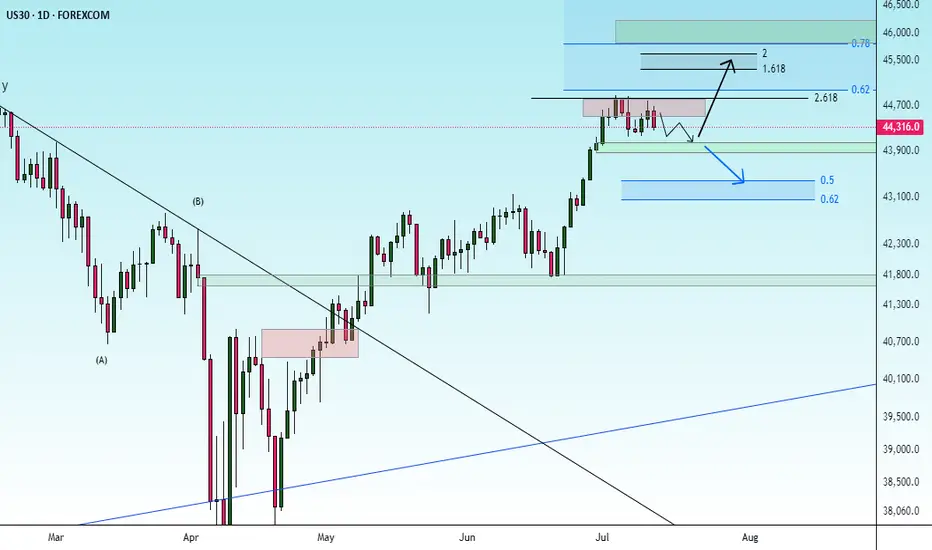
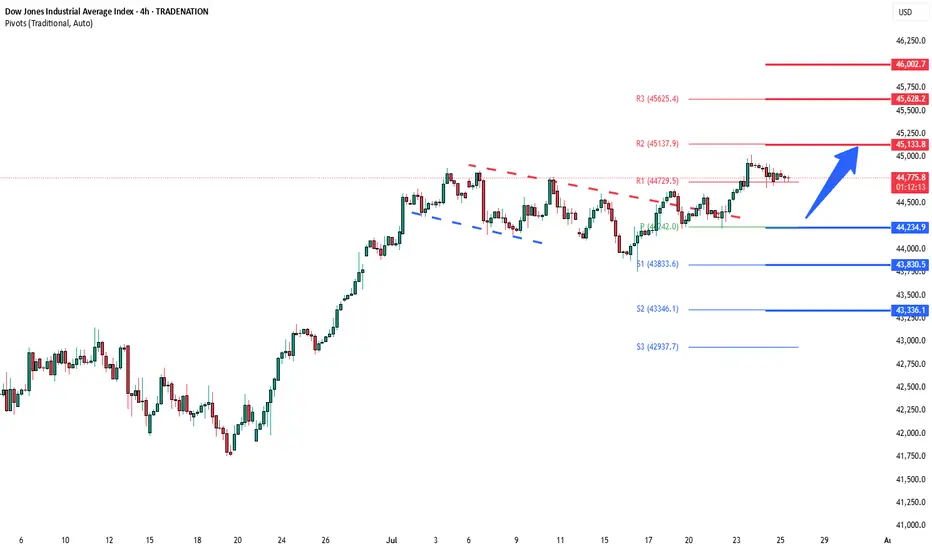
DowJones bullish breakout support at 44240Key Support and Resistance Levels
Resistance Level 1: 45135
Resistance Level 2: 45630
Resistance Level 3: 46000
Support Level 1: 44240
Support Level 2: 43830
Support Level 3: 43340
This communication is for informational purposes only and should not be viewed as any form of recommendation as to a particular course of action or as investment advice. It is not intended as an offer or solicitation for the purchase or sale of any financial instrument or as an official confirmation of any transaction. Opinions, estimates and assumptions expressed herein are made as of the date of this communication and are subject to change without notice. This communication has been prepared based upon information, including market prices, data and other information, believed to be reliable; however, Trade Nation does not warrant its completeness or accuracy. All market prices and market data contained in or attached to this communication are indicative and subject to change without notice.
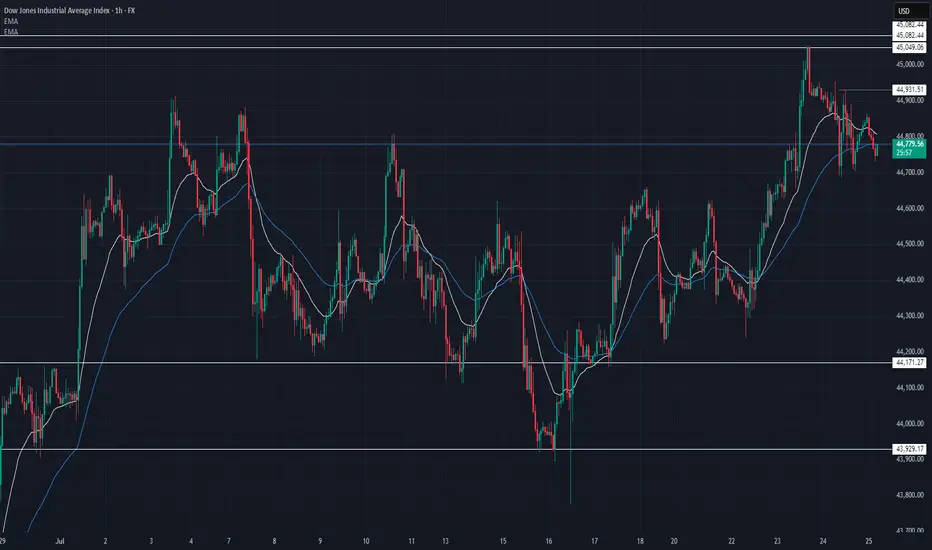
US30 Market Breakdown – 07/25/2025📍 US30 Market Breakdown – 07/25/2025
🕹️ After tagging the highs at 45,082, US30 has pulled back and is now hovering around 44,780. The market rejected the high and is consolidating below 44,931, forming a lower high — hinting at potential short-term weakness.
But don't get too bearish just yet. We’re still above the 9 & 21 EMAs on the 1H, and trend structure remains intact unless we lose key support.
Let’s break it down 👇
📊 Current Structure:
🔻 Rejection from 45,082
📉 Minor lower high forming
🔁 Consolidating between 44,700–44,900
📐 EMAs flattening = potential chop
🧱 Resistance Zones:
45,049 → 45,082 (double rejection)
44,931 (current ceiling)
📉 Support Zones:
44,750 (minor intraday demand)
44,700 = EMA confluence
44,600–44,500 (next strong base)
⚠️ If price breaks under 44,700, we could see a retest of 44,450 and even 44,171.
🧠 Bias:
🟡 Neutral to slightly bearish intraday
Below 44,900 = short setups favored
Watch for bounce at 44,700 or breakdown toward 44,600
Still in uptrend overall unless 44,171 breaks
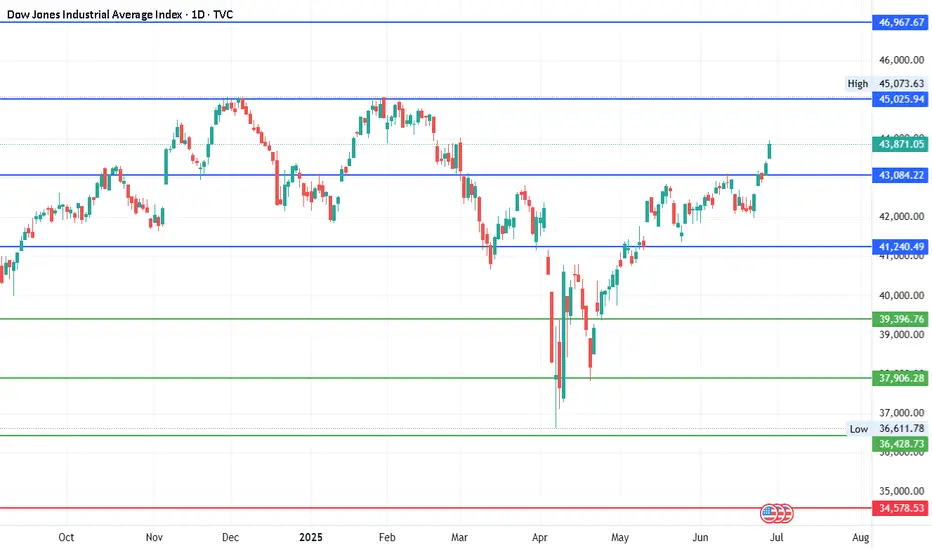
#DJI - 5000 Pts already moved out of 8000 points..Date: 27-06-2025
#DJI - 5000 Pts already moved out of 8000 points as posted on 22nd April. Another 3000 points to cover. we have different pivot for the next level up and it will be shared soon.
Old levels are as follows.
#DJI Upside Targets: 41240.49, 43084.22, 45025.94 and 46967.67
#DJI Downside Targets: 34578.53, 32728.34, 30786.61 and 28844.88
Current price is around 43,870 at the time of this post.
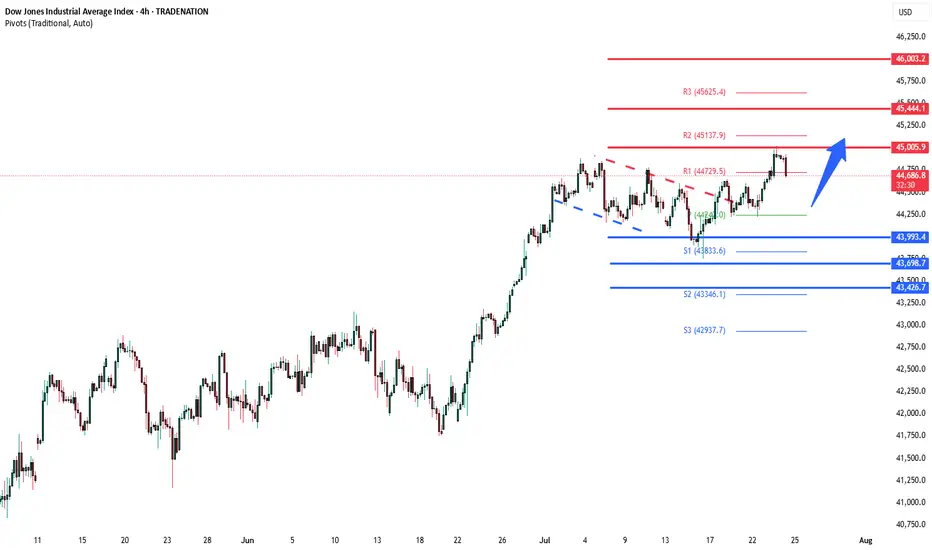
DowJones uptrend support at 43990Key Support and Resistance Levels
Resistance Level 1: 45000
Resistance Level 2: 45444
Resistance Level 3: 46000
Support Level 1: 43990
Support Level 2: 43700
Support Level 3: 43426
This communication is for informational purposes only and should not be viewed as any form of recommendation as to a particular course of action or as investment advice. It is not intended as an offer or solicitation for the purchase or sale of any financial instrument or as an official confirmation of any transaction. Opinions, estimates and assumptions expressed herein are made as of the date of this communication and are subject to change without notice. This communication has been prepared based upon information, including market prices, data and other information, believed to be reliable; however, Trade Nation does not warrant its completeness or accuracy. All market prices and market data contained in or attached to this communication are indicative and subject to change without notice.