VIX possible long?As equity markets continue to approach all-time highs and expectations of interest rate cuts increase, market sentiment remains highly optimistic. This environment of "good news" characterized by strong performance in equities and the anticipated easing of monetary policy is likely to suppress volat
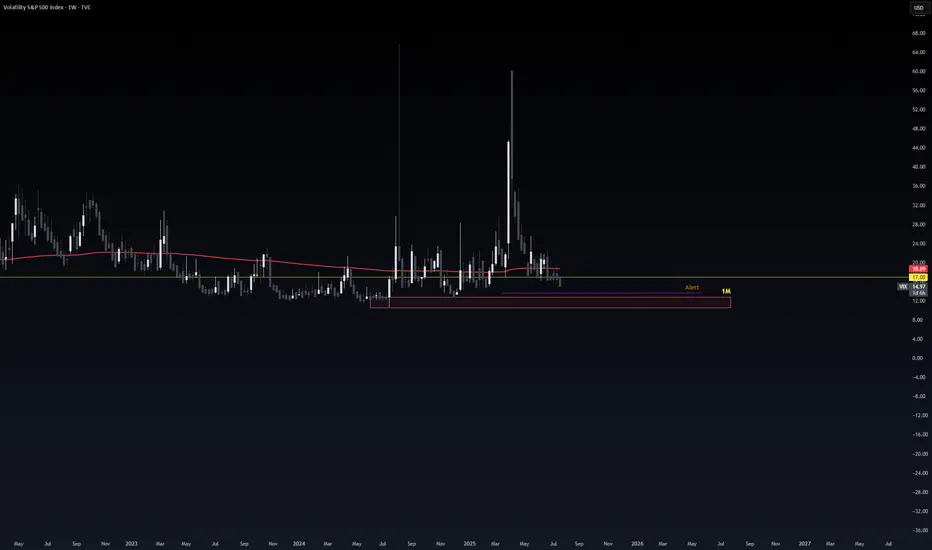
VIX Alarting !when VIX Reach Red Zone.
It consider as Extreeemeee Greeeed !!.
100% market will take U-Turn direction which will be Red in Up coming days !
although im day trading im good and never keep money in market after close.
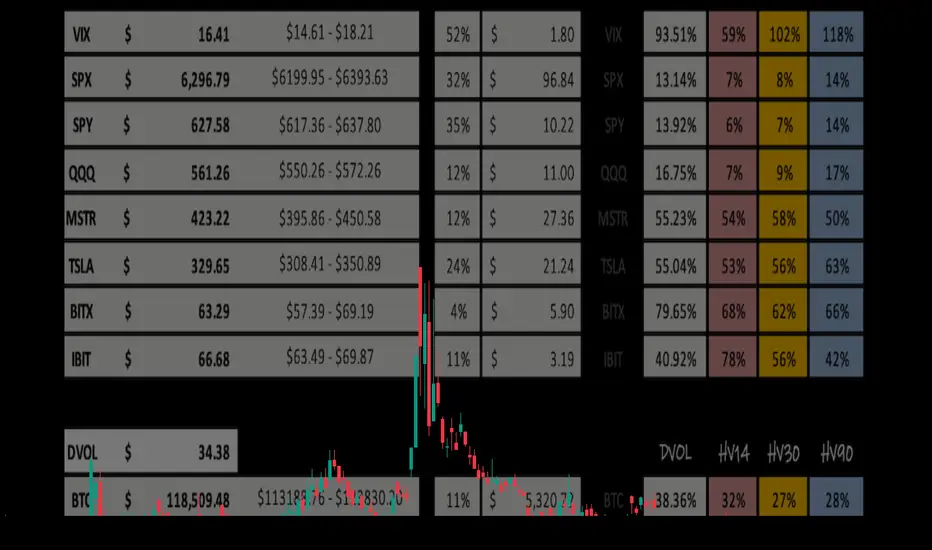
Go Long on VIX: Predictions for Increased VolatilityCurrent Price: $16.41
Direction: LONG
Targets:
- T1 = $17.50
- T2 = $18.25
Stop Levels:
- S1 = $15.90
- S2 = $15.65
**Wisdom of Professional Traders:**
This analysis synthesizes insights from thousands of professional traders and market experts, leveraging collective intelligence to identify
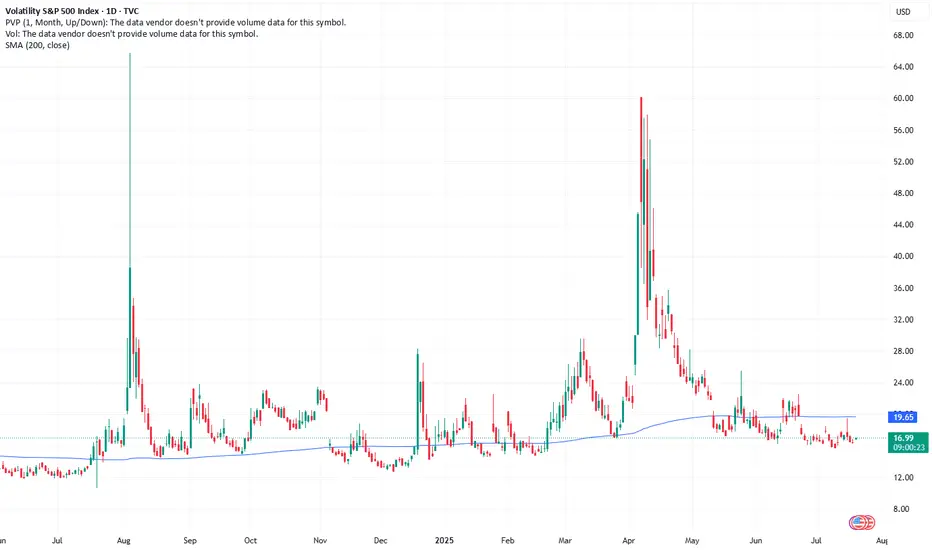
Weekly Volatility ReadGood Evening --🌗 🌕🌓
I hope everyone is having a relaxing weekend with friends and family alike because soon we will be in the thick of the price action again -- and it may get spicy! Let't us dive in as we review what happened last week and we look towards the next to trade range or observe.
The
VIX Crab VIX is likely to rise from $17.4 upon reaching it, positioned at the leg of the Crab Pattern, potentially advancing towards the targets (TP #1 - TP #3).

15.40This channel is not providing individualized trading or investment advice, nor is it a banking service, brokerage service, trading service, investment service or money management service

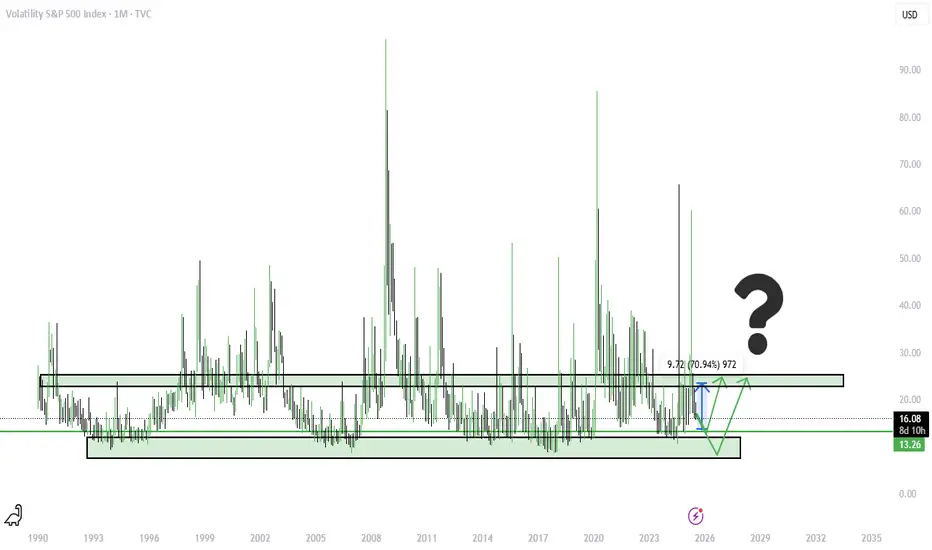
I told you so....VIX is the golden goose! All this fake pump in the market was just not sustainable. It is very clear that there are holes and the money printing can't last forever. The S&P fake pumps, and artificial tariffs (which Americans pay 90%) are created out of thin air. The reality is that defaults are very high across the board fo

The VIX will be soon very positive.Fasten seatbelts!!!
As you can see:
Triangle pattern.
Indikator divergencys.
Greed maxium.

Weekly Volatility Snapshot Good Evening --
I hope everyone is having a restful weekend and enjoying your time away from markets. Always appreciate it while you can, and spend that precious time with loved ones. Now, let us review the price action last week as we look towards our expectations for the coming trading sessio

Weekly Volatility SnapshotGood Evening -- Happy July 4th to everyone
Let us review last week as we look towards the next in anticipation of the trade deal deadline that looms. I had a target on the SP:SPX of $6,253.59 and the weekly high was $6,284.65. The candle on the short week opened at its low of $6,019.21 and closed

See all ideas
Displays a symbol's price movements over previous years to identify recurring trends.
Frequently Asked Questions
VXX Volatility Index CFD reached its highest quote on Aug 5, 2024 — 37.03 USD. See more data on the VXX Volatility Index CFD chart.
The lowest ever quote of VXX Volatility Index CFD is 12.63 USD. It was reached on Jul 11, 2024. See more data on the VXX Volatility Index CFD chart.
VXX Volatility Index CFD is just a number that lets you track performance of the instruments comprising the index, so you can't invest in it directly. But you can buy VXX Volatility Index CFD futures or funds or invest in its components.