Vix finally to respect downside?after todays fed commentary, and this weeks earnings disappointments of the likes of Google, Apple and Microsoft, is it time vix to come back? NYCB made headlines as well by cutting the dividend and shoring up capital for potential losses.
Vix this low is just eerie and concerning.
Trade Idea would be bear spreads in indices, easier than trading vix directly.
VXX trade ideas

VIX without candle shadow(s)In these kinds of index charts, the baseline works better to see the true trendline
Candle shadows often mislead it.
Per this, we are at support (right) now.

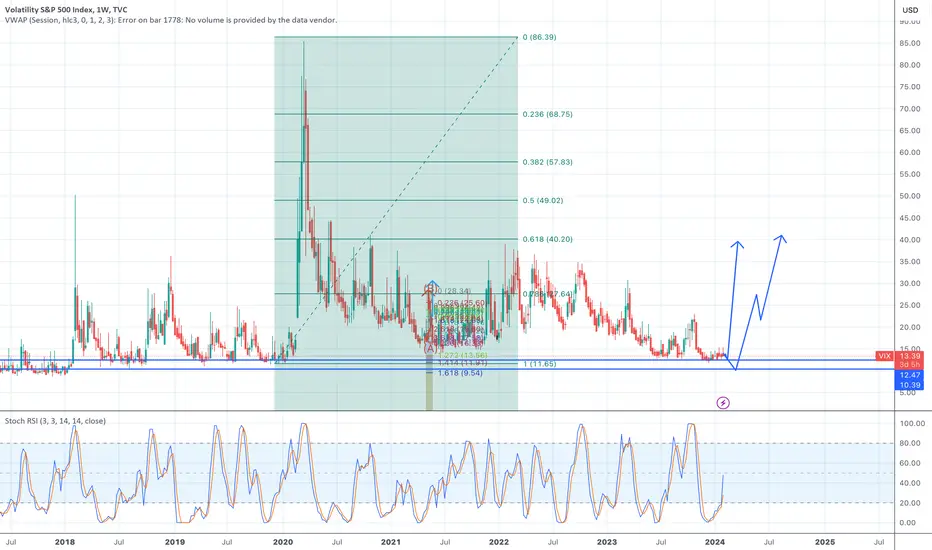
Short term pull back then continued volatilityShort term pull back then continued volatility - As i mentioned the 10 to 13 level is high risk of a market correction, combining this with my prior prediction of the EUR/USD falling, the DXY basing out for a rise at key inflection point support, Gold and Silver showing strong bullish head and shoulders patterns that are also the handle of a bullish cup and handle formation, among other indicators made this a very obvious long trade for me. I expect a fall towards 13-14 and then a continued rise from there, a lot of volatility this year get ready

$VIX Possible Breakout? $VIX Tightest Base since 2018Weekly Chart from COVID Highs
Weekly Chart has yet to break out the trend line (green bar) from COVID Highs
The bottom appears to be getting tight and has consolidated sideways for weeks
June - September 2023 the chart was basing which rallied 10 points in the end of September
The base in June - Sept was not as tight as the chart is showing now
This is even with AMEX:SPY continuing to increase but VIX holding it's range (KEY)
Weekly chart showing a rounding bottom
Zoomed-In Weekly Chart
First we would like to see the weekly break the short term white trend line
To break to the upside into the green downtrend line from COVID Highs we would need VIX weekly to break through and close above $15.75
High chance if it breaks $15.75 we will hit the top line of the downtrend which the price will depend on when this break will happen
We could see highs of TVC:VIX to $17-$18 if breaks $15.75

THE SIGNALThe US VIX is signalling sell signal unless it stops at the next resistance, sail cautious.

VIX is getting ready to roll The VIX failed to close the opening gap it formed yesterday, which is slightly concerning news (especially if also considering an ongoing bloodbath in the Asian market and the potential spillover effect into Western equity markets). As a result, we are closely monitoring the resistance at $14.49; a breakout above it will bolster the bullish case for the VIX, while the gap's closing will suggest otherwise.
Technical analysis gauge
Daily time frame = Slightly bullish
Weekly time frame = Neutral
*The gauge does not necessarily indicate where the market will head. Instead, it reflects the constellation of RSI, MACD, Stochastic, DM+-, ADX, and moving averages.
Please feel free to express your ideas and thoughts in the comment section.
DISCLAIMER: This analysis is not intended to encourage any buying or selling of any particular securities. Furthermore, it should not be a basis for taking any trade action by an individual investor. Therefore, your own due diligence is highly advised before entering a trade.

VIX Stock Chart Fibonacci Analysis 021224 Trading Idea
1) Find a FIBO slingshot
2) Check FIBO 61.80% level
3) Entry Point > 14/61.80%
Chart time frame : B
A) 15 min(1W-3M)
B) 1 hr(3M-6M)
C) 4 hr(6M-1year)
D) 1 day(1-3years)
Stock progress : B
A) Keep rising over 61.80% resistance
B) 61.80% resistance
C) Hit the bottom
D) Hit the top
Stocks rise as they rise from support and fall from resistance. Our goal is to find a low support point and enter. It can be referred to as buying at the pullback point. The pullback point can be found with a Fibonacci extension of 61.80%. This is a step to find entry level. 1) Find a triangle (Fibonacci Speed Fan Line) that connects the high (resistance) and low (support) points of the stock in progress, where it is continuously expressed as a Slingshot, 2) and create a Fibonacci extension level for the first rising wave from the start point of slingshot pattern.
When the current price goes over 61.80% level , that can be a good entry point, especially if the SMA 100 and 200 curves are gathered together at 61.80%, it is a very good entry point.
As a great help, tradingview provide these Fibonacci speed fan lines and extension levels with ease. So if you use the Fibonacci fan line, the extension level, and the SMA 100/200 curve well, you can find an entry point for the stock market. At least you have to enter at this low point to avoid trading failure, and if you are skilled at entering this low point, with fibonacci6180 technique, your reading skill to chart will be greatly improved.
If you want to do day trading, please set the time frame to 5 minutes or 15 minutes, and you will see many of the low point of rising stocks.
If want to prefer long term range trading, you can set the time frame to 1 hr or 1 day.

✅VIX GROWTH AHEAD|LONG🚀
✅VIX has almost reached
A horizontal support level
Of 12.40$ and as VIX grows
Faster than it falls
Due to the peculiar nature of
The options on which
It's price is based we will
Be expecting a rapid
Rebound from the support
LONG🚀
✅Like and subscribe to never miss a new idea!✅


VIX showing that tension is expected soon in the stock markets.When we looked at the Volatility Index (VIX) on our November 07 2023 analysis (see chart below) we compared it with the S&P500 index (SPX) :
The S&P500 has reached the top of its Channel Up, while the VIX bottomed and is consolidating on a price action that is very similar to the July 27 2023 Low, which was the former Higher High of the S&P500 Channel Up.
Today we plot both VIX and the S&P500 on the same chart and not side by side. As you can see VIX's 1D RSI has bottomed and is rising within a Bullish Megaphone, indicating that the price has already bottomed, which is a Lower Low on the Channel Down pattern it has been trading within since the September 28 2022 High (which has also been the start of the 2023 recovery year for the stock markets). The SPX is illustrated by the thin black trend-line and being negatively correlated in nature, when VIX declined within this Channel, the stocks rose and vice versa.
Since October 23 2023, VIX started to decline again and that sparked the stock rise which is holding up to this day. VIX's bottom and rise though above the 1D MA50 (blue trend-line) within the Bullish Megaphone we just mentioned above, is an indication that the SPX has topped, similar to the February 02 2023 and July 27 2023 Highs, which where Lows for VIX's Channel Down.
The chart clearly shows that VIX has just started its own (dashed) Bullish Megaphone (has always done so a little after the RSI Bullish Megaphone) and that was been the start of the S&P500 decline during the Higher Highs we mentioned. As a result, we expect VIX's volatility to apply high pressure on the stock market in the next 4-6 weeks, which should technically bottom and turn into a buy opportunity again only after VIX closes a 1D candle below both the 1D MA50 and 1D MA200 (orange trend-line) as it did on November 02 and March 28 2023.
-------------------------------------------------------------------------------
** Please LIKE 👍, FOLLOW ✅, SHARE 🙌 and COMMENT ✍ if you enjoy this idea! Also share your ideas and charts in the comments section below! This is best way to keep it relevant, support us, keep the content here free and allow the idea to reach as many people as possible. **
-------------------------------------------------------------------------------
💸💸💸💸💸💸
👇 👇 👇 👇 👇 👇


VIX explosion is coming Feb 2024 !I've used 3 indicators, namely, MACD, RSI & BB width to show the idea of momentum building up in the background. If VIX spikes that's definitely not a good thing for the markets.
Volatility is a mean reverting animal so its just simple statistics that a big spike is coming.
TIMEFRAME: If vix starts to pop this week, the rally could end 3-4 weeks from now.

Get ready for a volatile 2025Prepare for a volatile 2025 as we witness record highs on the SPX and other "risk-on" indices. The VIX is approaching pre-COVID levels, reminiscent of the period before the unprecedented surge to the 80s on the VIX scale. Inflation is rampant, and the current presidential party aims to curtail bullish market trends and suppress discussions about inflation. Brace yourself for an intriguing year ahead, especially post-earnings.
VIX Stock Chart Fibonacci Analysis 012924Trading Idea
1) Find a FIBO slingshot
2) Check FIBO 61.80% level
3) Entry Point > 14/61.80%
Chart time frame : B
A) 15 min(1W-3M)
B) 1 hr(3M-6M)
C) 4 hr(6M-1year)
D) 1 day(1-3years)
Stock progress : B
A) Keep rising over 61.80% resistance
B) 61.80% resistance
C) Hit the bottom
D) Hit the top
Stocks rise as they rise from support and fall from resistance. Our goal is to find a low support point and enter. It can be referred to as buying at the pullback point. The pullback point can be found with a Fibonacci extension of 61.80%. This is a step to find entry level. 1) Find a triangle (Fibonacci Speed Fan Line) that connects the high (resistance) and low (support) points of the stock in progress, where it is continuously expressed as a Slingshot, 2) and create a Fibonacci extension level for the first rising wave from the start point of slingshot pattern.
When the current price goes over 61.80% level , that can be a good entry point, especially if the SMA 100 and 200 curves are gathered together at 61.80%, it is a very good entry point.
As a great help, tradingview provide these Fibonacci speed fan lines and extension levels with ease. So if you use the Fibonacci fan line, the extension level, and the SMA 100/200 curve well, you can find an entry point for the stock market. At least you have to enter at this low point to avoid trading failure, and if you are skilled at entering this low point, with fibonacci6180 technique, your reading skill to chart will be greatly improved.
If you want to do day trading, please set the time frame to 5 minutes or 15 minutes, and you will see many of the low point of rising stocks.
If want to prefer long term range trading, you can set the time frame to 1 hr or 1 day.

The rise of the SPX If the VIX breaks down this could open the door for the SPX to move higher.
The VIX shows a similar behavior like in the end of May 2023. If it plays out the same, the VIX could break lower, what means the SPX can go higher.
For the SPX there is no resistance above.
According to the fib levels the next targets could be 5.100 and 5.400
Please give me your honest opinions.

VIX Long From Support! Buy!
Hello,Traders!
VIX has retested a
Horizontal support level
Of 12.34$ from where
We are seeing a bullish
Rebound already and
I think that the price
Will go further up
Buy!
Like, comment and subscribe to help us grow!
Check out other forecasts below too!

$VIX within range & bringing this chart back up againWe saw #yield, US #Dollar, & #oil looking decent & trading with some strength. #stocks are a tad weak but so is $VIX.
Want to show this chart again.
CBOE:VIX can trade in the ORANGE support vicinity for 2 years. Every so often it'll have a fast and furious rally.
Seldom does it hit YELLOW support area but when it does, it usually signifies that upcoming spike we just spoke about.

Black Swan Is HereThe BBWP Indicator on the VIX weekly chart suggests a looming 'black swan' event, characterized by a sudden spike in market volatility following a period of calm. This pattern, previously seen before major market shifts like the SVB Bank collapse and COVID, signals an impending rise in the VIX. Current data points to a significant volatility increase starting January 16th, peaking around early March 2024, within a 52-day window. The anticipated increase is around 287.84%, with a potential fluctuation range (standard deviation) of 193.32%. This translates to a VIX range between 25.64 and 76.60, peaking between February 11th and April 3rd, 2024. Historical instances support this forecast, showing substantial VIX rises over varied durations. Investors are advised to stay vigilant and prepare for possible dramatic market changes. In other words, "hold onto your butts."
The raw data for the past six iterations shows that the VIX has increased by 337.27% over 70 days, 52.79% over 21 days, 452.16% over 34 days, 221.04% over 91 days, 588% over 70 days, and 75.75% over 28 days. This data indicates that investors should be cautious and prepare themselves for potential market shifts, as this scenario could represent a significant threat to market stability and profitability.

VIX Stock Chart Fibonacci Analysis 011924Trading Idea
1) Find a FIBO slingshot
2) Check FIBO 61.80% level
3) Entry Point > 14/61.80%
Chart time frame : B
A) 15 min(1W-3M)
B) 1 hr(3M-6M)
C) 4 hr(6M-1year)
D) 1 day(1-3years)
Stock progress : B
A) Keep rising over 61.80% resistance
B) 61.80% resistance
C) Hit the bottom
D) Hit the top
Stocks rise as they rise from support and fall from resistance. Our goal is to find a low support point and enter. It can be referred to as buying at the pullback point. The pullback point can be found with a Fibonacci extension of 61.80%. This is a step to find entry level. 1) Find a triangle (Fibonacci Speed Fan Line) that connects the high (resistance) and low (support) points of the stock in progress, where it is continuously expressed as a Slingshot, 2) and create a Fibonacci extension level for the first rising wave from the start point of slingshot pattern.
When the current price goes over 61.80% level , that can be a good entry point, especially if the SMA 100 and 200 curves are gathered together at 61.80%, it is a very good entry point.
As a great help, tradingview provide these Fibonacci speed fan lines and extension levels with ease. So if you use the Fibonacci fan line, the extension level, and the SMA 100/200 curve well, you can find an entry point for the stock market. At least you have to enter at this low point to avoid trading failure, and if you are skilled at entering this low point, with fibonacci6180 technique, your reading skill to chart will be greatly improved.
If you want to do day trading, please set the time frame to 5 minutes or 15 minutes, and you will see many of the low point of rising stocks.
If want to prefer long term range trading, you can set the time frame to 1 hr or 1 day.

VIX LONG OPTION TRADE (Jan 15)VIX is at key support. The pattern indicates a move to 14ish by the 3rd day is likely. Option is (24th Jan $14 C) Buy after Open on Monday

Flight preparation?VIX has a long gun loading time.
But right now, two oscillators on the weekly chart look very bullish at once.
It would be strange if within a month the gun didn't start firing upwards.
Ok, I can't tell you the exact time frame, probably some day in the fall it will happen.
For comparison, I've indicated similar patterns for winter 2020.
But now the oversold is much more severe according to WT_CROSS.

🔄🌐 Preparing for Market Shifts - Time for Forex 💹🔍8+8 Risks🔄 Preparing for Market Shifts - Time for Forex 🔄
In 2023 I was very much focused on Crypto and especially Bitcoin. It ended upbeing a Great decision.
Bitcoin remains my favorite asset but as a Trader i need to make the first decision right:
What shall i focus on Trading now?
Well, looking at the VIX a shift in our navigational charts could be prudent.
Changing 'Market conditions'? Very likely inbound. Yes...
🌊 Navigating Calm VIX Seas - The Calm Before the Storm 🌊
The unassuming lull on the VIX, marked by a sub-7% hush, is a siren's call.
With economic indicators suggesting a softening of the inflationary winds and a potential ease in rate hikes, the market's next cycle looms on the horizon.
💹 Back to school - Forex Awaits 💹
The pivot to forex is not a retreat but a strategic maneuver. The forex market, with its vast array of currencies, offers a diverse battlefield as we prepare for the next wave of market volatility. It's in these fluid forex waters that we can capitalize on the slightest economic ripples, turning currents into opportunities.
📊 The Forex Advantage - A hedge to Bitcoin and Crypto! 📊
Crypto will remain my favorite arena but Forex trading beckons with its promise of agility and scope, critical in navigating the uncertain tides ahead. The shift to forex and equities signals my readiness to embrace broader markets and old frontiers as we anticipate the VIX's silent warnings of change.
🔍 A Watchful Eye - What can go wrong 🔍
These are the main 8 areas where 'Trouble can Arise':
1. 🇨🇳 China's Challenges: Property Pressure Cooker 🏗️💥
The world economy has 2 lungs, USA and China.
In 2008 the USA Lung got pneumonia.. and i am worried that soon a similar Chinese crisis could follow.
Unlike Westerns, Chinese are savers but still: Chinese growth is worry number one.
2.🗳️ US Elections: Political Pendulum 🎭📊
The US political landscape is a battleground of ideologies, the crowds are fanaticized and these elections smell like TNT. Needless to say it's a Global worry that America has failed to have a Strong Political leader this period. I don't like what i see...this is worry number 2
3.💳 Debt Dynamics: The Global Balancing Act 🌍⚖️
You know what i mean... Is it under control and for how Long? This is worry number 3
4.🌐 World Wars: Geopolitical Flashpoints ⚔️🔴
The grim prospect of war requires a keen eye on safe-haven currencies and risk management. The situation in Ukraine could be ending but Middle East and shipping routes are a ticking bomb. Let's pray for peace
5.🤖 AI's Ambition: Promise or Peril? 🧠💡
Artificial Intelligence advances at breakneck speed, offering innovation but also posing systemic risks if gone awry. AI is faster than we thought and that would pose a new threat. In this section add the possibility of a Global network's failure of some kind and disrupted communications. We depend on the internet.
6.📈 Inflation's Impact: Trade and Turmoil 🚚📉
Disrupted shipping lanes spell trouble for global trade, stoking inflationary fires. As supply chains twist in the winds of change, Forex markets react in real-time, presenting challenges and opportunities amidst the chaos.
7. 💱 USD Currency Supremacy: A Throne Contested 👑🔄
The US dollar's reign as the premier global exchange currency faces tests from rising contenders. The battle for supremacy can redefine currency correlations and demand adaptive trading approaches.
8. 🏦 Banking Sector: The Keystone of Stability 🏛️🚨
We saw what happened last year. Banks can go bust and this is a valid scenario one better be prepared for...just in case!
Another 8 factors could be:
🌿 Environmental Crisis: Disrupted Climate Costs 🌪️📈
🛢️ Energy Market Volatility: Wars over Lithium next? 🔄⛽
🚀 Satellite Security Concerns 🛰️🔒
🌐 Cybersecurity Threats 🔐💻
🌍 The Incontrollable migration Frontier unrests 📉🆕
🏭 Manufacturing Migrations: Shifting Supply Chains 🔄🏭
🧑🤝🧑 Social Instability: The Cost of Inequality 👥💸
🌱 Food Security: Agricultural Anxiety 🌾🚜
As a trader i need to be prepared and I need to be hedged. Time to hedge my Crypto exposure with some FOREX trades this year. ... Just in (8+8) cases!
One Love,
The FXPROFESSOR 💙

VIX Roadmap May 2023Very likely to explode higher post the usual seasonal low in summer although it is in July but this time likely in June
