VIX....nicely set-upVIX typically is not this low and the beauty of it is that it spikes 5-7 times a month about 5%. If you're in the lookout of a nice opportunity, this is nicely set-up atm. It may take a day or two to jump, but rallies typically have a pullback after a few good days. When profit taking hits, and it will come very soon, the VIX will spike again. You can use UVIX! It's the best ETF proxy IMHO if you understand how to use it.
Always do your own due diligence and best of luck!
VXX trade ideas

JUN 24 - SPY VIX DXY GLD USO SPY (4H)
Trend: Bullish
Current price: 604.32
Active resistance block: 604.33
Channel: Rising, intact
Key support: 581.99
📈 Break above 604.33 could trigger fast move toward 610+
🔹 QQQ (4H)
Price: 536.25
Resistance: 536.45
Support: 509.95
Volume: Building under resistance
📊 Breakout expected if 537 is cleared with volume
🔹 VIX (4H)
Level: 13.89
Trend: Bearish
Support: 11.60
🔻 Falling volatility supports continued upside in equities
🔹 BTC/USD (4H)
Price: 105,244
Volatility: 10.14
Rebounding from: Block at 99,914
Institutional CALL flow at 106,512 (+19.3%)
🟢 If BTC holds above 104k, next target is 111,292 block
🔹 US10Y (4H)
Price: 536.45
Testing: Channel resistance
⚠️ Watching for rejection at 540 or breakout toward 550
→ Impacts tech sector positioning
🔹 GLD (4H)
Price: 306.42
Support zone: 305.9
Institutional PUTs around strike 308
🔻 Bearish pressure remains; loss of 305 opens path to 291

Can Geopolitics Redefine Market Risk?The Cboe Volatility Index (VIX), which analysts widely dub the "fear gauge," currently commands significant attention in global financial markets. Its recent surge reflects profound uncertainty, particularly from escalating geopolitical tensions in the Middle East. While the VIX quantifies market expectations for future volatility, its current elevation signals more than mere sentiment. It represents a sophisticated repricing of systemic risk, capturing the implied probability of significant market dislocations. Investors find it an indispensable tool for navigating turbulent periods.
The dramatic escalation of the Iran-Israel proxy conflict into a confrontation, involving the United States, directly fuels this heightened volatility. Israeli airstrikes on Iranian military and nuclear facilities on June 13, 2025, prompted swift Iranian retaliation. Subsequently, on June 22, the U.S. launched "Operation Midnight Hammer," conducting precision strikes on key Iranian nuclear sites. Iran's Foreign Minister immediately declared diplomacy over, holding the U.S. responsible for "dangerous consequences" and vowing further "punishment operations," including a potential closure of the Strait of Hormuz.
This direct U.S. military intervention, particularly targeting nuclear facilities with specialized munitions, fundamentally alters the conflict's risk profile. It moves beyond proxy warfare into a confrontation with potentially existential implications for Iran. The explicit threat to close the Strait of Hormuz, a critical global chokepoint for oil supplies, creates immense uncertainty for energy markets and the broader global economy. While historical VIX spikes from geopolitical events often prove transient, the current situation's unique characteristics introduce a higher degree of systemic risk and unpredictability. The Cboe VVIX Index, measuring the VIX's expected volatility, has also risen to the higher end of its range, signaling deep market uncertainty about the future trajectory of risk itself.
The current environment necessitates a shift from static portfolio management to a dynamic, adaptive approach. Investors must re-evaluate portfolio construction, considering long exposure to volatility through VIX instruments as a hedging mechanism, and increasing allocations to traditional safe havens like U.S. Treasuries and gold. The elevated VVIX implies that even the predictability of market volatility is compromised, demanding a multi-layered risk management strategy. This specific confluence of events might signify a departure from historical patterns of short-lived geopolitical market impacts, suggesting geopolitical risk could become a more ingrained and persistent factor in asset pricing. Vigilance and agile strategies are paramount for navigating this unpredictable landscape.

$VIX - Setting in Higher Lows. End of 2025? TVC:VIX - Setting in Higher Lows.
The VIX is the volatility index, measuring high and low volatility environments in US markets.
🟥 Red zone = Volatility Extremes
🟩 Green Zone = Volatility Lows
Do you track the VIX?

How to use $VIX as a Family Investor?VIX Zones for Family Investors (Fortnightly Review)
1. BTFD Zone (Buy the Fear Dip):
• VIX above 22
• This is a buying opportunity. The higher the VIX, the greater the market fear—take advantage if you have capital available.
2. Cruise Control Zone:
• VIX between 18 and 22
• Do nothing. No buying or selling—just stick to your routine and monitor the market.
3. Profit-Taking Zone:
• VIX below 18
• Consider taking profits from higher-volatility stocks and reallocating to more defensive, large-cap stocks. This helps protect your gains in case of a sudden market drop.

VIX TVC:VIX (4H)
SUP: 18.30 / 16.23
RES: 21.06 / 27.00 / 29.55
Above 21 = short-term panic → targets 23–27
Below 18.30 = volatility crush back to 16–13
Watch the 36–38 GAP if macro risk accelerates.
#VIX #Volatility #Markets

Weekly Volatility Snapshot Good Evening -- Here we are again looking down the barrel of another week tracking the volatility within the broader markets!
Let us begin --
Last week, the TVC:VIX was trending down as the S&P500 rotated upwards making it within 1.43% of highs, before selling off on war conflict news to end the week -- spiking the VIX again. We are now 114 days into the correction with uncertainty still being the only thing that is defined.
However, it does seem that buyers are stepping in during these times of selling off. But, without lifting the uncertainty of trade deals and deadlines or negative news cycles, we could just be locking in a lower high and within another bear market phase.
As we trend into the 2nd half of June, the SP:SPX has an IV (16.18%) entering the week trending 72% to it's yearly range suggesting slightly expensive premium. This is up from 52% IVp last week. Now in comparison to what is happening, HV10 (9.94%) is showing a lower volatility range than stated IV by -6.24%.
This can be important when considering a premium disadvantage with a consolidating VIX under already expensive premium. The 'strength of IV' here is 61% -- and in turn my weighted implied ranges for the week are $5,914.78 - $6,039.16.
If there happens to be a volatility spike this week due to anything out of the blue, we will find our range expanded to long-term trending means of quarterly values, that being HV63 (30.39%). This would create a 'strength of IV' of 188% and a massive spike in the VIX -- respectfully these weighted implied ranges would be $5,786.82 - $6,161.12.
As always, I hope you enjoy the weekly write up and have a great week of trading ranges! Know you ABCs and REMEMBER stay hedged people.
Till next week, CHEERS.

VIX Trade Plan – May 23, 2025⚠️ VIX Trade Plan – May 23, 2025
📊 Instrument: VIX (Volatility Index)
🎯 Strategy: Long Exposure via Direct Shares
📈 Confidence: 70%
📅 Time Horizon: 3–4 Weeks
📌 Technical & Sentiment Snapshot
Price @ Entry: $21.88
Chart Structure:
• M30 / Daily: Bullish – above 10/50/200 EMAs
• Weekly: Mixed, but showing upward bias
• RSI: Neutral to slightly overbought
• MACD: Bullish cross on intraday; flattening on higher timeframes
Volatility Context:
• VIX up +26.9% over 5 days
• Backwardation in VIX futures
• Elevated VIX/VVIX ratio hints at further fear pricing
Headline Risk:
• Geopolitical + macroeconomic uncertainty
• Trade war tensions and surprise policy risk driving implied vol
🔽 TRADE RECOMMENDATION
Parameter Value
🔀 Direction LONG
💵 Entry Price $21.88
🛑 Stop Loss $20.14 (–8%)
🎯 Target Price $25.62 (+17%)
🧮 Size 100 shares
🏦 Risk Level ~1.5% of account
⏰ Entry Timing Market Open
📆 Hold Time 3–4 weeks
🧠 Rationale Behind the Trade
All 5 models agree on a moderately bullish short- to mid-term trend in VIX.
Momentum is supported by:
Rising geopolitical risks
Backwardated futures curve
Technical setups across intraday/daily charts
Entry point near $21.88 gives strong R/R if VIX spikes toward $25–$27 range.
⚠️ Key Risks to Watch
VIX Mean Reversion: VIX tends to drop quickly if risk subsides.
Overbought Intraday: May cause short-term pullbacks even in a bullish context.
Headline Dependency: Any peace deal, central bank surprise, or good news may instantly crush implied vol.
Liquidity Spreads: Use limit orders on open — VIX ETPs (e.g., VXX, UVXY) can see wide bid/ask gaps.
🧾 TRADE_DETAILS (JSON)
json
Copy
Edit
{
"instrument": "VIX",
"direction": "long",
"entry_price": 21.88,
"stop_loss": 20.14,
"take_profit": 25.62,
"size": 100,
"confidence": 0.70,
"entry_timing": "open"
}
💡 If VIX holds above $21.50 with momentum, this setup offers asymmetric upside. Stop placement near $20.14 helps protect against false breakouts or mean reversion traps.

VIX June 2025 Monthly Support & Resistance Lines Valid till EOMOverview:
These purple lines act as Support and resistance lines for VIX for the entire month of June, when the price moves into these lines from the bottom or the top direction. Based on the direction of the price movement, I will take long or short entries in QQQ or SPY.
Trading Timeframes
I usually use 30min candlesticks to swing trade options by holding 2-3 days max. Some can also use 3hr or 4hrs to do 2 weeks max swing trades for massive up or down movements.
I post these 1st week of every month and they are valid till the end of the month.

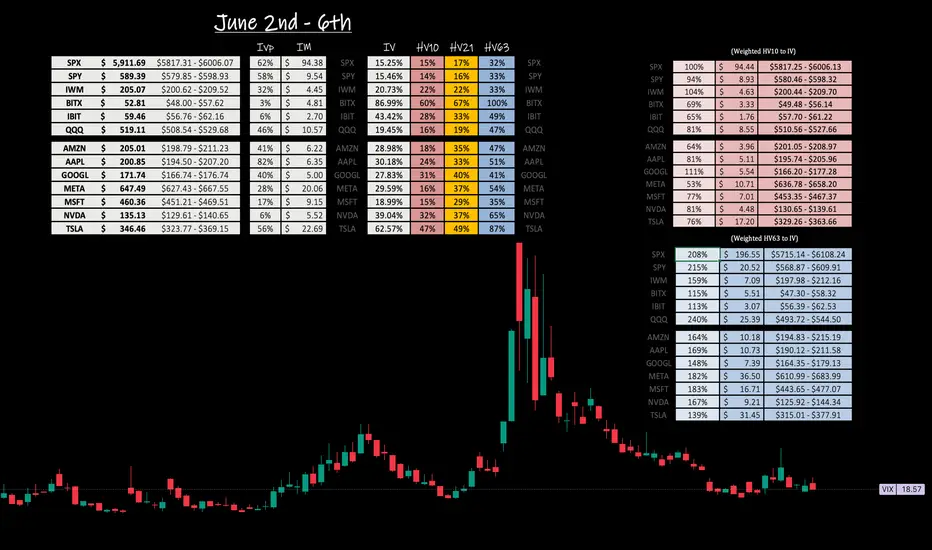
Weekly Volatility SnapshotVolatility, as measured by standard deviation, quantifies market elasticity and provides a level of probability and precision to trade within, that humbles us all.
Last week, the TVC:VIX opened steadily dropping as markets rose into Thursday, (June 5th) where the broader markets drilled within the public drama of Elon Musk and President Trump. Talk about DRAMA -- Lay of the JUICE GUYs. On top of that -- Although there was progress, trade deals are still looming and uncertainty lingers. That day the volatility index closed spiking to $18.46, where it was to start the week -- only to once again have the dip bought right up and the index drops again to close the week at $16.44.
We have now finished our first week of June with markets volatility still contracting as they grind higher. I expect the TVC:VIX to continue lowering softly as markets rotate to new highs this week. When this happens expect IV to lower within the move -- Unless we can see a news catalyst with any progress on trade deals, good or bad, we will see the same movement as last week with individual stocks being rotated.
As we talked about last weekend, we saw NASDAQ:MSFT make a HUGE move! Entering this week HV10 (14.55%) has expanded above HV21 (13.97%) and IV (16.77%) has lowered to it's lowest value in the past year with IVp reaching 0%. Yet still above bi-weekly values.
Looking towards next week, the SP:SPX with IV (13.56%) is still lowering as markets push higher while matching HV10 (13.11%) trending values. These bi-weekly values are of 97% strength of current IV. I believe we will see the target of $6082.71 with even a stretch to HV21 (15.69%) weighted to IV ranges showing potential of $6100.00 this week.
As for our precious BTC funds, NASDAQ:IBIT and CBOE:BITX for 2x leverage, look for my upcoming weekly post on the current state of low IV and the potential expansion overhead to quarterly values. I do currently have open trades and providing transparency within my weekly analysis.
See you back here next week! Same time same place.

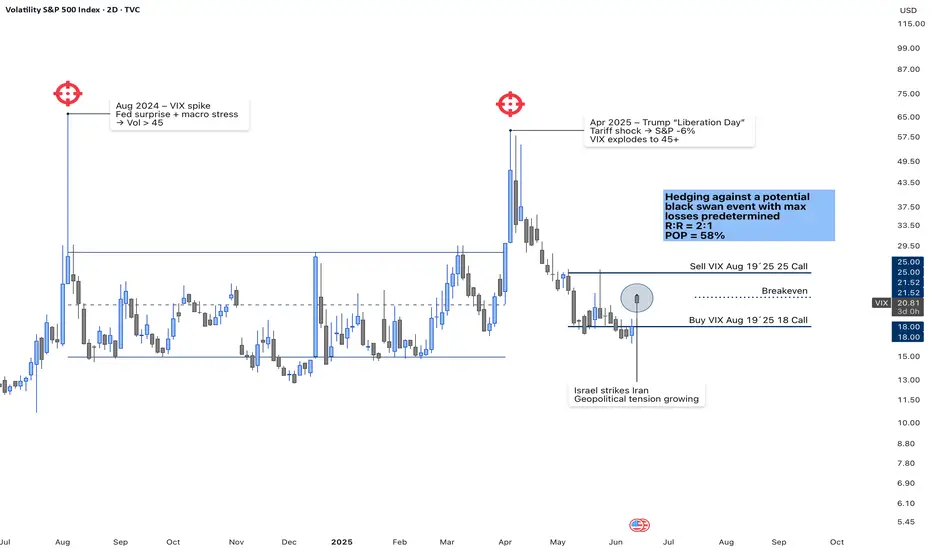
VIX Call Spread – Hedging Against Black Swan Risk (Aug ’25)📌 VIX Vertical Call Spread – Aug 19, 2025 (18/25)
Executed on June 13, 2025
Volatility has compressed near multi-month lows, but the chart shows two major spikes above 45 in less than a year — triggered by macro shocks (Fed surprises, Trump’s “Liberation Day” tariffs, geopolitical escalations like Israel–Iran).
I’m positioning with a long call spread on the VIX (Buy 18C / Sell 25C, exp. Aug 19), structured to hedge against a black swan while maintaining capital discipline.
• Risk/Reward: 2:1
• Probability of Profit (POP): ~58%
• Breakeven: ~21
• Defined risk / Defined reward
• No directional delta risk
I’m not forecasting volatility — I’m accepting that extreme events can (and do) happen. This spread pays off only if volatility spikes again above 21–22 in the next 60 days, which aligns with historical context.
🔒 No need to predict the trigger. Just manage exposure and define your risk upfront.
📈 Follow for more volatility and options setups based on structure + context.
Let’s stay ahead, not reactive.
VIX Call Trade Setup – Volatility Spike or Mean Reversion? (202⚡️ VIX Call Trade Setup – Volatility Spike or Mean Reversion? (2025-06-13)
Ticker: TVC:VIX | Strategy: 🔼 Weekly CALL Option
Bias: Moderately Bullish | Confidence: 65%
Expiration: June 18, 2025 | Entry Timing: Market Open
🔍 Technical & Sentiment Snapshot
• Current Level: ~20.96
• Short-Term Trend: Strong — Price above all EMAs (5m, 30m, Daily)
• Momentum: MACD bullish, 5m RSI >90 (overbought)
• Resistance Zone: $22.00 – $22.56
• Max Pain: $20.00 → potential magnet if reversal kicks in
• Sector Sentiment: S&P downtrend + macro risk keeping VIX supported
• OI Clusters:
– Puts: Heavy at $20.00
– Calls: Building interest at $22.00 and $23.00
🧠 AI Model Summary
✅ Grok + Gemini:
• Bullish bias, expect continued upside
• Favor calls: $22–$23 strikes
• Trade VIX strength on S&P weakness
⚠️ Llama + DeepSeek:
• Mean-reversion view → overbought conditions
• Suggest puts at $20.00 for reversion to max pain
📊 Consensus: Moderately Bullish
→ Ride momentum with tight risk controls
✅ Recommended Trade Plan
🎯 Direction: CALL
📍 Strike: 22.00
📅 Expiry: June 18, 2025 (Weekly)
💵 Entry Price: $0.97
🎯 Profit Target: $1.45 (+50%)
🛑 Stop Loss: $0.73 (–25%)
📏 Size: 1 contract
📈 Confidence: 65%
⏰ Entry Timing: Market Open
⚠️ Risks & Considerations
• RSI >90 → short-term pullback possible
• $22.00 resistance could cap the move
• VIX mean-reverting nature may drag it toward $20.00
• Equity stabilization (e.g. SPY bounce) = bearish for this call trade
• Manage size — weekly VIX options are very volatile
🔥 Volatility trades are fast and furious.
📣 Will VIX explode higher… or revert hard back to $20? Drop your setup below 👇
📲 Follow for daily AI-backed trading plans + option signals.

21 to 24.90 todays moveThis channel is not providing individualized trading or investment advice, nor is it a banking service, brokerage service, trading service, investment service or money management service
Don't get too excited

2-3 days timeframeOn the daily level, we see a 12% risk on the upside, whereas on the downside the risk factor comes in at 9.61% for now. From a risk perspective, resistance on a closing basis stands at 1940, yet the risk on the downside begins at 1560.

Trading the VIXOften dubbed the "fear index," the VIX gauges SPX options' implied volatility, typically rising during equity market declines and vice versa. It quantifies investor anxiety, demand for hedging, and market stress, crucial for traders and risk managers seeking to measure turbulence.
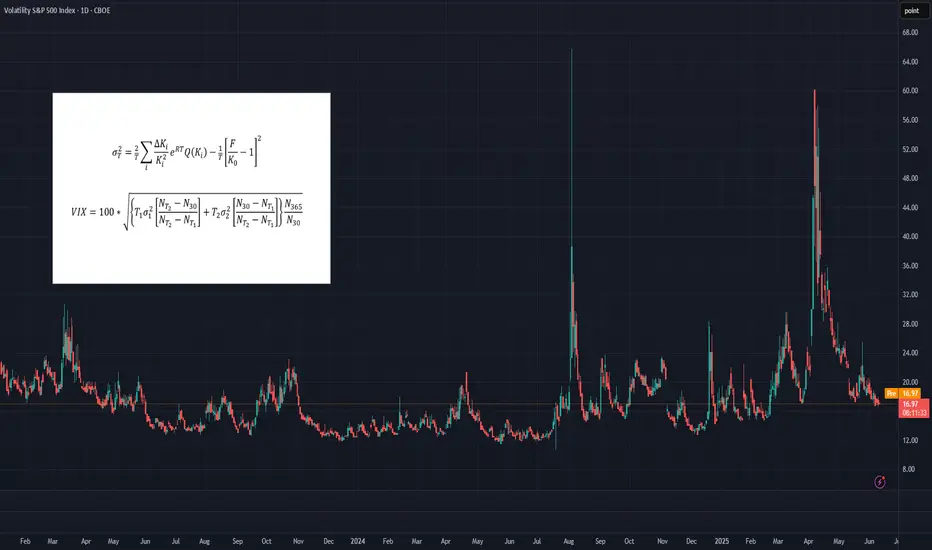
The VIX calculates a constant 30-day implied volatility using SPX options expiring over the next two months. Unlike simple weighted averages of equity indices, its methodology is more complex, involving implied variance calculation for the two nearest monthly expirations across all strikes. For detailed formulas, refer to the introductory chart or visit the CBOE’s official VIX Index page.
While the VIX Index itself isn’t tradable, exposure can be gained through VIX futures or exchange-traded products (ETPs) like VXX, UVXY, and SVXY. However, these instruments come with their own unique risks, pricing behaviors, and structural nuances, which can make directional VIX trading considerably more complex than it might initially appear.
What You Need to Know About Implied Volatilities
• In calm or uptrending markets, the volatility curve typically slopes upward (contango), indicating higher implied volatility with longer maturities.
• In declining or turbulent markets, the curve can invert, sloping downward (backwardation), as shorter-term implied volatilities rise sharply.
• This pattern can be observed, comparing VIX9D, VIX, and VIX3M against the SPX. In stable markets: VIX9D < VIX < VIX3M. In stressed markets, this relationship may reverse. The VIX9D and VIX3M are the 9-day respectively 3-month equivalent to the 30-day VIX.
What You Need to Know About VIX Futures
• When the volatility spot curve is in contango, the VIX futures curve will also slope upward.
• In backwardation, the futures curve slopes downward, reflecting heightened short-term volatility and short-term volatility spikes.
• While in contango, VIX futures "roll down the curve," meaning that—independent of changes in volatility—futures tend to decline in value over time.
• In backwardation, the opposite occurs: futures "roll up the curve," potentially rising in value over time even without volatility changes.
• VIX futures’ responsiveness to VIX Index movements – the beta of VIX futures against the VIX index - declines with longer expirations; front-month futures may react to 70-80% of VIX changes, compared to 40-60% for third or fourth-month futures.
Key Consequences for Traders
• Directional trading of VIX futures can be strongly influenced by the shape of the futures curve.
• Contango in low-VIX environments creates strong headwinds for long VIX futures positions, caused by the “roll-down-effect”.
• Conversely, backwardation in high-VIX environments creates headwinds for short positions.
• These effects are more pronounced in front-month contracts, making timing (entry and exit) for directional trades critical.
• There's a trade-off in directional strategies: front-month futures offer greater exposure to VIX movements but suffer more from negative roll effects.
How to Trade VIX Futures
• Due to these structural challenges, directional VIX futures trading is difficult and requires precision.
• A more effective approach is to trade changes in the shape of the futures curve using calendar spreads (e.g., long VX1, short VX2). This reduces the impact of roll effects on individual contracts.
• In low-VIX, contango conditions, a rising VIX typically leads to VX1 increasing faster than VX2, widening the VX1–VX2 spread—an opportunity for spread trading.
• While VX1 may initially suffer more from roll-down than VX2, this can reverse as the VIX rises and VX1 begins to “roll up,” especially when VIX > VX1 but VX1 < VX2.
• The opposite dynamic applies in high-VIX, backwardation environments.
• More broadly, changes in the shape of the futures curve across the first 6–8 months can be profitably traded using calendar spreads. Roll-effects and the declining beta-curve can also be efficiently traded.
How to capture the Roll-Down-Effect
One of the more popular VIX-trading strategies involves capturing the roll-down effect,, while the curve is in contango. It is a positive carry strategy that is best applied during calm or uptrending market conditions. Here’s a straightforward set of guidelines to implement the Roll-Down-Carry trade:
• Entry Condition: Initiate during calm market conditions, ideally when VIX9D-index is below VIX-index (though not guaranteed).
• Choosing Futures: Use VX1 and VX2 for calendar spreads if VX1 has more than 8-10 trading days left; otherwise, consider VX2 and VX3.
• Spread Analysis: Short VX1 and long VX2 if VX1–VIX spread is larger than VX2–VX1; otherwise, VX2 and VX3 may be suitable.
• Contango Effect: VX1’s roll-down effect typically outweighs VX2’s during contango.
• Relative Beta: VX1 shows higher reactivity to VIX changes compared to VX2, mimicking a slight short position on VIX.
• Exit Strategy: Use spread values, take-profit (TP), and stop-loss (SL); consider exiting if VIX9D crosses over VIX.
________________________________________
Conclusion
Directional trading of the VIX Index—typically through futures—demands precise timing and a good understanding of the volatility curve. This is because curve dynamics such as contango and backwardation can create significant headwinds or tailwinds, often working against a trader’s position regardless of the VIX’s actual movement. As a result, purely directional trades are not only difficult to time but also structurally disadvantaged in many market environments.
A more strategic and sustainable approach is to trade calendar spreads, which involves taking offsetting positions in VIX futures of different maturities. This method helps neutralize the impact of the curve's overall slope and focuses instead on relative changes between expirations. While it doesn’t eliminate all risk, calendar spread trading significantly reduces the drag from roll effects and still offers numerous opportunities to profit from shifts in market sentiment, volatility expectations, and changes in the shape of the futures curve.
What else can be done with VIX instruments
VIX indices across different maturities (VIX9D, VIX, VIX3M), along with VIX futures, offer valuable insights and potential entry signals for trading SPX or SPX options. In Part 2 of the Trading the VIX series, we’ll explore how to use these tools—along with VIX-based ETPs—for structured trading strategies.
Long Opportunity as VIX Signals Potential Upside Amidst Falling - Key Insights: The VIX remains subdued, suggesting prevailing bullish sentiment
across equity markets. However, technical signals such as the falling wedge
pattern indicate a potential breakout upward, highlighting latent market
risks. Traders should consider taking a proactive long position to hedge
against anticipated volatility spikes, especially if geopolitical risks or
macroeconomic triggers re-emerge.
- Price Targets:
- Target 1 (T1): $17.85
- Target 2 (T2): $18.50
- Stop Level 1 (S1): $16.15
- Stop Level 2 (S2): $15.85
- Recent Performance: The VIX has steadily declined, breaking below
psychological resistance levels like $20 and stabilizing in the current
range of $15-$20. This reflects diminished market fear as equity indices
continue to rise. Historically, periods of low VIX readings have often been
followed by spikes driven by sudden risk-off sentiment.
- Expert Analysis: Analysts agree that while the current VIX level indicates
reduced fear, it may be giving investors a false sense of security.
Technical analysis suggests that the formation of the falling wedge pattern
could lead to upward price action, consistent with historical instances of a
volatility surge. Market sentiment appears optimistic, but caution is
warranted as the potential catalysts for a breakout remain unpredictable.
- News Impact: The current market calm suggests no immediate shocks or
surprises, but potential triggers such as central bank policy updates,
inflation concerns, or geopolitical tensions could shift sentiment and
amplify volatility. Traders should stay vigilant for macroeconomic data
releases and earnings reports in the upcoming week that could act as
catalysts for VIX movement.
VIX Pump Incoming!The last three big rallies on the NASDAQ were initiated by large volatility spikes on the VIX.
Followed by an average decline of 32%.
Following the NAS tanking 26% from Feb to April 25, Price has already entered into a support zone on the VIX, which has triggered all 3 of the last crashes.
The NAS rally since the April 7th 25 has been on DECLINING VOLUME on the Daily Chart.
This post is not attempting to be a BULL vs BEAR debate. Or is it an attempt to prove or disprove any particular trading strategy. You do you and trade what you see and keep winning....
BUT
From a Macro perspective, speculating on pivot points requires much deeper MTF analysis and confluence than simple trendlines, H or L indications or RSI readings.
This is an elementary attempt at macro liquidity mapping using NAS volume and VIX volatility as an compass.
With all that said, the likelihood of a sustained rally from here looks very low IMHO...
As a minimum, ALL OF THE GAPS FROM APRIL 7TH will need to be filled IMHO

Weekly Volatility Snapshot Volatility, as measured by standard deviation, quantifies market elasticity and provides a level of probability and precision to trade within, that humbles us all.
Last week, the TVC:VIX opened above $21.00 and closed just under $19.00 for a near flat week even for all the eventful action that took place. That being once again, tariff related news with the court of international trade overriding Trump's liberation day, only to have the administration appeal, and the tariffs to be reinstated the following day.
This provided for quite a volatile move, mostly in after hours with everything closing strong to end the month.
As we look towards June starting with next week, just about all indices I track and the magnificent seven are showing near term trending volatility contracting under stated IV, as IV is melting across the board. Notable mention to NASDAQ:NVDA NASDAQ:MSFT NASDAQ:IBIT and CBOE:BITX for all entering the week with great IV value, now let's compare them to their respective trending bi-weekly values to observe what is being predicted to what is happening with near term trending volatility.
NASDAQ:NVDA at a 6% IVp enters the week with an IV of 39.04% -- HV10 (31.70%) is 81% strength of current IV and resonating under monthly values. When you see a large move, that being from the earnings report last week, you will see a massive IV melt to save premium against the PA move due to the beats or misses. With that said, bi-weekly values are just off yearly lows (25.74%) as IV chases it down and i see the underlying as 94.03% coiled for a volatility swing.
NASDAQ:MSFT at a 17% IVp enters the week with an IV of 18.99% -- HV10 (14.55%) is 77% strength of current IV and resonating deeply under monthly values. Bi-weekly yearly lows of 8.56% reflect a coiling of 90.03% at current values.
With both of these, I am looking for a volatility bounce, and regression back to quarterly means. That's where the real fun is and if played right provide excellent opportunity. For further discussion around BITSTAMP:BTCUSD within the funds NASDAQ:IBIT and CBOE:BITX look for my more dedicated posts this weekend.
For those interested in volatility analysis and the application of weighted HV ranges to IV, I encourage you to BOOST and share this post, leave a comment, or follow me to join me on this journey.
We will weekly analyze our ranges under the year-to-date VIX chart and engage in discussions as people please. So hop on board and come along for the ride!
24.9This channel is not providing individualized trading or investment advice, nor is it a banking service, brokerage service, trading service, investment service or money management service

VIX US100 CFD SP CFDIn case of an upward movement in the Vix fear index, a correction may come from the US 100 22.153 SP500 CFD 6110 Level. In possible pullbacks, take profit can be made from 8 ema according to your risk understanding.

$VIX target $88-103TVC:VIX looks to be bottoming here and I think the next move higher is going to be the big one I've been waiting for.
We did well last month catching that move into April 7th via UVXY calls. I started buying calls again April 24th for 5/30 - 6/20 and have continued buying as VIX has declined.
Now the chart is finally looking like it's bottoming and I'm getting short signals on a lot of the charts -- therefore my conviction is growing that we're close to a reversal here.
I think this move will be a move that happens once every 10+ years and the gains have the potential to be massive if it happens.
Let's see if it plays out.

Quiet before the storm: $VIX eerily at low levels. TVC:VIX since the unusual April spike to 60 has been making new lows. It is surprisingly coincidental that the S&P 500 bottomed at 4900 @ which is 0.618 Fib retracement level if we chart the Fib level form the August 2024 spike to the lows of the Nov 2024. Since Feb 2025 highs have come down to 17. With VIX at 17 and SP:SPX almost 6000 which is 2.5% away from Feb 2025 ATH. And the disturbing part is that the TVC:VIX is very quietly going lower.
So how does the future look like. VIX can go down to the lows of 16 before it breaks down below the upward sloping. This can result in violent reversal. The reversal can result in that TVC:VIX spikes to levels of 24 and next level 32. TVC:VIX above 32 is always a very good opportunity to buy $SPX. There you have my suggestion for the pair trade.
Verdict : TVC:VIX can spike to 24 or 32 if the reversal trade takes hold. Go long SP:SPX with TVC:VIX @ 32.

45.09 by first week of junThis channel is not providing individualized trading or investment advice, nor is it a banking service, brokerage service, trading service, investment service or money management service
