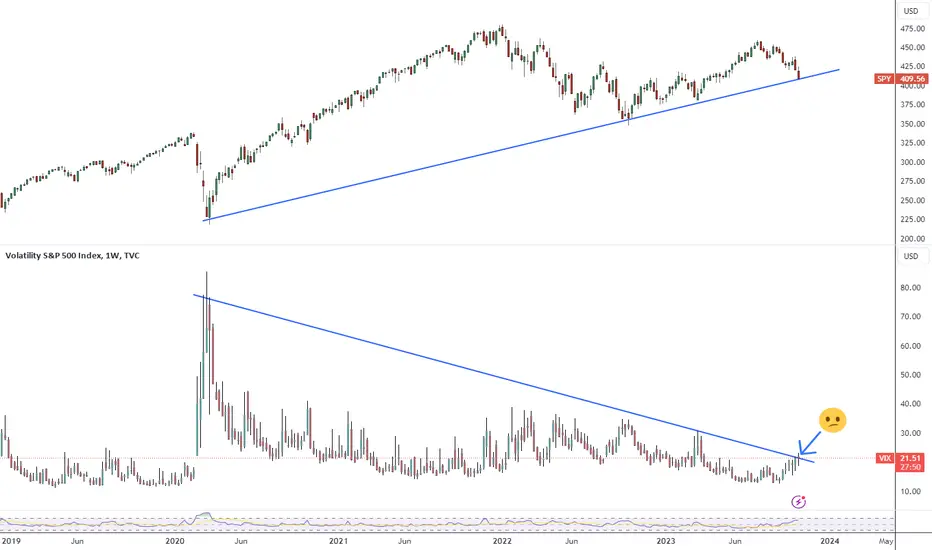
Moment of truthIs VIX breaking out? SPY hit very hard the support trendline, is like it wants break it down. I think we will have a bloody battle at this level, a lot of volatility. Several attempts to break the support. If it breaks it at first attempt, that's it, crash will come. I'm holding my longs and selling covered calls, I'm not selling anything, actually I'm buying stocks and selling calls. Just bought Intel and Newmont yesterday. If crash happens, it will probably last a few months, I'm ok with that. In the mean time I'm selling calls and collect dividends. I will only sell stocks that I don't like much, only a few ones.
VXX trade ideas
VIX iH&S. Is it coming time of max fearLooks like VIX Volatily Index is ready to reverse, which could indicate lot of fear in stock and indices market. Inverted head and shoulder, right shoulder in formation, could trigger any moment.

VIX - High Volatility coming?Think that in the next days with with the last (maybe) raise in interest rates the markets will start to discount on the effects that high interest rates >5.25% (maybe on Thursday) will have on the markets.

VIX - A storm is brewingTVC:VIX may have reached a significant bottom during today's volatile trading session. As seen below, the recent rug pull shown on the 1D chart has finally concluded; almost to the exact penny.
When we step back and look at the weekly timeframe, VIX is currently bouncing higher off of a major bullish divergence that was built up over the past several months.
The RSI is also retesting the neutral line (50) and TVC:VIX itself has closed on a major support level.
If TVC:VIX continues its move higher next week, we could see a significant drop in the S&P500
Disclaimer:
Any information contained within this post does not constitute any financial, investment, or trading advice. Trade or invest at your own risk.


Volatility will continue to pick up Remember periods of contraction lead to periods of expansion. Periods of low volatility lead to periods of high volitility!

Time for Volatility? Matching up with the sell signals on indices we have support levels in the VIX.
Maybe it's time for something interesting.
The things of the scope I am talking usually come with news.

$VIX showing topping signsVery important to keep eye on the $VIX.
So far today we have a HUGE reversal AND a possible Bearish Engulfing.
SP:SPX AMEX:SPY #SPX #SPY #VIX
#stocks #StockMarket

VIX Clears 20-21, On Capitulation WatchAfter the VIX sagged to under 13 at times in the third quarter, October has brought about the bears and higher volatility, as if on seasonal cue. The S&P 500 peaked in late July right when many mega-cap tech stocks reported second-quarter earnings results. The AI-fueled rally that gave equities legs following the SVB crisis in mid-March finally lost steam.
The S&P 500 is now a stone's throw away from "correction territory" off the 4607 rebound peak a few months ago. The psychological level to watch is 4146 (-10%). As of this writing, equity futures point to an SPX near 4200 - below its rising 200-day moving average and testing the breakout point from late May. What could surprise some bulls would be a break under 4200 followed by a snapback higher.
All eyes are on the VIX. Wall Street's "fear gauge" has jumped to 23 this morning. While not screaming panic, the Volatility Index is at its loftiest level since March. The Q3 high of 31 could be in play, but I also notice that a series of lower highs has been the trend since way back in January of 2022 (39). Thus, it's reasonable to assert that the high 20s on the VIX could be the peak this go around. Of course, bullish stock seasonality really takes hold following this week (though pre-election years tend to see somewhat weaker Novembers compared to all years).

Incoming VIX liquidityI'm expecting a great deal of volatility in the coming weeks with the VIX having broken a key psychological level, created a CHoCH, and continued rising, leaving behind some liquidity in the FVG-W below. LOTS of liquidity lies above at the daily and H4 levels and the VIX is likely to reach for these levels.
Why is this important? Well VIX and most indices (DAX, DOW, NAS in particular) move contratrend to the VIX, and so if the VIX is trending bullish, I'd expect these to (continue to) trend bearish. With NAS, price is currently b/w the 70.5 and 61.8 monthly Fib levels, a key bearish signal, headed towards liquidity resting in the FVG-M below. The same is true for DAX, which has already pierced the FVG-M. DOW is also in a strong bearish trend, but price is already resting between the 61.8 and 50.0 monthly Fib levels. As a result of this, I am strongly bearish on indices for the upcoming week, and will be looking for reactions(institutional sponsorship) on the H1 & m15 for entries on the m5/m3/m1, but please note that actual execution will rely on time and price. Happy Trading 😋
W1 VIX:
H4 VIX:
M1 DAX:
H4 DAX:
M1 DOW:
H4 DOW:
M1 NAS:
H4 NAS:

VIXFinally closed above the trendline after a few weeks of indecision. Get ready for some volatility if VIX is above the black line. I don't make the rules.

VIX WILL NEED TO BE 25.80 AND BACK TO FEE BONDSWhile a rising VIX might suggest a short-term boost for bonds due to the flight to safety, other overriding factors can influence the bond market.
It's always essential to view these dynamics in the broader context of global economic and geopolitical events.

VIX model appears to be nearing completionLooks like we have an upside target of either 20.37 or 21.3 for VIX model to complete its move to the upside - expect to see in conjunction with new lows on SPX and QQQ to complete the wave 2 decline

VIX long term WAVE C down will be UGLY once wave B is topI think all should understand that I am looking for that last short squeeze in the markets and NOT by any mean a new Bull market . My view is based on DATA of 123 yrs NOT wishful thinking . way too many of you have not lived thru a true bear market I have lived thru 5 and this will be my 6th I have studied Every bear market I will warning all a second time this is the last leg up . and if you do not want to be holding on with loses for 3 to 5 years use the last wave up to take advantage of the yields in 2 yr paper or just stay in 30 to 90 tbills the return will be one as the market is going to drop .382 of the whole move up 1974 or 2009 both will be very painful


Vix potential highBank earnings out today, Jamie Diamond interview : he said " now may be the most dangerous time in decades" Earnings have bheld up by the stimulus packages that are still being allocated into the market.
But that's just a temporary fix.
And quantitative tightening. Has countered fiscal spending a complete waste in my opinion. But that's what happens when there is an election where one side doesn't concede to the other. And vice versa, a matter that remains unresolved. It's like asking your wife for a divorce or husband ,either way, and they refuse a sign that divorce decree and instead go on a shopping spree. Then they decide to.
Bring along with them, their friends in China and Japan, who also print money.
One because China reopand has not recovered completely in Japan. Governor Corona retired finally.
They don't call him the Widowmaker for nothing. The biggest impact leaf's cost strategy implemented by krota. That's akin too, Cato and Pink Panther. They should do a parod one by Prince called p**** control. They should call it Yield curve control, LOL.

Bullish reversed Head & Shoulders on VIXThe VIX seems to have validated a bullish pattern, the reversed Head & Shoulders with a target around 27 and intermediate resistance with the line linking the tops near 24.
Only a break below the shoulders level around 15 would invalidate this view.

Volatility is about to increase massivelyLooking on the VIX, we can see a huge bullish divergence in CumDelta.
With the Volatility Index reaching an important support level, we can expect a massive rise within the next days.
Be careful and happy trading!

VIX: Has everyone already got longs? =)There is a double bottom on the chart. It's time for the markets to correct. Implementation time issue.
All successful transactions and profit. If you liked it - subscribe.

VIX repeating patterns in 2020 to 2023VIX has been repeating the same pattern of descending triangles and breakout in 2020 and 2023.

VIX SELLERS WILL DOMINATE THE MARKET|SHORT
Hello,Friends!
Previous week’s green candle means that for us the VIX pair is in the uptrend. And the current movement leg was also up but the resistance line will be hit soon and upper BB band proximity will signal an overbought condition so we will go for a counter-trend short trade with the target being at 11.48.
✅LIKE AND COMMENT MY IDEAS✅

🟥 NEW LOW on IWC - Market Commentary⬇️ IWC NEW LOW
The microcap ETF (IWC) has made a new low. This is not good at all. On the good side we did close up on the day - so we can call this a Rally Day and wait for a Follow Through Day (FTD).
↗️ WAITING FOR FTD
SPX is sitting on the 200D Moving Average and Nasdaq s on day 6 of its Rally Day (marketd as RD on the chart). We are waiting for those FTDs in order to get into the action on the long side.
😰 FEAR NEEDS TO PICK UP
The VIX like I said in my previous note, to print a picture perfect bottoming action, would need to double its low of 16, meaning a shakeout with VIX jumping to 24 would be a positive sign.
👨👨👧👦 SENTIMENT
Sentiment is horribly bad - which is so negative it could be showing a market bottom. The chart below shows the % of stocks above the 50D (pane1), 200D (pane2) and the VIX (pane3). Only 32% of the stocks are above 200D which is v. bearish. Why we look at this? Because any real bull market would require participation from more than 7 mega cap stocks in order to be a) strong and b) lasting. Otherwise it is a very thin market - which is not healthy.
🚽 FLUSH POSSIBILTY
I am cautious also that because the last couple of days we are seeing dislocations in relationships that are actually correlated *historically*. I am refering to interest, forex, utilities, bonds, commodities and so on. E.g. Oil broke down and the interest rates and the dollar went up. When this has happened historically there are a higher chance of a flush occuring. The probability is stacking but it would be a black swan. For the newbies a flush is a mini-crash.
📅 STAY ALERT
REMEMBER We are always 4-5 days away to a new Bull Market. This is the time to keep your eye on the market. Know what the leading RS names are.
Also we are about to enter earning season. Be cautious. My strategy is to never go into an earnings event unless I have enough profit to justify the implied volatility.

"Aggressive" VIX Short/ES Long SetupPossible volatility short/equities long shaping up. Still a lot of downside momentum/catching a bit of a falling knife + we'd rather see the NQ fill its gap south of 14400, but it could be time to start thinking about index longs given the levels both stocks and vol are approaching. Given that the Nasdaq still has further to fall before completing its gap fill, the ES could easily continue its decline (watch support/resistance levels ~4200). Something to keep in mind... Personally, we are waiting for confirmation entries before buying (looking for trend reversal signals on small timeframes), but more aggressive traders may find existing conditions more suitable for starter positions. Targeting is loosely based off of the red ES zones, but can also be mechanically derived and should be refined. Good luck!
JHart @ LionHart Trading
