The Calm Before the StormAs of June 2, 2025, the CBOE Volatility Index ( TVC:VIX ) is trading at 18.89, showing a 1.72% increase from the previous close . This uptick suggests that market participants are beginning to price in heightened uncertainty.
Technical Patterns: TVC:VIX has been forming a base around the 18–19 level. A sustained move above 20 could signal a significant breakout, potentially leading to a rapid escalation in volatility.
Market Catalysts:
Trade Tensions: Escalating trade disputes, particularly between the U.S. and China, are contributing to market jitters.
Federal Reserve Stance: The Fed maintains a cautious approach, with interest rates holding steady amid concerns over inflation and economic growth.
Upcoming Economic Data: Anticipated releases, including employment and inflation reports, could introduce additional volatility.
The current market environment, characterized by geopolitical tensions and cautious monetary policy, sets the stage for increased volatility. Traders should monitor TVC:VIX closely, as a breakout could present opportunities for strategic positioning.
VXX trade ideas
Weekly Volatility SnapshotVolatility, expressed through standard deviation, quantifies market elasticity and presents a level of probability and precision that humbles us all.
In my analysis, I track trending volatility to discern historical patterns (HV) and utilize them to anticipate future outcomes (IV). This weighted indicator provides a comprehensive and accurate range for observation.
When trending historical volatility expands or contracts around implied volatility, price action can be interpreted as positively or negatively compounded within the predicted implied range.
I measure this concept using the ‘strength’ of IV and calculate my implied range based on the current market elasticity. This system is adaptable to any IV condition, as it allows for a fair assessment of market movements and potential outcomes.
__________________________________
Last week, volatility increased slightly as bi-weekly trends picked up over monthly values -- the same near term trends with the major indices show strength within 8% of IV into this next week.
One thing to note: NASDAQ:MSFT NASDAQ:NVDA and NASDAQ:TSLA all show near term contraction under stated IV within the magnificent 7 while the rest show shorter term volatility as expansive.
What do you think the CBOE:VIX will do this next week?
___________________________________
For those interested in volatility analysis and the application of my system using weighted HV ranges to IV, I encourage you to BOOST and share this post, leave a comment, or follow me to join me on this journey!
We will weekly analyze our ranges under the VIX and engage in discussions.

VIX | Nov 19, 2025 Call Options | Strike $21TVC:VIX , the great "fear" index, has two looming price gaps on the daily chart. Every gap has always been filled in the history of the $TVC:VIX. Given the 90-day tariff pauses and forever world turmoil, there will (undoubtedly), be a spike in the TVC:VIX to close these open gaps. It's just a matter of timing... I've chosen to go 6 months out on the option date (November 19, 2025) as a hedge to my portfolio ($3.45 per contract). I plan to add more contracts if the TVC:VIX dips into the 13-14 area, too.
I truly dislike timing the market, but such a position could be a nice 3x gainer of the TVC:VIX spikes to $36 in short time. Or... totally worthless if we are in a constant bullish market for the next 6 months.
Time will tell.

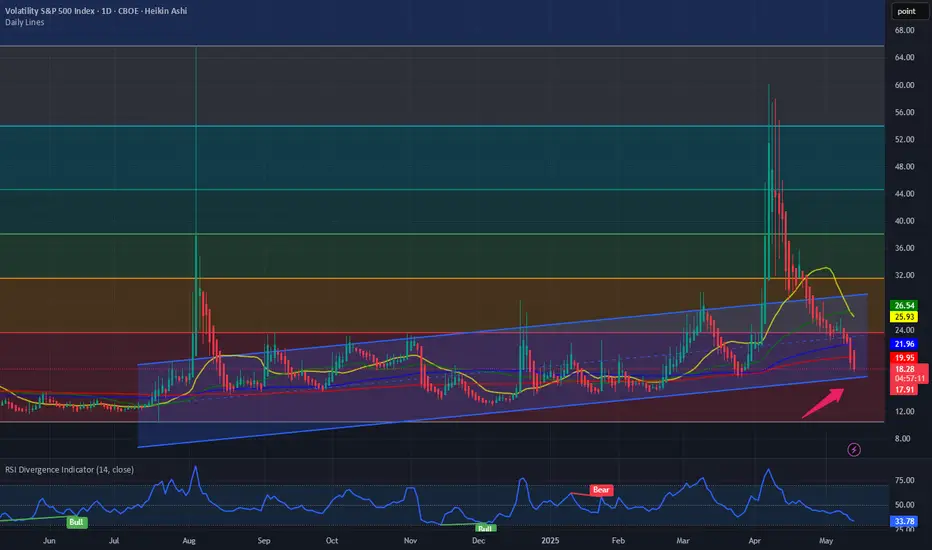
VIX SPY500 forecast until end of June 2025VIX S&P500 Index is in reversal. Downward movement has ended. Uptrend is starting now. All the way until end of June 2025 VIX will grow and steadily and surely.
Bottom is now at 18.18 and possible interim top is at 36.54
This view is supported by my forecast of S&P500 for June 2025.
For more updates on 1D chart click social media links in my profile.

We need to close above 15.40 on weeklyThis channel is not providing individualized trading or investment advice, nor is it a banking service, brokerage service, trading service, investment service or money management service

By breaking the downtrend, it seems that crypto will reach its dThis indicator is a guide for risky assets. I imagine such a channel. Given the positive gap, I think the channel will be broken and this failure will lead to a decline in risky assets like crypto.

Weekly Volatility SnapshotVolatility, expressed through standard deviation, quantifies market elasticity and presents a level of probability and precision that humbles us all.
In my analysis, I track trending volatility to discern historical patterns (HV) and utilize them to anticipate future outcomes (IV). This weighted indicator provides a comprehensive and accurate range for observation.
When trending historical volatility expands or contracts around implied volatility, price action can be interpreted as positively or negatively compounded within the predicted implied range.
I measure this concept using the ‘strength’ of IV and calculate my implied range based on the current market elasticity. This system is adaptable to any IV condition, as it allows for a fair assessment of market movements and potential outcomes.
What’s most important about what I track in this is that as trending markets contract, they coil, and in turn violently release in a regression back to our quarterly trending means.
This to me, is what it is all about.
For those interested in volatility analysis and the application of weighted HV ranges to IV, I encourage you to BOOST and share this post, leave a comment, or follow me to join us on this journey.
We will weekly analyze our ranges under the VIX and engage in discussions. So come along for the ride!
TVC:VIX

VIX | Stock Market Correction IncomingVIX is the ticker symbol and the popular name for the Chicago Board Options Exchange's CBOE Volatility Index, a popular measure of the stock market's expectation of volatility based on S&P 500 index options. It is calculated and disseminated on a real-time basis by the CBOE, and is often referred to as the fear index or fear gauge.
The VIX traces its origin to the financial economics research of Menachem Brenner and Dan Galai. In a series of papers beginning in 1989, Brenner and Galai proposed the creation of a series of volatility indices, beginning with an index on stock market volatility, and moving to interest rate and foreign exchange rate volatility.

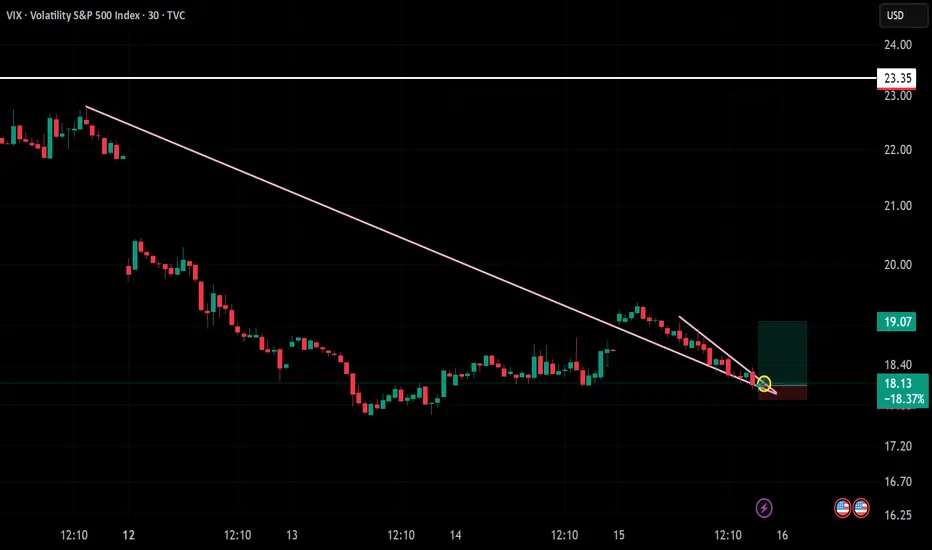
Long Trade Setup – VIX (30-Min Chart)!📈
🔹 Pattern: Falling Wedge Breakout
🔹 Entry: $18.11 (Breakout confirmation)
🔹 Target: $19.07 (Next resistance zone)
🔹 Stop-Loss: Just below $18.00
🔹 Risk-Reward: Favorable upside with breakout momentum
🔥 Caption Idea (with curiosity + clarity):
VIX breakout loading? Volatility waking up!
Falling wedge breaks – is fear rising again?
Best Hashtags:
#VIX #VolatilityIndex #BreakoutTrade #FallingWedge #StockMarketAnalysis #LongTrade #TechnicalAnalysis
Watch the weekly close above 19.10, 18.04, 15.40This channel is not providing individualized trading or investment advice, nor is it a banking service, brokerage service, trading service, investment service or money management service

$VIX: Where does VIX go from here? Happy Tuesday. A new week, new market KPIs to look at. Since the ‘Liberation Day’ VIX spike to 50 it has been a bear market for VIX and has been going down since then. Since then, the S&P had more than 11 day of positive close for the day. This is which we would expect when VIX is making new lower highs and lower lows. But where does the VIX go from here?
It has been a remarkable trade to buy the indexes NASDAQ:QQQ and SP:SPX when the TVC:VIX is at or above 30. And then unwinding the trade when TVC:VIX touches 15. We have more than 10 days of positive closes in SP:SPX and the TVC:VIX is at 17. So we might have some more positive return in the near term. And then we rinse and repeat the same trade. Sell the indices when TVC:VIX touches 15 or lower band of this upward sloping channel.
Verdict: Stay long until TVC:VIX @ 15. Unwind trade and then wait for TVC:VIX @ 30.
VIX at Support: Are Stocks and Bitcoin in Trouble?The VIX Chart Breakdown
I’m looking at a 4-hour VIX chart spanning late 2022 to today, May 12, 2025. The VIX is currently sitting at 20.41, right at a key support level within a long-term curved channel (around 20). Earlier this year, we saw a massive spike to 54, signaling major market fear, but it’s since cooled off. Historically, when the VIX hits this support and reverses upward, volatility tends to rise, which often means trouble for risk assets like stocks and crypto.
What Happens If the VIX Reverses?
The VIX has a strong inverse relationship with the S&P 500—when the VIX goes up, stocks typically go down as fear creeps into the market. We’ve seen this play out before: that spike to 54 earlier this year coincided with a rough patch for the S&P 500. If the VIX bounces from its current support at 20 and climbs above 28-30, we could see renewed pressure on stocks in the short term.
What Should You Watch For?
VIX Levels: If the VIX breaks above 28-30, expect increased market stress, which could drag stocks and Bitcoin lower.
Stocks: The S&P 500 may face a short-term pullback if volatility spikes, but historical patterns show these dips often lead to market bottoms, followed by recoveries.
Bitcoin: Despite today’s dump, long-term forecasts remain bullish, with projections of $100,481 to $136,438 by the end of 2025, driven by ETF inflows and adoption. A VIX spike might create a buying opportunity if you’re a long-term holder.
The Bottom Line
Right now, the VIX at 20.41 isn’t screaming danger, but a reversal from this support could bring short-term pain for stocks and Bitcoin. Keep an eye on the VIX—if it starts climbing, brace for volatility. That said, these spikes often set the stage for recoveries, so don’t panic. For Bitcoin, today’s dump hurts, but the long-term outlook is still strong. Stay informed, manage your risk, and let’s see how this plays out!

Move until 45.70This channel is not providing individualized trading or investment advice, nor is it a banking service, brokerage service, trading service, investment service or money management service.


VIX looks close to jumping up.MACD on daily looking to reverse, RSI has been in oversold territory, this is just on a daily though so not necessarily a guaranteed reversal but it seems to be getting support.

Decoding the VIX Crab Head and Shoulders.The formation of the butterfly pattern mentioned in the previous idea is quite intriguing! As we discussed before, the VIX index level of 28-29 is as a crucial threshold for our Crab strategy.
Currently, we are witnessing the development of a head and shoulders pattern within this butterfly formation, which adds an exciting layer to our analysis.
It's fascinating to see how these technical indicators can guide our trading decisions, and I hope you're as enthusiastic about this potential opportunity as I am! Let's keep an eye on these patterns and see how they unfold in the coming days.


VIX: Risk On?As of May 2, 2025, TVC:VIX has broken another support level, currently sitting at 22.63 with a -1.61% drop on the 4H chart. It is trading near a demand zone (22.00–22.34), but price action shows no bullish conviction. With multiple Break of Structure (BoS) events to the downside and no significant bullish order blocks holding, volatility appears to be compressing further.
Meanwhile, AMEX:IWM (Russell 2000 ETF) has broken out of a bull flag and reclaimed the 9EMA and anchored VWAP bands from the April decline. It's up 2.29% on the day and targeting resistance zones between 201.21 and 212.33.
🧠 **Interpretation**:
- Market sentiment shifting risk-on.
- Volatility compression aligned with bullish equity breakout.
- Expect continued downside in TVC:VIX unless geopolitical/fundamental catalysts spike fear.
🎯 ** TVC:VIX Bearish Probability: 65%**
📌 Watch zones: 21.50 for next liquidity grab, 27–30 zone for potential mean reversion if market reverses.
#VIX #IWM #Volatility #TechnicalAnalysis #SmartMoneyConcepts #LuxAlgo #WaverVanir

VIX stock Chart Fibonacci Analysis 042925Trading Idea
1) Find a FIBO slingshot
2) Check FIBO 61.80% level
3) Entry Point > 24/61.80%
Chart time frame: B
A) 15 min(1W-3M)
B) 1 hr(3M-6M)
C) 4 hr(6M-1year)
D) 1 day(1-3years)
Stock progress: C
A) Keep rising over 61.80% resistance
B) 61.80% resistance
C) 61.80% support
D) Hit the bottom
E) Hit the top
Stocks rise as they rise from support and fall from resistance. Our goal is to find a low support point and enter. It can be referred to as buying at the pullback point. The pullback point can be found with a Fibonacci extension of 61.80%. This is a step to find entry level. 1) Find a triangle (Fibonacci Speed Fan Line) that connects the high (resistance) and low (support) points of the stock in progress, where it is continuously expressed as a Slingshot, 2) and create a Fibonacci extension level for the first rising wave from the start point of slingshot pattern.
When the current price goes over 61.80% level , that can be a good entry point, especially if the SMA 100 and 200 curves are gathered together at 61.80%, it is a very good entry point.
As a great help, tradingview provides these Fibonacci speed fan lines and extension levels with ease. So if you use the Fibonacci fan line, the extension level, and the SMA 100/200 curve well, you can find an entry point for the stock market. At least you have to enter at this low point to avoid trading failure, and if you are skilled at entering this low point, with fibonacci6180 technique, your reading skill to chart will be greatly improved.
If you want to do day trading, please set the time frame to 5 minutes or 15 minutes, and you will see many of the low point of rising stocks.
If want to prefer long term range trading, you can set the time frame to 1 hr or 1 day.

VIX Bullish Watch OutBased on Chart current at P. High (Previous High) Act as strong support I strongly believe VIX will go Up and market will go Down from here.
Significant Resistance are P. High and Take Profit Lines.
Once Resistance reached Watch out for VIX going down.
Once VIX Down Market Is Up and Vice Versa Watch out.
Take Care.

Panic day today This channel is not providing individualized trading or investment advice, nor is it a banking service, brokerage service, trading service, investment service or money management service.

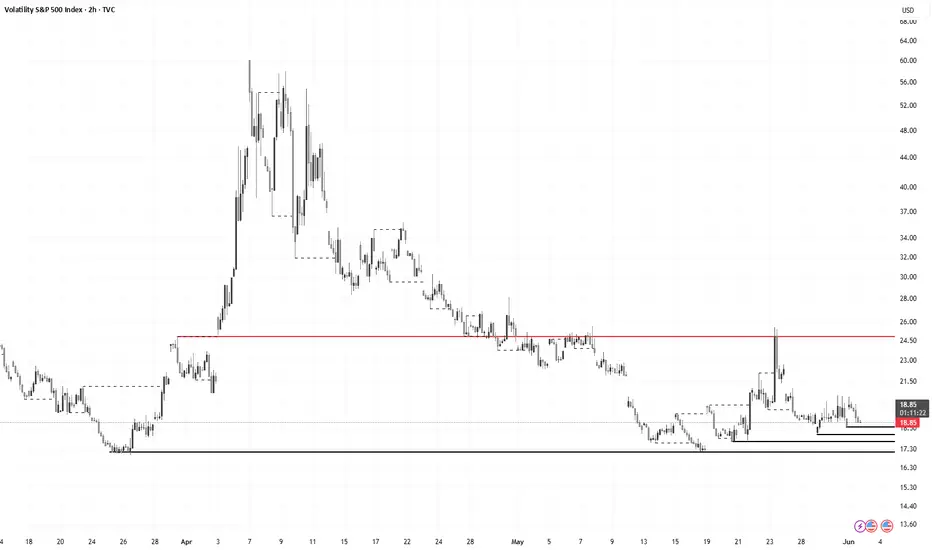
VIX Set Up for a Big Move: Aggressive Institutional Call BuyingSummary:
The VIX has officially broken major resistance, and institutional players are making large bets on rising volatility over the next 1–2 months. The combination of the technical breakout and heavy call buying strongly suggests a potential VIX surge toward 30–35.
🔥 Technical Analysis:
Key Resistance at 23.50 (red line) was cleanly broken and is now acting as support.
VIX currently at 25.16, maintaining position above all key short-term moving averages.
Price is sandwiched between the 50 EMA (26.22) and 23.50 support, suggesting coiled energy ready to break either direction — currently favoring the upside.
RSI remains neutral at ~45, meaning plenty of room for volatility expansion without technical exhaustion.
Past behavior shows that after VIX clears major resistance and holds, sharp expansions typically follow.
📊 Institutional Option Flow:
Today's VIX option flow highlights aggressive accumulation of May calls:
12,000 contracts bought on 21 Strike Calls (May 21 expiration) — $4.08M bet.
8,000 contracts bought on 22 Strike Calls (May 21 expiration) — $2.28M bet.
Significant accumulation at the 30 Strike Calls across multiple timestamps — over $3M total premium.
Additional layering into higher strikes for June and July expirations (34C, 40C, 60C, 70C), indicating expectations for extreme moves.
💬 Key Insight:
These are large block trades, aggressively executed at the ask, suggesting real conviction rather than passive hedging.
🚀 Projected Outlook:
Level Importance
23.50 Confirmed support after breakout
26.22 (50 EMA) Minor resistance — currently being tested
29.41 (20 EMA) Short-term breakout target
30–35 zone Primary upside target if VIX momentum continues
If VIX sustains above 23.50 and breaks the 50 EMA cleanly, we can expect a fast push to the 30–35 range, especially if external catalysts (economic data, geopolitical risk) align.
📣 Final Thoughts:
The technical setup and the institutional option flow are both aligned — something that doesn't happen often.
Volatility is coiling above support, and big money is positioning for an explosive move.
Whether you're managing risk or looking for opportunity, it's time to pay attention to volatility.
✍️ Chart and flow analysis by @brownian. Thank goodness I am not your financial advisor, else you would be living in your car.
📅 April 28, 2025
#Volatility #VIX #OptionsFlow #TechnicalAnalysis #EMAAnalysis #TradingView #QQQ #SPY #SPX #NASDAQ
NASDAQ:QQQ
AMEX:SPY

VIX Breakout Trade: Targeting 31.22!🚀 📈
Description:
Today, I spotted a bullish breakout on VIX from a falling wedge pattern.
Entry is around 25.05, with a stop-loss below 24.00.
First target is 28.18, second target is 31.22.
High risk-reward setup as volatility may surge!
Always manage risk carefully. 📊
