SNTBTC trade ideas

Status Prints Multiple Bullish Signals | 77%+Status (SNTBTC) printed multiple bullish signals and is now starting to grow... Let's take a quick look at those.
Status (SNTBTC) Bullish Signals
First we have the classic break of EMA10 and EMA50 (yellow line), our main indicators for bullish/bearish potential.
We can notice a bullish divergence between SNTBTC price and the MACD (marked with a purple line).
Bull volume increasing.
Reversal candlestick printed (marked with yellow circle).
Strong RSI (above 50).
These signals are telling me that SNTBTC can easily move higher... The magenta dashed lines on the chart are the targets for this move.
If prices move lower, support can/will be found on the dashed blue lines.
Thanks a lot for reading.
This is Alan Masters.
Namaste.

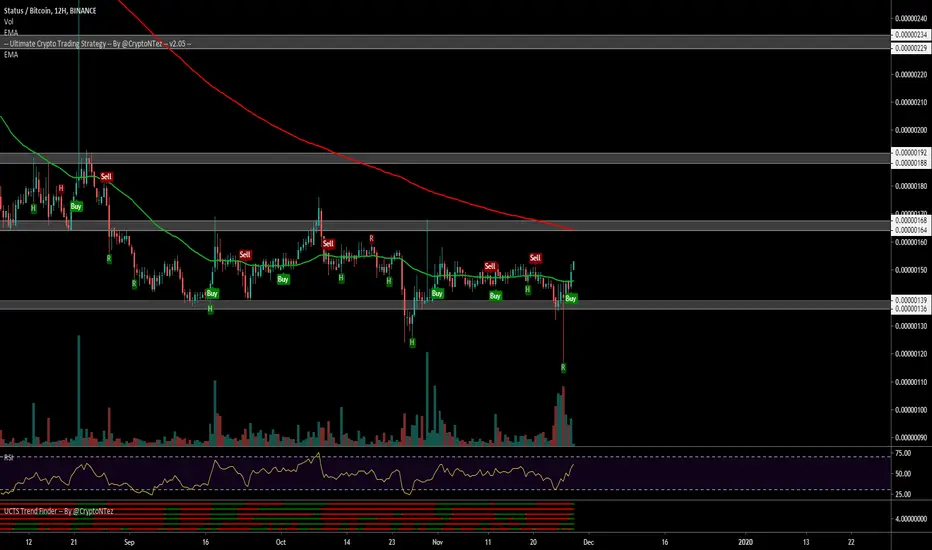
$SNT, Similar structure to what it showed at October end..$SNT
Similar structure to what it showed at October end..
Pushing with increasing volume from ATL BTC support level, crossing above EMA50 & UCTS Buy signal on the 12H chart..
OBV showing a bullish divergence
As targets ~164 sats (10%)
Tight SL just in case =)
#SNT

#SNTBTC (Short Term) 11/19 #SNTBTC (Short Term)
Buy : 0.00000150 - 0.00000146 - 0.00000143
Target 1: 0.00000155
Target 2: 0.00000163
Target 3: 0.00000188
Target 4: 0.00000225
Stoploss: 0.00000139
Invest: 3%
Risk/Reward: 5% / 50%
we ask Allah reconcile and repay


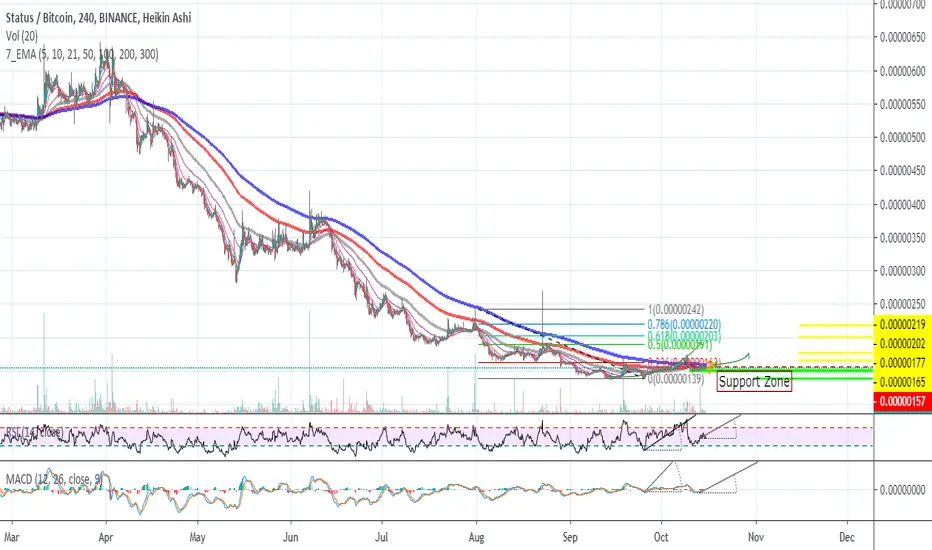
SNT: waiting for breakoutSNT/BTC pair is waiting for breakout while it is currently consolidating in daily timeframe. Critical points to watch on its resistance and support levels are as follows:
support: 142/143
TP 1 = 160
TP 2 = 169
TP 3 = 188
Sell wall at 147/148 as psychological area needs to break before reaching another resistance area as stated above.

SNTBTC ~Huge retracement, Rising RSI, tightening Gaussian channel, thin ichimoku cloud. Nice purchase going into a possible alt season.


SNTBTC formed bullish Shark | A good long opportunityPriceline of Status / Bitcoin cryptocurrency has formed a bullish Shark pattern and entered in potential reversal zone.
This PRZ area should be used as stop loss in case of complete candle stick closes below this zone.
I have used Fibonacci sequence to set the targets:
Buy between: 0.00000146 to 0.00000144
Sell between: 0.00000149 to 0.00000155
Regards,
Atif Akbar (moon333)


SNT-Status is Showing Great Potential Bull Run-Early CallBINANCE:SNTBTC SNT is showing Great Bull in Short to Mid run.
All targets are mentioned in the Chart.
Accumulate Between 151 and 156.
We are also going to see EMa Crossover withing few Hours.
Indicators are looking Pretty nice Give this token a little time breakout upwards.
$SNT, Crossing above ~165 sats level (& EMA50) w/ volume$SNT
Crossing above ~165 sats level (& EMA50) w/ slightly increasing volume
Aiming for a retest of this level as a flip (& potential entry if it hodls), buying as close as possible to invalidation level is key for a good risk management
As targets ~190sats matching EMA200
#SNT


Status (Sept 18) #SNT $SNT #BTC $BTCBuy : Close to 150 as possible
Sell : 170-195-220
Mid-Hold : 280-350-440
Stop : 135

SNT/BTCHave a look at EMA and gain a 10% profit. Bearish trendline is broken and pullback has completed.

SNT breakout finallyentry 188-190
Targets on chart
Stop 179 (tight 183)
Reasons
Descending channel breakout
Above 200 ema on 4hr
above 0.236 fib
volume spiked

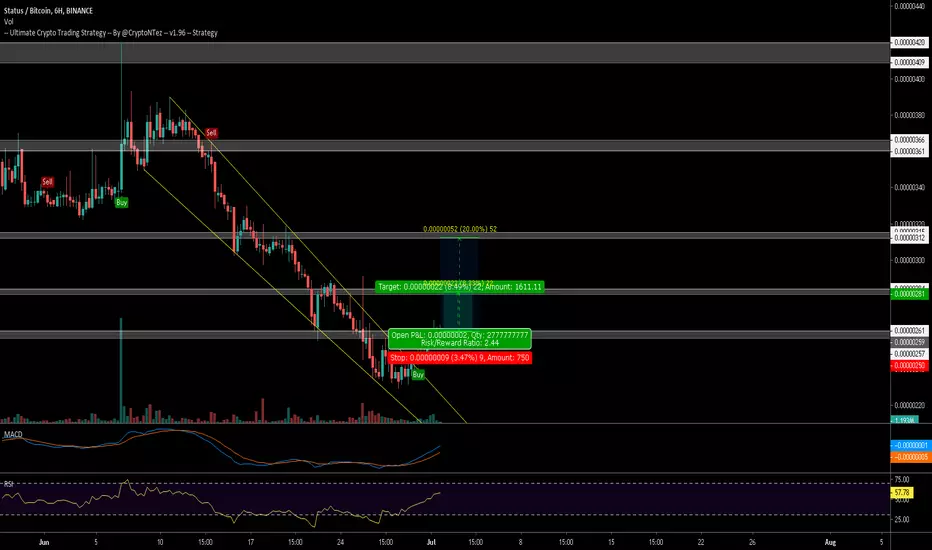
$SNT, breaking from descending trendline w/ increasing volume..$SNT Same setup than many other Alts today, breaking from descending trendline w/ increasing volume at resistance (~260sats)
If manage to break from here, 1st target at 281sats and 312sats as 2nd target...
UCTS Buy signal on the 6H chart
Please, use a tight SL just in case
#SNT
SNT Ready to give!SNT has broken above the MA10 and has a good amount of volume, MACD good, RSI is Bullish.
Good profits to gain on SNT...

