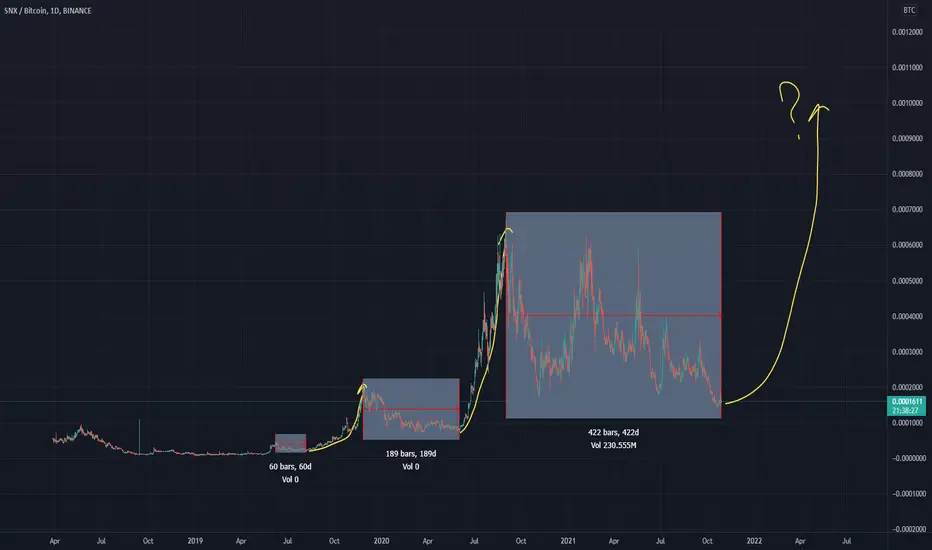
Synthetix | Same Chart As Status, Dynamics Explained (1400% Pot)The intelligent reader will notice that we are looking at the same chart pattern as we saw recently with SNTBTC. I made the same drawings on purpose.
We are looking at Synthetix vs Bitcoin (SNXBTC) long-term.
The bottom was hit July 2024. This is an important bit of information. This is because there was a major crash in early August. The fact that this pair bottomed before this date signals there is buying/activity behind the scenes.
The "All-Time Low" here is the price at which SNXBTC traded back in 2019. This chart does not show this data.
The "bearish impulse," left side, is a huge wave. This impulse is followed by a long-term distribution channel. The channel breaks down leading to a new major low. The last drop is really steep, straight down. A steep and fast drop can lead to a strong and fast recovery.
The strategy is simple: Buy and hold.
➖ If prices move lower, wait patiently until everything turns green. It can be years or months.
➖ If prices move up, enjoy the earnings and follow your "selling for profits" strategy on the way up.
Whichever strategy you use is up to you. The most important part is to buy low, "a great entry," timing; once in and green, it is easy to win.
Follow me and succeed.
Thanks a lot for your continued support.
Namaste.
SNXBTC trade ideas

Synthetix Long-Term Higher Lows (100-171% Growth Potential)Synthetix (SNXBTC) has been producing higher lows since June 2023. You know what we say, higher lows lead to higher highs; long-term higher lows will lead to long-term higher highs.
On top of the obvious rounded bottom and higher lows, we have the falling wedge, very strong daily candle and volume breakout.
These are simple signals but combined they become strong signals.
👉 Easy we can see 100% growth, this is no standard.
👉 Additional, a mild higher high can lead to 170%.
More is possible long-term.
Namaste.

✳️ Synthetix Bullish Continuation = Bullish Confirmation (80%+)Synthetix (SNXBTC) today confirms its bullish bias by producing a strong breakout above EMA300 and MA200.
Bullish continuation = bullish confirmation. 😉
It is now confirmed, once more, that the bulls own this market.
You can expect much more growth.
You can read the 'Related Ideas' below for the previous charts and also to find AGIXBTC which can help you determine how far up SNXBTC will go.
To know how far up the USDT pairs will go, check FETUSDT.
I hope that helps.
Namaste.

$SNX/#BTC [#Synthetix]: SuperTrend BBand_Breakout◳◱ We've detected both a Bollinger Band breakout and a Super Trend pattern on the $SNX / $BTC chart. Both indicators are signaling a bullish trend, with the Bollinger Band indicating a potential bullish trend as the price has moved outside of the upper band and the Super Trend showing a bullish trend. This is a stronger bullish signal as both indicators are aligned. It may be a good idea to consider buying at the current price zone and targeting higher levels. Our analysis indicates that the key resistance levels are at 0.0001216 | 0.0001297 | 0.0001481 and the major support zones are at 0.0001032 | 0.0000929 | 0.0000745. However, it is still important to consider other factors such as overall market conditions, and other technical indicators before making a trade decision.
◰◲ General info :
▣ Name: Synthetix
▣ Rank: 77
▣ Category/Sector: Financial - Derivatives
▣ Overview: Background details for Synthetix project are currently unavailable.
◰◲ Technical Metrics :
▣ Mrkt Price: 0.0001128 ₿
▣ 24HVol: 7.905 ₿
▣ 24H Chng: 4.93%
▣ 7-Days Chng: -4.82%
▣ 1-Month Chng: 7.34%
▣ 3-Months Chng: 60.08%
◲◰ Pivot Points - Levels :
◥ Resistance: 0.0001216 | 0.0001297 | 0.0001481
◢ Support: 0.0001032 | 0.0000929 | 0.0000745
◱◳ Indicators recommendation :
▣ Oscillators: NEUTRAL
▣ Moving Averages: STRONG_BUY
◰◲ Technical Indicators Summary : BUY
◲◰ Sharpe Ratios :
▣ Last 30D: 0.79
▣ Last 90D: 2.06
▣ Last 1-Y: 0.36
▣ Last 3-Y: 0.72
◲◰ Volatility :
▣ Last 30D: 1.21
▣ Last 90D: 1.01
▣ Last 1-Y: 1.46
▣ Last 3-Y: 1.68
◳◰ Market Sentiment Index :
▣ News sentiment score is N/A
▣ Twitter sentiment score is 0.56 - Bullish
▣ Reddit sentiment score is 0.28 - Very Bearish
▣ In-depth SNXBTC technical analysis on Tradingview TA page
▣ What do you think of this analysis? Share your insights and let's discuss in the comments below. Your like, follow and support would be greatly appreciated!
◲ Disclaimer
Please note that the information and publications provided are for informational purposes only and should not be construed as financial, investment, trading, or any other type of advice or recommendation. We encourage you to conduct your own research and consult with a qualified professional before making any financial decisions. The use of the information provided is solely at your own risk.
▣ Welcome to the home of charting big: TradingView
Benefit from a ton of financial analysis features, instruments and data. Have a look around, and if you do choose to go with an upgraded plan, you'll get up to $30.
Discover it here - affiliate link -

✳️ Started From The Bottom Now... | Synthetix Network TokenSynthetix Network Token has been moving at bottom prices since December 2021.
Even better, SNXBTC peaked January 2021, more than two years ago. This is great news because we started at the bottom and now we are up, the same can happen to Synthetix.
After being/moving near the bottom for so long, we can easily see prices moving up.
Not a guess, not a prediction but the translations of the codes we call candles and indicators that are displayed on this chart.
Namaste.

SNXBTC - Critical Point, Breakout or Fakeout?We're at quite an interesting point with SNXBTC right now, sat on top of what was a strong descending paralled channel after a breakout of the aforementioned channel, or is that a fakeout? That is the question!
After the break of this channel the price has since dropped back and is now ready to either head up to the next level of resistance, or drop back into the channel and continue ranging through this area.
We've got a nice level of support on the underside but if the price os truly trending in this channel we could see this level get broken as the market pushed further south.
If you enjoyed or agree with this idea - drop us a comment, like & follow! :)

Synthetix (SNX) formed bullish BAT | A good buy opportunityHi dear friends, hope you are well and welcome to the new update on Synthetix ( SNX ) token with BTC pair.
On a 4-hr time frame, SNX has formed a bullish BAT move.
Note: Above idea is for educational purpose only. It is advised to diversify and strictly follow the stop loss, and don't get stuck with trade

✳️ Synthetix vs Bitcoin Also Looks Good For Easy 100%SNXBTC has the same chart as everything else in this market... Follow me!
A long-term higher low, Dec. vs June 2022.
Strong RSI near support.
Trading above EMA10.
After the big altcoins grow, it is time for the small ones to follow.
We were expecting for everything to grow and these charts are pointing to just that.
Expect the BTC pairs to move ahead.
Not only this one, I saw many, many others with similar charts.
The growth can happen fast.
Big strong candles... Be prepared.
Set your sell order on target before the action starts.
Do not wait to sell manually, build a plan and deploy it.
Namaste.

Synthetix (SNX) forming bullish BAT for upto 17% moveHi dear friends, hope you are well and welcome to the new update on Synthetix ( SNX ) token with BTC pair.
On a daily time frame, SNX is about to complete the final leg of bullish BAT move.
Note: Above idea is for educational purpose only. It is advised to diversify and strictly follow the stop loss, and don't get stuck with trade

Synthetix (SNX) / BTC -On the above 1-day chart price action has corrected almost 70% (currently 50%) with a ‘incredible buy’ signal printed towards the end of July. A number of reasons now exist to be bullish, they include:
1) Price action breaks out of resistance after 110 days.
2) Higher lows printing across numerous oscillators - excellent.
3) Bullish engulfing candle prints at breakout. Look left.
4) Dragonfly DOJI prints on 2-week chart (below). Have talked about them before on other $/BTC ideas. Not often you see them on BTC charts, but when you do… Do not ignore, they be powerful.
Is it possible price action falls further? Sure.
Is it probable? Very unlikely.
1st target 6k sats.
WW
2-week chart

SNX.BTC (Y22.P3.E1). Last effort before breaking down Hi All,
The chart says it all.
Look for the pullback to the 618 fib for the last rally entry and then looking to short.
Neckline rejection happened, a 2nd attempt will fall short and down we go.
All the best,
S.SAri
or double bottom

spot buy SNXBTC pair I have bought some SNX (btc pair) too beside my other spot which I wrote in the previous analysis (FLOW). Target and Stoploss are shown on the chart. Let's see what happens...

#SNX/BTC - Long - Potential 14.20%#SNX/BTC - Long - Potential 14.20%
Exchanges: Binance, KuCoin, Huobi.pro, Bittrex
Signal Type: Regular (Long)
Entry Targets:
1) 0.0001561- 100.0%
Take-Profit Targets:
1) 0.0001590 - 33.333%
2) 0.0001699 - 33.333%
3) 0.0001783 - 33.333%
Stop Targets:
1) 0.0001490 - 100.0%
Entry Trigger - Pullback to Trendbreak
Trailing Configuration:
Entry: Percentage (0.0%)
Take-Profit: Percentage (1.0%)
Stop: Breakeven -
Trigger: Target (1)


SNX end of corrective wave?Just want to leave TA for posterity.
RSI seems to have bottom out. Inferior lvl of the current channel.
I've painted with colours so i can identify the currelation with RSI indicator.
Added some SNX. Who knows..
NFA

#snxbtcafter long time down trend #SNXBTC ready for break out
entries and targets are in pictures
be patient and risk management

SNXBTCSNX shows a very good chart and I think we can trust SNX and publicly we see a positive movement in the coming days


SNX, the healthy correctionThis is a really a healthy correction.
This is good for a the next pump who could to be very big. :)
SNXBTC gearing up. Cup and Handle Looking at SNXBTC market pair, a Classical cup and Handle is forming on 4h chart.
Targets 0.0002258
0.0002403
0.0002507
0.0002762
0.0003000
0.0003200

Double Bullish Divergence on weekly Looking at the Macd and RSI for SNX/BTC, we can see a set up for bullish price movement.

SNX/BTC buy opportunityHi followers,
BINANCE:SNXBTC may be ready for another nice move up,
after period of sideways consolidation, higher lows, buying power stepping in.
Don't forget to manage your risk! 👌
Good luck and trade with care 🙏
If you like my content - 👍 Like, 💬 comment, 👆 follow and 👉 share!
❗❗❗
Disclaimer: This information is not a recommendation to BUY or SELL. It is to be used for educational purposes only!
