SNXUSDT trade ideas

SNX 1DA beautiful diametric pattern has completed and now we expect to see a price to rise in the next few months to 6$


$SNX #SNX | LTF LONGGreen box and EQ might be worked as a support level .
The bottom of the red box, liquidity zone and around 1.95 will be the points I will observe as resistance.
With the loss of 1.7 (1H) , the first bounce of the price will be around 1.61 .
I wish everyone a good week.


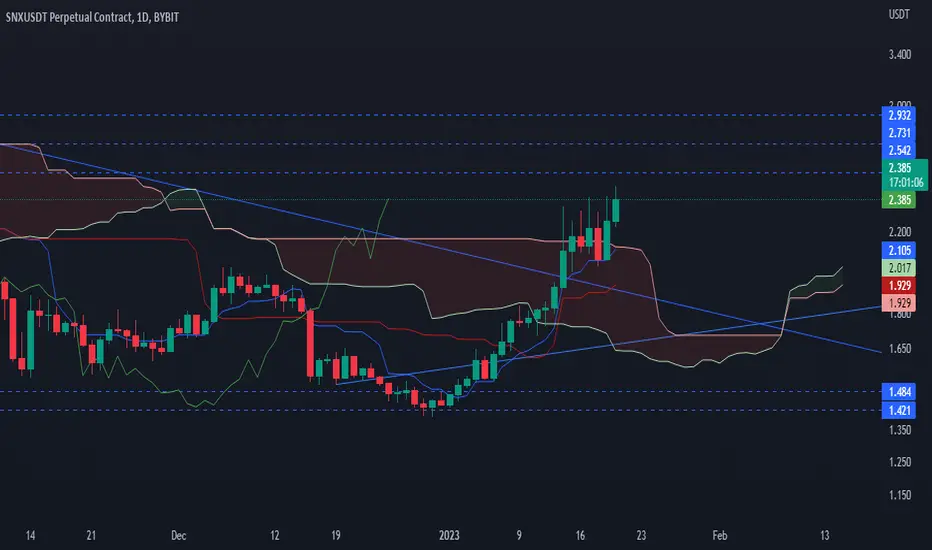
#Synthetix Expanding with Rising Volumes, Resistance at $2.05Past Performance of Synthetix
Synthetix is up 46 percent from the December low and relatively stable, checking the performance in the daily chart. As asset prices soar, SNX is stagnant, trading below the $2.05 resistance level. Even so, the leg up in the past few days places buyers at a pole position for a breakout toward new Q1 2023 highs.
#Synthetix Technical Analysis
Traders are upbeat, expecting more. In the daily chart, SNX traders may look for more gains in the days ahead. Notice that losses of December 16 have been reversed at the back of increasing trading volumes. This is a net positive from an effort versus result perspective, a refreshing development after losses in 2022. Given that SNX bars align along the upper BB and the coin above December 16 highs, every low provides an opportunity for optimistic traders to load the dips, targeting $2.05. Unexpected contractions pushing SNX below $1.50 and the middle BB nullify this bullish outlook.
What to Expect from #SNX?
SNX prices are stable, but volatility is low. The upside momentum is strong, with signs that Synthetix could break above $2.05 in continuation of gains traced to late December. As it is, SNX is firm as long as prices are above the middle BB and $1.50.
Resistance level to watch out for: $2.05
Support level to watch out for: $1.50
Disclaimer: Opinions expressed are not investment advice. Do your research.

SNX Bullish CrabBullish Crab , posting here just for purpose of observing bullish structures failing in a bigger bear trend

SNXUSDT | LONG ON BREAKOUTSNX has been trading in a bearish trend .
The bearish trend was well respected by falling resistance .
The price has been making lower lows and lower highs.
Now after taking support from horizontal zone, the price has broken above the falling resistance .
The bulls can take complete control above the falling resistance
Manage your levels accordingly.

ECHO BUBBLE SNX giving nice signals for some upside:
-Good reaction at lower range
-3 macd BULLISH DIVERGENCES
50% upside
-20% stop losss

SNX : Update VIEWSNX showing an interesting view for a low time frame, with the possibility that SNX can target $1.97 coming time.
we will follow the coin to see if it can get confirmed.
checking also if this coin is able to become a day changer coin.

SNXUSDT - Long by Supertrend, ADX & MA 1/5/20231. ADX INDICATOR: 1h & 4h timeframe have a strong strength for open trade.
- ADX smoothing: 14.
- DI length: 14.
- ADX STRONG > 25.
2. SUPERTREND INDICATOR:
- Long trend when closes candle is above the green line.
3. MOVING AVERAGE INDICATOR:50
- Long trend when closes candle is above MA line.
- BUY/LONG: reject to Supertrend at current timeframe.

SNXUSDT SNXUSDT making bearish bat harmonic .
Target mentioned in the chart .
Risk manage is must before entry .
1 percent risk is perfect
Because market is chip chop .

LONGWith a breach of the downtrend and its retest, + a small uptrend and a strong support level, + long-term divergences !!
you may not always get all these signals at once.

snx usdtThis page is made solely for displaying price information and the status of the projects in the market, and does not mean investment or approval of the project

long SNX$SNX broke through the descending trendline. Bullish movement to resistance level at 1.64$ is likely to happen.

SNXUSDT | SETUPSNX has been trading in a bearish trend .
The price has now broken above the falling resistance.
The price is now approaching to the horizontal resistance.
The bulls need to break above the resistance
Manage your trades accordingly.

SNXUSDTRisk warning, disclaimer: the above is a personal market judgment based on published information and historical chart data on Tradingview, all analysis is only subjective. Hope investors consider, that I am not responsible for your investment decision.
Thank you.
Good luck

$SNX #SNX | LTF LONGIn case of a retest (preferably $1.61) on the lower support, bullish evidence can be chased in 1H.

SNX USDT 15 mins ICT Concept In 15 mins TF Market grab the liquidity and created choch and created a OB where market might fall after grabbing all the orders left.

SNX Short Chance for another Leg Down!!Here is another SNX/USDT Chance for Short Position, In the continuation of the sales transactions we had, a middle correction towards the Fibonacci specified in the image is possible, and by completing this correction, we can re-enter the selling position from the specified ranges towards the lower targets.
Pay attention that this movement can take a day or two, but the Fibonacci range is important for entry!! Friends who own the currency can accompany it in advance because there is a possibility that Fibo will not be seen and return from the current limits, but these ranges are for opening. Making a new position does not give us good risk and reward, so friends who are looking for a new position should wait until we enter the position at least in the 38% Fibonacci range 📊

#Synthetix is down 60% from H2 Highs, SNX Support at $1.76Past Performance of Synthetix
Synthetix remains under significant selling pressure. As an illustration, the token is down roughly 60 percent from H2 2022 peaks. Overall, SNX bulls have been struggling to add to their longs following the break above the bear flag in late November. Presently, clear support levels lie at $1.56 and $1.76, respectively.
#Synthetix Technical Analysis
SNX bears are in command from a top-down preview. In the short term, however, bulls appear to be in control inside a bull flag shaped by the November 30 bar. Though prices broke higher in a bullish continuation formation, there was no follow-through as SNX remains in range. The immediate resistance is at $2.05, marking November highs. Ideally, traders can buy the dip at spot rates if prices are above $1.76. Alternatively, conservative traders can buy once there is a breakout above $2.05 with equal trading volumes as those of November 30. In that case, SNX may float to $2.16 on November 9 and even $2.80 marking November highs.
What to Expect from #SNX?
SNX remains under pressure and in consolidation. Though the broader crypto market is bottoming up, there must be assurance in the SNX price action before traders commit. For now, prices are inside a bull flag set in motion by November 30 bullish engulfing bar, placing buyers in control in the short term.
Resistance level to watch out for: $2.05
Support level to watch out for: $1.76
Disclaimer: Opinions expressed are not investment advice. Do your research.

SNX continuation of growthHi everyone,
I will appreciate for ur activity. Thank you!
We are still in the ascending channel, I think that the growth will continue.
Targets: 2.05 and 2.15
Stop: 1.75
RR: 1 to 2
I hope my work suits you and you are satisfied.
DYOR!
