SNXget stop out but the fact i took profits partially
i ended up with profits
so wanna give it another chance.
SNXUSDT trade ideas


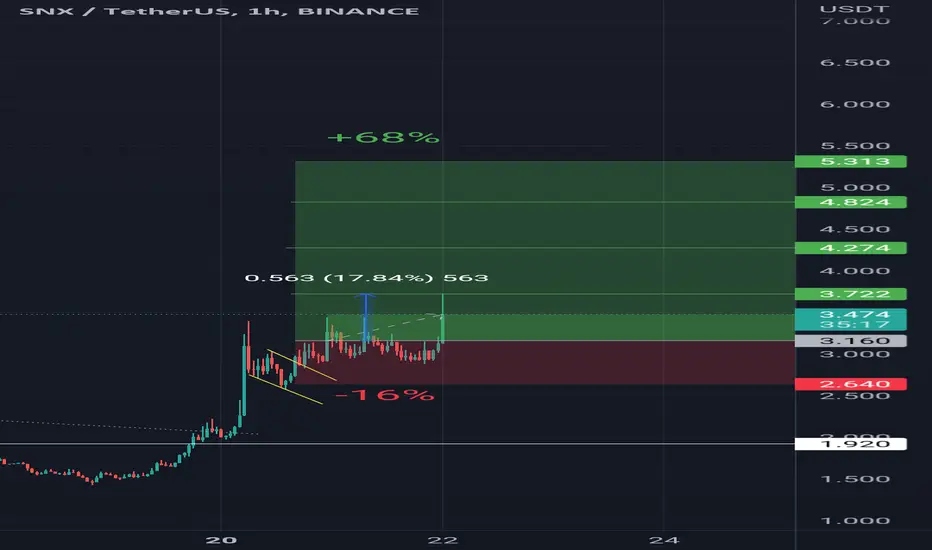
snx updateswaited for the pull back then retrace
im fully in that position
stop loss above the high
enjoy the ride


SNXUSDTIf the price is below the $ 2.792 price range, in the uptrend up to the $ 3.376 range, we can change the trend and have a downtrend.
I think this uptrend with this good momentum needs to be corrected (;

SNX Trade setup>>>>>>>>>Hello EveryOne
I Have Tried My Best to Bring the best Possible outcome in this Chart.
In the case of break's red line,
We can setup long position till next red line at top.
This is not financial advise.
PLZ DYOR
With hopping success>>>>>>>>>

SNXThe price has broken through 50 MA and a symmetrical triangle. There is strong resistance ahead at the downtrend line. Breaking through this level will raise the price to 100 MA. Bearish scenario indicated

SNX/USDT SHORT 3.300-3.5001. The global trend is down.
2. Correction in longs to 3.723.
3. Buying on volume, many people stayed in long with a good mood on social networks - "Trapped Traders".
4. I'm waiting for a rebound when approaching this zone.


SNX/USDTSNX / USDT
It is in a bearish channel that has lost its support of $ 2.5.
It is predicted to fall to the range of $ 1.2 with the selling pressure created.
#SNX #SNXUSDT #BTC #BTCUSD #LUNA #LUNC #UST

SNX longSNX has shown a good responses to level of demands so it can grow up to specified (specific) targets.(by considering loss limit)

SNXUSDT | Descending Wedge SetupDuring the last week, SNXUSDT has been forming a descending wedge pattern. All things considered - including the macro conditions of the market - this may potentially play out nicely for the bulls.
Please do your own research. This idea is not to be considered financial advice. May YeHoVaH bless you.

SNX Falling WedgeSNX is in a crazy falling wedge waiting to breakout. The percentage of this pole is calling for this target, but we have to knockout the resistance zone I have marked. RSI and Momentum are really low and have the chance to flip bullish here. Any flip in RSI and Momentum will have us breaking out of this wedge.
Min TP - $3.50
Stop - $2.70
This chart based off of The Elliot Wave Theory, Fibonacci, EMA’s, MacD, RSI, Momentum, and resistance/support zones combined with patterns.

SNXUSDT at Support - Seeing confluence to go longSynthetix has been ranging between the current support of $2.95 and $3.60
I'm seeing a few points of confluence at support and see on the TPO and 30minute imbalance chart that there is a possibility of short traders being trapped at the low if price moves up sharply
Confluence:
1. Fibonacci golden pocket area
2. Value area low of the fixed range
3. Possible Trapped short traders
4. Failed aution on a TPO (Time Price Opportunity) chart
5. Bullish divergence on the 15m (Vumanchu cipher b)
Not Financial advice. DYOR. Papertrade before using real money.
If you like this idea, please comment, give a thumbs up and follow for more ideas like these.
Safe trading guys!
Shawn

SNX short updateHey everyone,
SNX has broken the monthly open. This has triggered my short will try ride it down to the weekly open.

snx usdtThis page is made solely for displaying price information and the status of the projects in the market, and does not mean investment or approval of the project

instant executiontarget 1.8405 . order block with resisten level for confirmation. press like button if you agree


Synthetix (SNX) formd bullish BAT for upto 869% big moveHi dear friends, hope you are well and welcome to the new update on Synthetix ( SNX ) token.
On a monthly time frame, SNX has formed bullish BAT pattern.
Note: Above idea is for educational purpose only. It is advised to diversify and strictly follow the stop loss, and don't get stuck with trade

SNX range trading set ups. Hey ladies and gents,
SNX trading at the top of the range with a bearish divergence on the hourly. My bias is to the downside.
Happy trading
NFA


SNXUSD in downtrend channel, but long scalps are payingmade a nice gain scalping from 2.85, was chasing a little but still paid off. watching for clear break of 3.61 then i may enter for round 2 scalp trade.
For swings im watching for break of trend resistance, potential upside targets are 7.695-13.25-21.32
